18th International Conference on Structural Mechanics in Reactor Technology (SMiRT 18) Beijing, China, August 7-12, 2005 SMiRT18-F06-5
COMPUTER SIMULATION OF DROP TEST ON LEAD SHIELDED
SHIPPING CASK AND ITS VALIDATION
U.P. Singh, S.M. Ingole, A.G. Chhatre, S. Vedamoorthy
Nuclear Power Corporation of India Ltd., Anushaktinagar, Mumbai-400094, India
R.S. Mahajan, S. Raju
The Automotive Research Association of India, Pune-411004, India
ABSTRACT
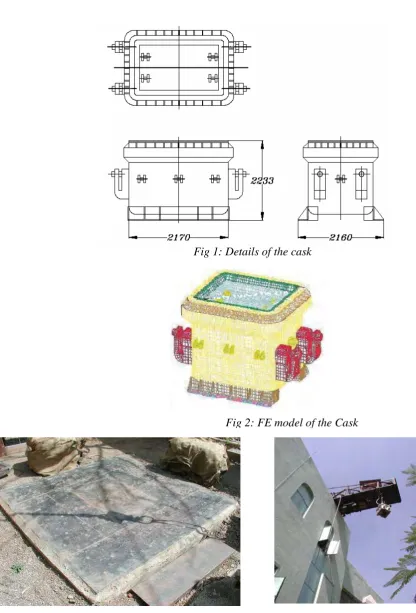
The spent fuel from the Nuclear Power Plants (NPP) in India is transported to the re-processing plant using lead shielded shipping cask. The shipping cask used is rectangular in shape with lead used as a shielding material sandwiched between inner stainless steel and outer carbon steel plates forming the sides of the container. The weight of the empty cask is about 55 tonnes. The drop of the prototype cask from a height of 9 meter was simulated numerically using a non-linear explicit code. An actual drop test was also carried out on a 1:4.5 scale model of the cask. High-speed cameras were used to capture the impact behavior of the cask during the actual test. The results of the actual drop test of the scale model from 9 meter height were compared with the simulated drop using Finite Element (FE) analysis. Measured value of damage parameters viz. maximum deformation, stress and the slump in the lead core of the dropped cask were compared. The drop simulation was carried out for different orientations of the cask viz. flat drop on bottom face and corner drop. After validation of the FE model, the numerical analysis of the prototype cask was carried out to confirm the shielding integrity of the lead-filled cask. The paper brings out the details of the finite element model, actual drop tests on a scale model, its comparison with the simulated drop test and the results of the simulated drop test of the prototype cask.
Keywords: Cask, Flat drop, Corner drop, Simulation, drop test
1.0 Introduction
The spent fuel shipping cask is required to meet the requirements of Indian Atomic Energy Regulatory Board (AERB) Safety Code SC/TR-1 [1] for demonstrating the ability to withstand normal conditions of transport and accidental conditions during transport. The ability of the cask to withstand accident conditions of transport is verified by conducting a 9 meter drop test.
2.0 Methodology
As, the 9 meter drop test on the prototype cask is not feasible considering its huge weight of 60 tonnes, the drop test was simulated numerically using non-liner FEM analysis on a 1:4.5 scale model and the results were validated by actual drop test on a scale model. The validated FE model of the cask was then further used for numerical simulation of the full-scale prototype model.
3.0 Finite Element Modeling of the Cask
The finite element model of the cask is shown in Fig-2. The entire model is discretized with shell, brick and beam elements.
4.0 Drop Test on Scale Model
The 1:4.5 scale model was decided based on the practical consideration of fabrication and handling at the test facility which requires having a weight less than 1 tonne. The weight of the scale model was approx. 800 kg. For the purpose of validating the FE model, simulation of the drop tests were performed on the scale model for the following drop orientations.
1) Corner Drop
2) Flat Drop on bottom face
A total of 4 samples were drop tested – two each for corner drop and flat drop.
5.0 Test set-up
The test set-up used for conducting the drop test is shown in Fig-3. The test set-up consists of an unyielding surface and a chain-pulley arrangement for raising the cask. The design of the un-yielding surface was carried out to meet the requirements of IAEA safety series regulation-37, section-VII [2].
6.0 Drop test procedure
High-speed cameras (with speed of 500 frames/sec) were used to capture the impact behaviour of the cask during the actual drop test.
7.0 Comparison of Test Results and Validation of FE Model
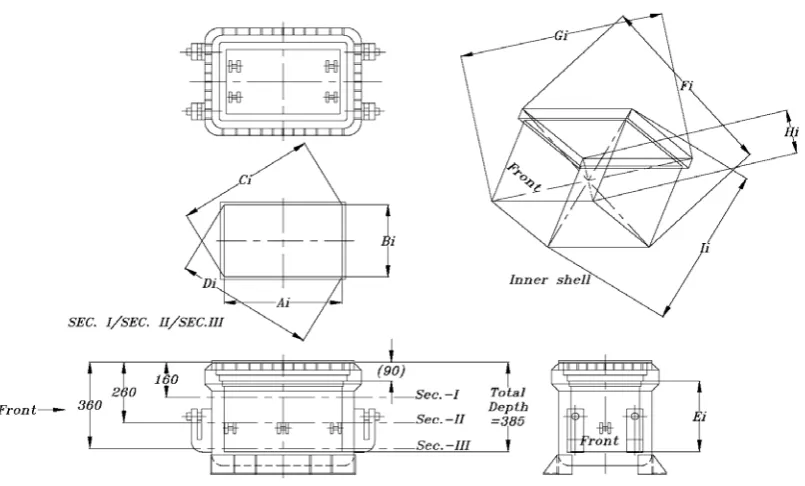
7.1 The validation of the FE model was based on the comparison of deformation and stress levels obtained by analytical simulation and from the actual drop test at some selected locations. For comparison of deformation, internal and external critical dimensions at three different sections across the height and the corner-to-corner dimensions were measured before and after the drop test. These dimensions are shown in Fig-4 and Fig-5.
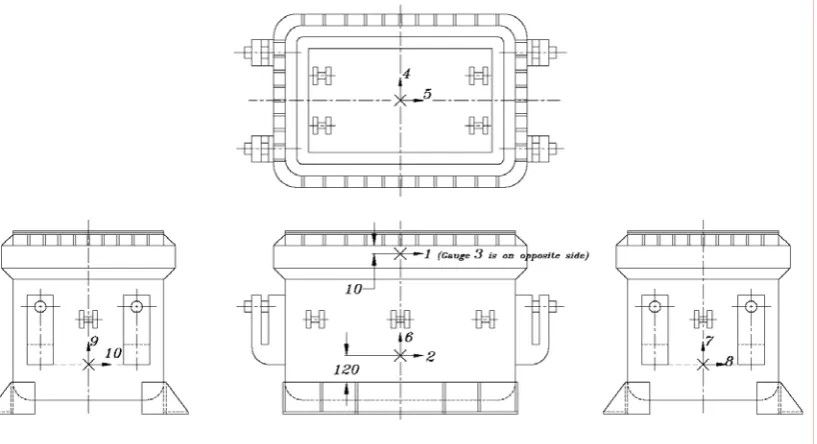
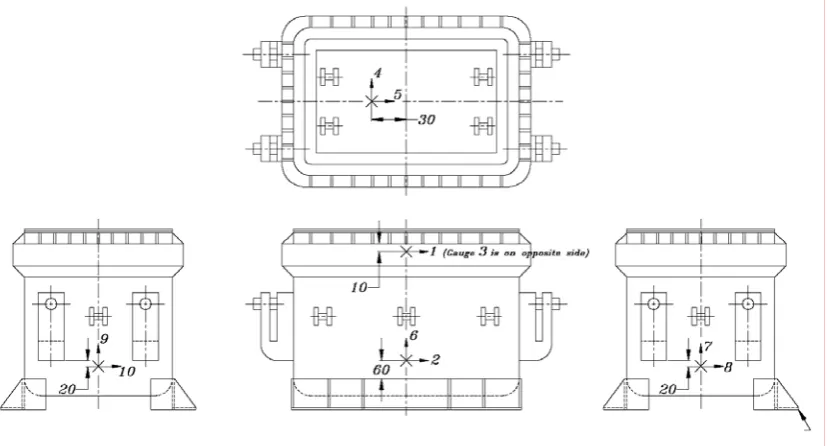
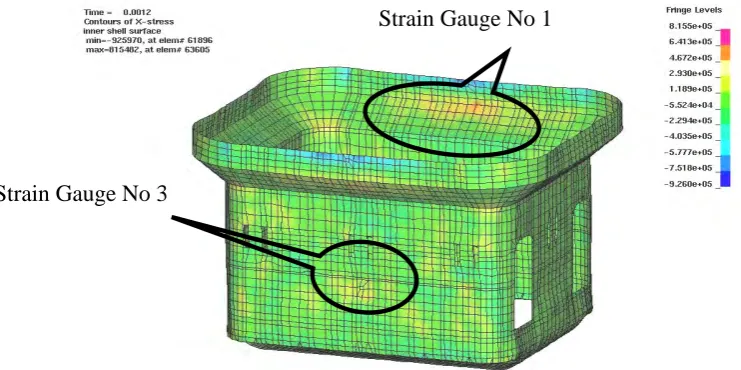
7.2 For comparison of stress levels, 10 strain gauges were pasted for the flat and the corner drops. The locations of these strain gauges are shown in Fig-6 and Fig-7. The strain gauge data was acquired at a 20 kHz sampling rate with a high-speed data acquisition system.
7.3 Comparison of deformation 7.3.1 Flat drop
The maximum deformations of the cask in the FE simulation and in the actual drop test (average value of two tests) were compared for the critical dimension selected for comparison as shown in Fig-4 and Fig-5. The deformation values for flat drops are given in Table-I. The comparison between the deformation of the inner shell of the cask during both simulated and actual drop test is shown in Fig-8. In either case, there was no visible deformation. The comparison between the deformation of the lid with simulated and actual drop test, which were 13.4 mm and 10 mm respectively is shown in Fig-9.
7.3.2 Corner drop
For the corner drop, the measured values of deformation were compared with those of the analytical simulation and are given in Table-2(a) & Table-2(b).
7.4 Comparison of stress levels
The stress level computed from the strain gauge data obtained during both the flat drop and corner drop were compared with the finite element simulation results and are given in Table 3 and Table 4 respectively.
The stress level (Ref Table-3 and Table-4) were computed for the elements in a zone within a radius of 10mm around the location of strain gauges. This was done to understand the stress variation due to the positional variations in the placement of strain gauges and dimensional variations due to manufacturing. The large variation in stress range at some locations is attributed to the following reasons.
- Although the two components used for the two drop tests were identical, there could be likelihood of slight variation in the dimensions of the components during manufacturing.
- Even though, visually, the drops were perfectly flat, there could be variations within a couple of degrees, which can result in large variation in stress patterns. Similar studies carried out elsewhere have shown the stress variation of approximately 25-30% for 1 degree change in drop angle.
- The variation in placement of strain gauge even within ± 5mm is likely to cause large variation in stress values.
It can be observed from Table-3 and Table-4 that the simulated stress levels at 7 locations out of 10 for flat drop and all locations for corner drop were below the yield stress of 326.5 N/mm2 for the material. However, at 3 locations viz. guage1, 3 and 5 for flat drop, the stresses were exceeding the yield stress. The stress plots as shown in Fig-14 and Fig-15 for these locations clearly indicate that these are very localized high stresses, which may be due to local vibrations. It was seen that these stresses lasted only for a very short duration.
8.0 Study of Prototype Model from Simulation
After validating the FE model for 9 meter drop on a scale model, the simulation of the 9 meter drop was carried out on a prototype model.
9.0 Conclusion
1) The deformation results predicted by the simulation correlate very well with the drop test results in case of both flat as well as corner drop.
2) The overall deformation at almost all locations concerned with the lead shielding was within 1-2%.
3) No significant failure or damage to outer or inner shell was observed carrying concern was observed either experimentally or analytically in both the drops.
10.0 References
1.0 AERB Safety Code SC/TR-1, 1986
2.0 IAEA safety Series regulation-37, section-VII, 1995.
Table -1 Comparison of Deformation of Cask Flat Drop Tests and Simulation Results (Scale Model)
OUTER DIMENSION
Section Ao Bo Co Do Eo
TEST (mm) FEM (mm) TEST (mm) FEM (mm) TEST (mm) FEM (mm) TEST (mm) FEM (mm) TEST (mm) FEM (mm)
I -1.5 -1.5 0 1.69 1.5 -0.3 -2.5 0 -3.0 8.51
II -2.5 -3.1 2.0 0.01 1.5 -0.1 -5.5 1.6 III -2.0 0.0 7.5 3.69 2.0 -0.7 -0.5 0
INNER DIMENSION
Section Ai Bi Ci Di Ei
TEST (mm) FEM (mm) TEST (mm) FEM (mm) TEST (mm) FEM (mm) TEST (mm) FEM (mm) TEST (mm) FEM (mm)
I -2.0 -1.2 -0.5 1.2 1.0 -0.16 -2.5 0.06 -1.0 -1.24
II -3.0 -3.8 -1.0 -0.4 0 -2.36 -2.0 0.24
III -2.0 -3.4 1.0 -0.4 -2.0 -0.16 -1.0 -0.06
Table-2(A) Comparison of Deformation of Flask Corner Drop Tests and Simulation Results (Scale Model)
OUTER DIMENSION
Section Ao Bo Co Do
TEST (mm) FEM (mm) TEST (mm) FEM (mm) TEST (mm) FEM (mm) TEST (mm) FEM (mm) I -1.5 -0.2 1.5 1.0 0.5 -1.0 0.5 1.7
II -4 -1.2 -1.0 -0.1 0 -0.4 -2.5 2.0
III -2.25 0.8 4.0 -1.01 3 -0.8 -1.5 0.9
INNER DIMENSION
Section Ai Bi Ci Di
TEST (mm) FEM (mm) TEST (mm) FEM (mm) TEST (mm) FEM (mm) TEST (mm) FEM (mm)
I -2.0 -1.6 0 -0.7 1.0 -2.26 1.0 -1.36
II -3.5 -2.5 0.5 -1.4 2.0 -2.06 0.5 -1.56
Table-2(B) Comparison of Deformation of Flask Corner Drop Tests and Simulation Results (Scale Model)
OUTER DIMENSION
Section Eo Fo Go Ho Io
TEST (mm) FEM (mm) TEST (mm) FEM (mm) TEST (mm) FEM (mm) TEST (mm) FEM (mm) TEST (mm) FEM (mm)
I 3.5 0.56 -1.0 -0.4 3.0 1.0 5.5 0.6 -81 -76.3
INNER DIMENSION
Section Ei Fi Gi Hi Ii
TEST (mm) FEM (mm) TEST (mm) FEM (mm) TEST (mm) FEM (mm) TEST (mm) FEM (mm) TEST (mm) FEM (mm)
I 1.0 -0.07 0 -0.34 2.5 0.31 2.0 0.26 1.0 -0.13
Table-3
Comparison of Stresses at Strain Gauge Locations for Flat Drop Test and Simulation Results
Drop Test Results – Stress (N/mm2) Simulation Stress (N/mm2) Location
Flat Drop-I Flat Drop-II Average Stress Stress (range)
1 285 126 205.5 514 264-625
2 - 221 221 200 4-211
3 279 88 183.5 602 335-673
4 - 180 180 266 90-309
5 314 326 320 398 108-563
6 418 - 418 227 16-180
7 377 116 246.5 225 44-293
8 341 61 201 222 191-261
9 332 247 289.5 209 182-236
10 409 55 232 184 161-192
Table-4 Comparison of Stresses at Strain Gauge Locations from Corner Drop Test and Simulation Results
Drop Test Results – Stress (N/mm2) Simulation Stress (N/mm2) Location
Corner Drop-I
Corner Drop-II
Average Stress Stress (range)
1 112 - 112 131 25-131
2 172 - 172 109 16-126
3 216 252 234 155 105-195 4 101 646 373.5 74 47-72 5 103 465 284 65 32-67
6 157 - 157 183 23-218
7 132 338 235 190 1-190
8 198 - 198 305 158-363
9 114 372 243 60 13-60
Table-5 Deformation Results of main cask after flat drop by simulation Outer Dimensions Section Ao mm (%) Bo mm (%) Co mm (%) Do mm (%) Eo mm (%) I 5.3 (0.24) 8.5 (0.45) 0.0 (0.0) 0.3 (0.01) II -19.1 (-0.87) 3.3 (0.16) -0.7 (-0.02) 1.8 (0.06) II 1.5 (0.07) 14.9 (0.81) 3.0 (0.11) -3.2 (-0.12) 43.8 (2.0) Internal Dimensions Ai mm (%) Bi mm (%) Ci mm (%) Di mm (%) Ei mm (%) I -12.0 (-0.76) -5.3 (-0.43) -0.9 (-0.04) -0.7 (-0.03) II -20.4 (-1.2) -7.7 (-0.62) -0.8 (-0.04) -1.2 (-0.06) II -17.3 (-1.0) -7.2 (-0.58) -1.2 (-0.06) -0.8 (-0.04) -7.4 (-0.50)
Table-6 Deformation Results of main cask after corner drop by simulation Outer Dimensions Sectio n Ao mm (%) Bo mm (%) Co mm (%) Do mm (%) Eo mm (%) Fo mm (%) Go mm (%) Ho mm (%) Io mm (%) I 2.6 (0.12) -2.8 (-0.15) -8.35 (-0.31) 11.0 (0.41) II -12.0 (-0.55) -6.2 (-0.34) -0.35 (-0.01) 7.0 (0.26) II -4.3 (-0.19) -11.2 (-0.62) 1.65 (0.06) 1.65 (0.06) 14.8 (0.70) -9.2 (-0.25) 2.9 (0.07) 1.2
(0.03) (-9.71)-356.2
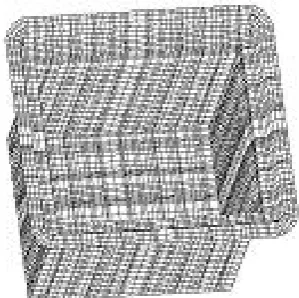
Fig 1: Details of the cask
Fig 2: FE model of the Cask
Fig 3: Test set-up
Fig 4: External Dimensions of the Scale Down Cask
Fig 4: External dimension of Scale Down Cask
Fig 7: Strain Gauge Locations for Corner Drop
Experimental Simulation
Experimental Simulation
Fig 9: Comparison of deformation of the lid
a) Experimental b) Simulation
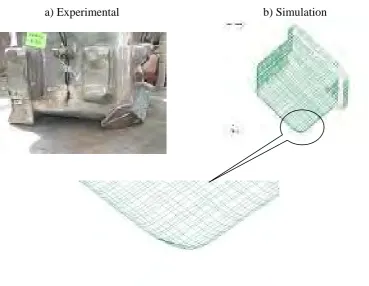
Fig 10: Comparison of deformation of dropped corner
a) Experimental b) Simulation
a) Experimental
60.68 mm
b) Simulation
Fig 12: Comparison of deformation of trunnion
a) Experimental b) Simulation
Fig 15: Stress Plot for Outer Cladding (Strain Gauge No. 1 and 3)
Strain Gauge No 5
Fig 14: Stress Plot for Lid (Strain Gauge No. 5)
Strain Gauge No 1