ABSTRACT
GHOSH, MADHUJA. Behaviorally Modeled Code-Modulation Based Embedded Test for Phased Arrays. (Under the direction of Brian Floyd.)
Emerging technologies such as fifth-generation cellular communications (5G), satellite
communications, short-range communications and defense applications require high
performance phased arrays. A significant portion of the production cost of these systems
is contributed by the test and calibration of the phased arrays. Built-in Self-Test (BIST)
provides alternative low-cost technique of performing on-site chip diagnosis of the array
elements, eliminating the requirement of external vector network analyzers (VNAs) to
measure gain and phase of individual array channels. In such tests,in situmeasurement
of each array element allows capturing of array-level degradations such as supply-voltage
variations, mutual element coupling or process variations in terms of amplitude and phase
response of a calibration signal. A typical approach to perform such tests is to introduce
an input test signal into the RF signal path to excite an array. The response of the array is
then measured with a test signal processing unit such as a power detector or a coherent
quadrature down-conversion mixer.
The state-of-the-art CoMET or Code-Modulated Embedded Test, was such a BIST
ap-proach that allowed a fast and simple way to calibrate phased arrays using orthogonal codes.
This technique used an on-chip embedded path to inject a millimeter-wave calibration
signal into the elements through a built-in parallel distribution network. Code-modulation
was employed to the test signal at the phase shifter to rotate the phase of each array
ele-ment across the four Cartesian quadrants. The combined array response was then passed
through a square-law device and down-converted into a baseband. The squaring operation
allowed the baseband to be comprised of element-pair correlations where each correlation
term was modulated by the product of two unique codes. These orthogonal code products
parameters were extracted. The parameters extracted were each element’s output power,
phase response, quadrature accuracy and relative phase offset to other elements. CoMET
was implemented in 0.13µm SiGe BiCMOS technology for a four-element receiver array.
The measurement was performed using an oscilloscope and the baseband waveform was
processed in Matlab. Gain and phase of each element were extracted using CoMET, and
compared with measured results using a VNA which were accurate within 1 dB and 5◦
respectively. To improve the extraction accuracy of CoMET, a methodical approach is
nec-essary to establish the robustness of this testing technique. For this, it is important to
account for the behavioral circuit non-idealities that affect phased array channels. Further,
it needs to be investigated whether these imperfections introduce errors into the CoMET
technique itself, thus degrading the accuracy of CoMET-based extraction. Finally, it needs
to be explored if there exists a better approach or perhaps a modification in existing CoMET
technique that can calibrate out the non-ideal response of phased array circuits.
In this work, CoMET has been extended for use in a series-feed series-combining
sce-nario, allowing this technique to be used in a wider range of phased arrays. To achieve this,
a behavioral model-based implementation of CoMET has been performed. The calibration
signal is injected using an embedded feeding’ network and extracted using a
‘series-combining’ network, employing two input and two output ports for signal injection and
extraction respectively. This technique permits quadruple sets of measurement data which
allow extraction of amplitude errors, phase errors and phase offsets caused due to input
and output path delays in series type networks.
Inaccuracies in parameter extraction occur predominantly from imbalances in
signal-encoding at the phase shifter. To analyze the accuracy of CoMET extraction, an error model
comprised of the typical phase shifter non-idealities is constructed. This prototype is
integrated into the CoMET-behavioral model from which non-ideal response of the array
are analyzed and errors are extracted. The additional measurement capabilities provided
technique itself. Matlab results shows good accuracy between array channel response to
© Copyright 2019 by Madhuja Ghosh
Behaviorally Modeled Code-Modulation Based Embedded Test for Phased Arrays
by
Madhuja Ghosh
A thesis submitted to the Graduate Faculty of North Carolina State University
in partial fulfillment of the requirements for the Degree of
Master of Science
Electrical Engineering
Raleigh, North Carolina
2019
APPROVED BY:
Paul Franzon Jacob Adams
Brian Floyd
DEDICATION
BIOGRAPHY
The author was born and raised in West Bengal, India. She received two undergraduate
degrees, first in Physics and second in Radio Physics and Electronics in the years 2010
and 2013 respectively from the University of Calcutta, India. She was a research scientist
at SAMEER Kolkata Centre, India from 2013 to 2016 where her work and interests were
focused on design of millimeter-wave transceiver systems.
In the year 2016, she joined the research group, iNtegrated Circuits and Systems lab
at NC State (iNCS2) under the direction of Professor Brian Floyd. At iNCS2, her work was
focused on exploring low-cost techniques to characterize millimeter-wave phased array
systems. During her time at NC State University, she completed one internship at Anokiwave
Inc. in the summer of 2019 where she worked on millimeter-wave circuit design for 5G
ACKNOWLEDGEMENTS
I thank my advisor, Prof. Brian Floyd for his patient guidance and motivation throughout my
time as his student. I am grateful to him for providing insightful ideas about my research and
appreciate his prompt response to my countless queries on work. I extend my gratitude to
Prof. Paul Franzon, Prof. Michael Steer and Prof. Jacob Adams for their valuable comments
and suggestions about my research. I also have to thank Prof. J. Townsend and Prof. R.
Evans for being kind and making my work easy as a teaching assistant under them at NC
State.
Next, I would like to thank Dr. Kevin Greene and Dr. Yi-Shin Yeh, alumni of my research
group, for their invaluable help on my research project, Mr. Sandeep Hari for his help in lab
measurements and the intuitive discussions on a plethora of topics related to electrical
en-gineering and outside, Mr. Jeff Bonner-Stewart for imparting knowledge on lab equipment
fixes, and rest of the research group members of iNCS2lab for the innumerable discussions
related to work, and for giving me fond memories of graduate school life.
Lastly, I have to thank my parents and family for their unconditional love towards me
TABLE OF CONTENTS
LIST OF TABLES . . . vii
LIST OF FIGURES. . . viii
Chapter 1 INTRODUCTION. . . 1
1.1 Prior work on BIST techniques . . . 3
1.2 Review of CoMET state-of-the-art . . . 8
1.2.1 Experimental verification . . . 13
1.3 Objective . . . 16
Chapter 2 Series-fed phased array architecture . . . 18
2.1 Limitations of state-of-the-art CoMET . . . 19
2.2 Motivation for a modified BIST architecture . . . 21
2.3 CoMET embedded series-fed phased array architecture . . . 23
2.4 Mathematical analysis of the modified approach . . . 28
2.4.1 Encoding mechanism . . . 28
2.4.2 Decoding mechanism . . . 32
2.4.3 Matlab-based extraction . . . 36
2.4.4 Other series topology variants . . . 40
2.4.5 Accuracy of extraction . . . 43
2.5 Conclusion . . . 43
Chapter 3 Phase shifter error model . . . 45
3.1 Basic theory . . . 46
3.1.1 Mathematical analysis . . . 47
3.2 Non-idealities of Phase Shifter . . . 49
3.2.1 Quadrature amplitude and phase imbalance . . . 50
3.2.2 Transformer balun amplitude and phase imbalance . . . 50
3.2.3 Gain-dependent phase variation of VGAs . . . 52
3.2.4 I-Q Cross-talk . . . 53
3.3 Impact of non-idealities on phase shifter output . . . 53
3.4 Conclusion . . . 57
Chapter 4 CoMET behavioral model . . . 58
4.1 Non-ideal response of array elements . . . 59
4.1.1 Quadrature phase error . . . 59
4.1.2 VGA phase error . . . 61
4.1.3 I/Q Crosstalk error . . . 61
4.2 Behavioral model . . . 62
4.2.1 Modification in encoding . . . 64
4.2.2 Extraction of array performance metrics . . . 65
4.3 Accuracy: State-of-the-art vs. Modified approach . . . 69
Chapter 5 CONCLUSION . . . 75
5.1 Summary of work done . . . 77
5.2 Future Work . . . 78
BIBLIOGRAPHY . . . 80
APPENDICES . . . 83
Appendix A Equations . . . 84
Appendix B Matlab Code . . . 86
B.1 Phase shifter error model . . . 86
B.2 CoMET code . . . 88
B.2.1 Generating measurement set . . . 88
LIST OF TABLES
Table 2.1 Port conditions for the four measurement sets . . . 25
Table 2.2 Summary of phase arguments and the unknown array parameters obtained from the signal equations of the four different measurement sets for a two-element phased array . . . 32
Table 2.3 Summary of phase arguments obtained from correlation equations corresponding to the four baseband data-sets . . . 35
Table 2.4 Summary of CoMET-based measurement sets obtained from the series variants. . . 42
Table 3.1 Magnitude and sign ofAI andAQ vectors for different phase states across the four Cartesian quadrants . . . 49
Table 4.1 Phase errors in element response due to quadrature amplitude and phase imbalance in coupler. . . 60
Table 4.2 Phase errors in element response due to VGA phase error. . . 62
Table 4.3 Phase errors in element response due to I/Q Crosstalk. . . 63
Table 4.4 Extraction parameters for an ‘n’ element array . . . 65
Table 4.5 Summary of phase arguments obtained from decoding four different measurement sets . . . 67
LIST OF FIGURES
Figure 1.1 Illustration of available unlicensed millimeter-wave spectrum . . . . 2 Figure 1.2 Prior BIST techniques for characterizing millimeter-wave phased
arrays.[Gre17](a) Using power detectors shown in red and yellow to extract elemental power and relative phase information between adjacent elements. (b) A coherent IQ down-conversion receiver to extract amplitude and phase information from each array element 4 Figure 1.3 Phased-array receiver with chip-level BIST system[Kim12] . . . 5 Figure 1.4 Phased-array far-field characterization using orthogonal coding
technique[Lie10]. . . 6 Figure 1.5 Block diagram of a receiver array using CoMET[Gre18] . . . 6 Figure 1.6 Characterization of 8-element TX array using over-the-air CoMET
[Hon19]. . . 7 Figure 1.7 Block diagram of a CoMET-embedded four element phased array a)
receiver and b) transmitter[Gre17] . . . 10 Figure 1.8 An illustration of the modulated phase-shift response in the the
time domain[Gre17] . . . 11 Figure 1.9 Illustration of baseband data processing in CoMET technique[Gre17] 14 Figure 1.10 Performance parameters extracted in a swept power response using
CoMET compared to the measured response of individual elements using a VNA[Gre17] . . . 15
Figure 2.1 Block diagram of a four-element phased-array transceiver employ-ing on-chip series-fed BIST network[Yeh18] . . . 22 Figure 2.2 Block diagram of a phased-array receiver in the feed
series-combine BIST architecture . . . 24 Figure 2.2 Illustration of the four measurement sets. Indicated in red, are the
signal injection and extraction path directions in the series-feed series-combine BIST topology. . . 27 Figure 2.3 Illustration of measurement set 1 in a two-element phased array. The
active ports and path of calibration signal injection and extraction are indicated in red. The inactive ports are faded. . . 29 Figure 2.4 Polar diagram illustrating code-modulation of the in-phase and
quadrature-phase components across the four Cartesian quadrants. 30 Figure 2.5 Extraction of series phase offsets in the input and output networks. 37 Figure 2.6 Extraction of quadrature phase errors,φ11 andφ22in elements 1
and 2 respectively. . . 38 Figure 2.7 Extraction of amplitude and phase response of elements 1 and 2. . 39 Figure 2.8 CoMET employed in other series variants of BIST topology. . . 41
Figure 3.1 Block diagram of a vector interpolator type phase shifter. . . 47 Figure 3.2 (a) Graphical representation of phase synthesis (b) Magnitude and
Figure 3.3 Impact of quadrature amplitude and phase imbalance on signal constellations for different I and Q VGA gain settings. . . 51 Figure 3.4 Impact of transformer balun amplitude and phase imbalance on
signal constellations for different I and Q VGA gain settings. . . 52 Figure 3.5 Impact of gain-dependent phase variation of VGAs on the phase
states. . . 53 Figure 3.6 Impact of I-Q Cross-talk on phase states. . . 54 Figure 3.7 Signal constellations for different I and Q VGA gain settings for an
ideal phase shifter in the absence of non-idealities. . . 55 Figure 3.8 Polar diagrams illustrating effects of phase shifter non-idealities on
the chosen 16 gain settings. . . 56
Figure 4.1 Comparison of ideal and non-ideal phase response of an array chan-nel. Due to non-idealities, the ideally linear response (shown in black) get distorted (shown in red). . . 60 Figure 4.2 Comparison of ideal and non-ideal phase response of an array
chan-nel with VGA phase error,φl i n =10◦. . . . 61
Figure 4.3 Comparison of ideal and non-ideal phase response of an array chan-nel with I-Q Cross-talk co-efficients,α1=α2=25%. . . 63 Figure 4.4 Phase response of an element when it is subjected to quadrature
amplitude imbalance (Ac=1.5dB) and phase imbalance (φc =10◦) across the 16 phase settings. Comparison is made between the phase response obtained from the extraction using CoMET prior art (shown in black squares), this work (shown in red solid line) and the individual element response (shown in yellow circles). . . 71 Figure 4.5 Comparison of phase response when array is subjected to VGA
CHAPTER
1
INTRODUCTION
At millimeter-wave frequencies, there is a vast range of unlicensed spectrum that can be
used to achieve high speed wireless data communication as shown in Figure 1.1.
Advance-ment in silicon-based semiconductor technology where maximum oscillation frequencies
can go above 200 GHz have enabled design and integration of complete transceivers
on-chip in the millimeter-wave regime. Such transceivers find applications in radar technology,
fifth-generation new radio (5G NR) cellular communication, short-range point-to-point
communication around 60 GHz, millimeter-wave imaging etc.[Kis10a].
At these high frequencies, the effective dimension of a communicating omni-directional
antenna is drastically reduced which lowers the equivalent power transmitted or received by
the system[Bal16]. The emergence of phased arrays or beam-formers occurred as a means
Figure 1.1Illustration of available unlicensed millimeter-wave spectrum
a directive beam that could be electronically steered to a desired direction[Sko81; PZ02a;
PZ02b]. Phased array systems have successfully demonstrated multi-Gbps speed with 8, 16
and 32 elements. However, as the number of elements begins to rise, a significant part of
the operating cost is invested in the testing of these millimeter-wave phased arrays[Gre16].
This include the lab equipment upgrades required to perform these measurements such
as vector network analyzers, signal generators, power detectors, spectrum analyzers etc.
Apart from the expensive equipment, the testing time is yet another factor that primarily
contributes to the cost of test[Gre17]. Since phased arrays consist of multiple elements,
each element needs to be characterized individually across different phase settings, to
calibrate the array as a whole. Further, a high density of circuitry on-chip impose serious
challenges upon the ability to trace circuit impairments due to functional errors or ageing
of the individual blocks within the transceiver[Kis10b]. To simplify testing procedures as
well as perform an on-chip circuit diagnosis, a new type of test procedure called Built-In
Self-Test or BIST was introduced[Akb04]. BIST enables parallel characterization of phased
array elements using simple low-cost, low-frequency test equipment at the expense of
additional testing circuitry area and slightly increased power consumption on-chip.
The work presented in this thesis focuses on the behavioral modeling a novel BIST
technique that can be implemented using low-cost, low-frequency test equipment. The
easily implemented on-chip to simultaneously characterize multiple array elements.
1.1
Prior work on BIST techniques
Phased arrays are used to synthesize beam patterns in a desired direction. The quality of
measured pattern is dependent on the accuracy of amplitude and phase response within
each element of the array. Current manufacturing tests for phased arrays requires each
element to be individually measured using expensive millimeter-wave test equipment.
BIST techniques offer simple low-cost ways to detect errors in the phased array system that
can be introduced from antenna, chip-packaging, non-linearities of amplifiers and phase
shifters. Larger arrays are becoming essential in high performance communication systems.
Millimeter-wave phased arrays using 16-32 elements have been demonstrated in[Val10;
Coh10; Ina13; Kim12]. RF power detection in BIST techniques have been demonstrated by
using power detectors in[Tak14; Sle10; Coh12]or by using I/Q downconversion mixers in
[Ina12; Ina13; Kim12; Kan16; Yeh18]to generate baseband signals. Illustrated in Figure 1.2
are BIST detection approaches commonly used on phased array systems.
In[Tak14], multiple built-in blocks were used within the receiver for monitoring and
measuring gain and phase response. In[Sle10]power detectors were used to calibrate a 60
GHz low noise amplifier performance by dynamic adjustment of operating points under
varying conditions of PVT (Process Voltage and Temperature). In[Coh12], BIST system is
embedded in the array to extract the gain, output power and phase difference of the TX and
RX elements. RF signal coupled from two adjacent chains are combined and a common
detector is used to sense the phase difference between them. Power detectors were also
used at each element’s output to extract output power. Gain and power in both TX and RX
are measured using two additional detectors and a loopback path.
The use of I/Q down-conversion receiver was presented in[Kim12]. The work
Figure 1.2Prior BIST techniques for characterizing millimeter-wave phased arrays.[Gre17](a) Using power detectors shown in red and yellow to extract elemental power and relative phase information between adjacent elements. (b) A coherent IQ down-conversion receiver to extract amplitude and phase information from each array element
signal that could be distributed to a 16-element phased array receiver system as shown
in Figure 1.3. The detection technique required using in-phase (I) and quadrature-phase
(Q) homodyne mixers to allow measurement of phase and amplitude of individual array
channels where each channel could be turned on sequentially. Drawbacks of this approach
include requirement of coherent I/Q down-conversion receivers that occupy significant
area on-chip. Also, the technique does not allow for parallel measurement of multiple
element response.
To allow parallel characterization of array elements, orthogonal codes were used to
modulate a calibration test-signal and was presented in[Sil97; Lie10; Gre18]. In[Sil97],
two algorithms, UTE (Unitary Transform Encoding) and CCE ( Control Circuit Encoding)
were introduced for remote calibration of phased array antennas. The technique involved
transmission of multiplexed orthogonally encoded signals that could be received and
co-herently detected, combined in vector forms, and decoded with the inverse of the encoding
matrix. The UTE algorithm requiring additional encoding hardware was more suited for
beamform-Figure 1.3Phased-array receiver with chip-level BIST system[Kim12]
ers. The CCE method encoded phased array elemental signals using Hadamard matrices
[Wal23]to allow simultaneous measurement of all array elementsin-situ. The CCE
tech-nique was further used to calibrate active phased array antennas in[Lie10]. This work
involved free-space measurement which relied on code modulation as shown in Figure
1.4. A coherent source was applied to the input of the array, the signal was mixed with
orthogonal codes. The encoded signal was radiated and received through a calibration
probe and sent to a coherent receiver and processor. The merit of this approach was that
each element response was obtained through correlation of the received signal with the
original code. However, a key challenge for this technique was the need for a coherent
receiver to perform BIST on the array. Additionally, the technique was hardware-intensive
requiring a calibration probe and coherent receiver. Finally, a code-modulation based
novel technique called Code-Modulated Embedded Test (CoMET) was presented in[Gre16;
Gre17; Gre18]. This technique, allowed for parallel measurement of the array with very
Figure 1.4Phased-array far-field characterization using orthogonal coding technique[Lie10]
using CoMET is illustrated in Figure 1.5, where corresponding waveforms are shown at key
nodes. It eliminates the need for I/Q down-conversion and uses a single power detector
to down-convert the combined array response into baseband. Each element is uniquely
code-modulated by a sequence from the Hadamard-Walsh[Wal23; Edw75]matrix which
encodes each element uniquely. A single power detector allows correlation-based extraction
of performance parameters of the array. CoMET was further demonstrated for free-space
characterization and calibration of an 8-element phased array transceiver packaged with
antennas[Hon19]. A high-gain horn antenna in the far-field detected the code-modulated
transmitted signal from the array as shown in Figure 1.6a. The signal was then amplified
and sent back over free-space to the on-chip power detectors to create a cross-correlation
based interference pattern from which the array performance parameters were extracted.
The extracted gain and phase response in comparison to VNA measuremets were accurate
to within 0.4 dB and 4◦respectively. Additionally, a calibration loop was used to equalize
gain and phase response across the array elements which resulted in gain and phase offsets
to be reduced to 1.1 dB and nearly 0◦respectively. The calibrated beam pattern is shown in
1.6b.
(a)Measurement setup (b)Pre- and post- calibrated beam pattern for
eight-element TX array
The benefit of CoMET is that it is a built-in approach and can be used for characterizing
chip-level phased arrays. It avoids the use of I/Q down-converters and uses a single power
detector for converting array response to baseband, saving significant area on-chip. The
elements on-chip are active during the measurement. Thus, performance impairments due
to non-ideal array operation such as mutual coupling are included in the characterization.
This technique by far stands out from the other BIST approaches discussed above in terms of
the simplicity of its implementation and the the ease of parameter extraction. The following
chapters will discuss the need to implement CoMET in a new BIST architecture. However,
to better understand this testing technique, a brief review of the state-of-the-art CoMET
approach is done next.
1.2
Review of CoMET state-of-the-art
CoMET was introduced as a behavioral model in[Gre16]for a four-element phased
ar-ray receiver and was later designed and demonstrated on-chip in a 60 GHz receiver and
transmitter as shown in Figure 1.7(a) and (b) respectively[Gre17; Gre18]. This BIST
ap-proach involved a parallel-feed network architecture embedded in a four-element receiver
is shown in Figure 1.7(a). A millimeter-wave test signal (also known as calibration signal
in this report), was injected into the array and equally power-divided to the front-end of
each element path in the array by way of coupling the test signal into the RF input lines
of each element. The signal was then amplified by the LNA of gain,G, and then phase
modulated at the phase-shifter. At the phase-shifter the test signal was branched into
in-phase (I) and quadrature-in-phase (Q) waves where unique Rademacher codes,ci andcq
[Edw75]were applied to the signal at each element respectively as shown in Figure 1.5. The
phase shifter topology used in COMET is an active vector-interpolator type[TN09]. In this
topology, the codes applied to each of the I and Q channels may be phase inverted at any
and coupled into a square-law device such as a power detector. The detector performed a
squaring operation that down-converted the combined array response into a baseband
signal which was comprised of the cross-correlation of two elemental responses along
with their corresponding orthogonal codes mixed together. Thus each correlation term
consisted of a unique orthogonal code-product (OCP). The OCPs are formed by the
multi-plication of two codes whose product forms a new, unique orthogonal code. One subset
of the Walsh-Hadamard[Wal23]functions contain the OCP property which were used in
this work. The novel concept of OCP enabled element-pair correlations to be extracted
by decoding the modulated baseband signal using corresponding OCP. The orthogonal
nature of the codes allowed only a single cross-correlation to be filtered out at a time. The
correlations that are solutions to a system of non-linear equations were converted to digital
domain and processed in Matlab[MATe]to extract the performance parameters of the
array. The non-linear equations were comprised of all possible element-pair correlations
from which the relative phase difference between element paths as a result of mismatch,
process variations and supply gradients across the chip could be extracted[Gre17]. A brief
discussion of the encoding, decoding and equation-solving procedure used is discussed
next.
1.2.0.1 Signal encoding and decoding
An overview of CoMET-based injection and extraction is discussed in this section which
is taken from[Gre17]. The analysis although done for a receiver is equally applicable to a
transmitter. The output response of thent h element in Figure 1.7(a), that is phase shifted
byθ is given by,
En(t) = [GnAn]cos(ωt−θn−φn) (1.1)
Here,Gn is the gain of the element,Anis the amplitude of the phase shifted signal,θnis the
applied phase shift applied to thent helement andφn is the phase offset of each element.
Figure 1.7Block diagram of a CoMET-embedded four element phased array a) receiver and b) transmitter[Gre17]
characterization frequency. The response at the output of thent helement can be written
as the sum of an in-phase and a quadrature-phase signal as:
En(t) =Gn[In+Qn] (1.2)
In(t) =Ai,n(θn)cos(ωt−φn) (1.3)
Qn(t) =Aq,n(θn)sin(ωt−φn) (1.4)
Where,Ai nθn=Ancos(θn)andAq nθn=Ansin(θn).The I and Q signals are the encoded with
two different orthogonal Rademacher code sets, where details on Rademacher codes can
be found in[Edw75]. Multiplication of two such unique code sets form another unique
orthogonal code product (OCP). The response becomes,
En(t) =Gn[(ci,nAi,n)(θn)cos(ωt −φn) + (cq,nAq,n)(θn)sin(ωt−φn)] (1.5)
The sum of I and Q vectors at phase shifter output creates a resultant vector set at an angle
θ which is modulated across all the four quadrants by sign-inverting the signal by the codes
Figure 1.8An illustration of the modulated phase-shift response in the the time domain[Gre17]
denotes a phase inverted I and Q. The response from all the parallel receiver channels
are multiplexed together via an RF combiner to form an aggregate response,Et o t. The
aggregate response is then passed through a power detector which performs a square-law
operation, forming a resultant baseband,E2 t o t.
Et o t2 = [G12(A2i,1+A2q,1) +G12(A2i,1+A2q,1)]
+ci,1cq,1[2(G1Ai,1)(G2Aq,1)]cos(ωt −φi,1)sin(ωt−φq,1)
+ci,1ci,2[2(G1Ai,1)(G2Ai,2)]cos(ωt −φi,1)cos(ωt−φi,2)
+ci,1cq,2[2(G1Ai,1)(G2Aq,2)]cos(ωt −φi,1)sin(ωt−φq,2)
+cq,1ci,2[2(G1Aq,1)(G2Ai,2)]sin(ωt −φq,1)cos(ωt −φi,2)
+cq,1cq,2[2(G1Aq,1)(G2Aq,2)]sin(ωt−φq,1)sin(ωt −φq,2)
+ci,2cq,2[2(G1Ai,2)(G2Aq,2)]cos(ωt −φi,2)sin(ωt−φq,2)
(1.6)
The detected output is a code-modulated pattern of intermixed terms represented by
equa-tion 1.6 where each row is encoded by a unique code-product formed by the multiplicaequa-tion
of two codes.The first line in the equation represents the codes multiplied with themselves.
entire array. Correlations between a single element’s I and Q components should vanish due
to orthogonality of the quadrature components but quadrature accuracy is never a perfect
90 degrees. The finite value of these code-products measures the quadrature accuracy
within a single element (lines 2 and 7) . Correlations between two different element’s I and
Q components terms have finite values because phase delay through each element is not
equal. The finite value of these terms measures the phase-offset between the elements
(lines 4 and 5). Correlations between two I or two Q products gives the output power and
phase of each element using (lines 3 and 6).
To decode the modulated baseband signal, the OCPs are used to form pairwise elemental
correlations. The composite signal is multiplied by each OCP and then integrated over the
full code duration. This results in three categories of cross correlations: auto-correlations,
quadrature-phase correlations and in-phase correlations. The system of equations
gener-ated using these correlations are then solved in an iterative solver in Matlab. The average I
and Q vector magnitudes represented byGnAi,nandGnAq,nare extracted first. The in-phase
terms are assumed to have little or no phase error which simplifies the extraction process
incurring less than 3.5% error[Gre17]. The extracted amplitudes are then used to solve the
second category of equations with the quadrature correlations from which the quadrature
inaccuracies are derived. Equations containing the phase offset errors are solved to obtain
inter-elemental phase offsets of the array. Finally the code-offsets are solved by exploiting
the symmetry property of the OCPs. The output power,Po u t and phase of each element,θn
are estimated using the following equations, the derivation details are given in[Gre17]:
Po u t,n= q
(GnAi,n)2+ (GnAq,n)2 (1.7)
θn=arctan(GnAq,n)
(GnAi,n)
1.2.1
Experimental verification
In the test setup, a millimeter-wave signal generator injected a 60 GHz single-frequency
tone through the BIST path in a four-element receiver array with each element’s RF input left
un-terminated. Each element path was phase-modulated by writing phase settings through
an on-chip serial-programmable interface (SPI). The interference pattern obtained from the
combined response of each array element was coupled to an on-chip power detector which
performed the squaring function, down-converting the signal to baseband and filtering high
frequency component. The power detector output was amplified by an external op-amp and
captured using an oscilloscope that sampled the waveform. The modulated waveform at a
particular phase setting produced by the power detector and captured by the oscilloscope
is indicated in Figure 1.9a[Gre17]. Code pulses of 5 ms duration resulted in a modulated
waveform of duration 1.28s. The red lines in the figure indicate the begin and end time of
the phase modulation. From this collected data, the cross-correlations between I-Q, I-I and
Q-Q components of the elements could be extracted using the concept of OCPs discussed
previously. Shown in Figure 1.9b is an illustration of the correlation values obtained from the
collected baseband waveform corresponding to the phase setting. The system of non-linear
correlation equations generated in the behavioral model were used to extract amplitude
error, quadrature phase error, inter-elemental phase offsets, elemental output power and
elemental phase-shift.
The average gain and phase response extracted using COMET were compared to VNA
measured results for different phase settings. Using swept power responses the gain and
phase response of each element were compared as shown in Figure 1.10a and 1.10b
re-spectively. The extracted average gain response of each element was within 1 dB of the
measured VNA result of individual elements whereas average phase response was within
5◦. Quadrature error of individual elements and phase offsets between different elements
(a)Baseband waveform produced by the power detector captured by oscil-loscope in COMET test setup at a certain phase setting
(b)Correlations extracted using OCPs from the modulated
base-band waveform
(a)Gain response (b)Phase response
(c)Quadrature accuracy of all four elements (d)Phase offsets of elements 2,3,4 relative to the
phase of element 1
1.3
Objective
The work presented in this thesis attempts to explore how CoMET-based extraction can
be made more accurate than the prior art and used in a wider range of phased arrays.
This is accomplished by making the CoMET behavioral model more robust by combining
the attractive features of the prior approach and introducing them into a new type of
BIST architecture which will be called the "series-fed" BIST architecture in this report.
CoMET technique will be modified to analyse a behavioral model of the phased array
system in this new BIST architecture. A new measurement scheme is introduced which
increases the obtained non-linear cross-correlations to fourfold by simple manipulation of
the signal injection and extraction directions. Characteristic non-linearities are introduced
into the behavioral model and extracted using CoMET. The accuracy of CoMET -based
extraction of an element is compared to the individual response of an array element. The
cross-correlations that preserve performance parameters of the array have been used to
further evaluate the circuit non-idealities.
Chapter 2 presents the limitations of CoMET in the prior art and discusses the motivation
behind a new BIST architecture. Using the series-fed technique, CoMET is behaviorally
embedded into a two-element phased array system and implemented using Matlab. A
new measurement scheme is presented that quadruples the set of down-converted data.
Mathematical analysis of the approach is described including modifications in the encoding,
decoding and extraction technique.
Chapter 3 discusses the importance of phase shifter performance on the accuracy of
CoMET-based extraction. It analyses typical phase shifter non-idelaities that degrade the
performance of an array element and introduce amplitude and phase error inthe array
response. The impact of each type of non-ideality on the phase shifter output is discussed
and an error model of the phase shifter is thus constructed.
CoMET-embedded phased array system with the series-fed BIST architecture and performs
ex-traction using the measurement approach introduced in Chapter 2. Finally, the extracted
performance using COMET is compared versus the response of individual elements to
CHAPTER
2
SERIES-FED PHASED ARRAY
ARCHITECTURE
In Chapter 1, the CoMET technique was reviewed that uses a built-in distribution network
allowing injection and extraction of calibration signals. Code-modulation applied to the
elemental signals at the phase shifter uniquely encoded each array channel. The advantage
was that, the combined array response was down-converted and decoded in a single
mea-surement. The detected baseband signal was comprised of cross-correlations between all
elemental signals from which amplitude and phase response of the array were extracted.
However, a new methodical approach for evaluating the achievable extraction accuracy of
CoMET is necessary to enhance the accuracy of this testing method.
dis-cussed. This gives insight into the issues that need to be resolved to improve CoMET-based
testing accuracy. Second, a new type of ‘series-fed’ BIST architecture motivated from[Yeh18]
is behaviorally introduced into a two-element phased array system and CoMET-based
anal-ysis is performed. In the new architecture, modifications in CoMET-based measurement
scheme is introduced by the use of two input BIST ports and two output baseband ports.
This scheme allows routing the signal through four different BIST paths, resulting in four
sets of measurement data obtained from the same array. The system uses additional
CoMET-based circuitry such as pairs of RF combiner and square-law device for down-conversion
of the RF signal at the two baseband ports. Each measurement data-set is comprised of
cross-correlations between the I and Q components of the array element. With quadruple
measurement sets, the number of correlation values increase fourfold, where each
correla-tion equacorrela-tion defines an element’s performance parameters. In the extraccorrela-tion technique,
the benefit is that, each correlation term is decoded with the same-set of OCPs across all
the four measurement sets, avoiding the requirement of additional OCPs. However, this
comes at the expense of measurement time which is fourfold in comparison to the prior
art. Third, the series topology introduces path delays in between consecutive elements that
manifests as phase offsets. With four times the correlation equations, additional
perfor-mance parameters can be evaluated. The mathematical analysis of the encoding, decoding
and extraction procedure is discussed. CoMET-based extraction is used through a Matlab
[MATe]implementation to characterize the array.
2.1
Limitations of state-of-the-art CoMET
In the prior art, CoMET was validated by comparing extracted performance parameters to
VNA measurement results. While the gain of each element agreed with VNA measurements
within 1 dB error, the phase response agreement occurs within 5◦of error. These
phase error to characterize the array. The following section discusses the limitations of
CoMET and the implications of these limitations on the error-extraction capability using
this testing technique:
1. CoMET could not capture AM-PM distortions that is correlated between the elements.
The main reason for this error can be attributed to the gain dependent phase variation
of the Variable Gain Amplifiers (VGAs) in the phase shifter block of each array channel.
The phase of the VGAs varying as a function of its gain results in non-linear distortions
in both amplitude and phase. There will be more discussions about this in Chapter 3.
2. The quadrature-phase correlations, used to determine the quadrature accuracy of
individual elements and phase offsets between two different elements, were accurate
to within 2◦ and 3◦ respectively. The reason can be attributed to the fact that the
90◦coupler splitting the signal into inphase and quadrature-phase components can
itself have imperfections in both amplitude and phase. These imbalances needs to
be extracted to get an accurate estimation of the quadrature error.
3. At the phase shifter, the magnitude for the I and Q vectors are switched in sign to form
I,I andQ,Qvectors and thereby obtain phase shift in all four quadrants. Amplitude
offsets in I and Q signal vectors may cause defect in signal encoding manifesting as
code errors.
4. The power detector in CoMET was used for the simplicity of the detection step,
avoiding the need to provide coherent quadrature down-conversion mixers and
local-oscillator signals. The accuracy of CoMET is dependent upon the accuracy of its
detection technique that performs the squaring operation to generate the OCPs in
el-emental cross-correlation product terms. However, duration of CoMET measurement
and its accuracy may be limited by response time of the power detector. The speed
of detection has to be faster than the fastest code, otherwise the detection may be
5. The passive parallel distribution network occupies area on-chip. For larger arrays,
this can cause space constraint on-chip. Moreover, theλ/4 impedance matching
transformers are narrow-band. So, a broadband approach is more desirable.
6. The demonstration of CoMET has been performed on 4 and 8-element arrays[Gre18],
[Hon19]. The Hadamard-Walsh codes[Wal23]applied to the in-phase and
quadrature-phase components for each quadrature-phase-shifter result in long codes whose duration scales
by a factor of 22n, where ‘n’ is the number of elements in the array. Thus, the approach
is only limited to smaller arrays. As the arrays scale up with more number of elements,
longer codes are required, increasing encoding and decoding time. This limitation
may be overcome either by using faster on-chip code generators that reduce code
duration or by using other orthogonal codes that minimize the testing time relative
to the array size.
2.2
Motivation for a modified BIST architecture
To perform element-level as well as array-level self-test, a new type of built-in self test
(BIST) architecture was introduced by[Yeh18]and is shown in Figure 2.1. The series-fed
BIST network path highlighted in grey was implemented as a means to save significant area
on-chip when compared to its parallel network counter-part given in[Gre17]. Moreover,
adopting a series-fed network ensured a broadband matching alternative to the
narrow-band limitation of the parallel network design. In the following sections CoMET has been
behaviorally implemented into this series-fed BIST architecture. It will be observed that in
addition to the above mentioned advantages, this BIST architecture has the capability to
overcome some of the major limitations of CoMET described in Section 2.1.
The BIST architecture shown in Figure 2.1, employs an input series-feed path and an
output series-distributed network common to all the array elements. Shown at the ends of
Figure 2.1Block diagram of a four-element phased-array transceiver employing on-chip series-fed BIST network[Yeh18]
BIST port has the capability to be terminated by 50Ω. The 50Ωresistor termination is turned ON/OFF using a controlled switching operation. The advantage is that, when one
of the two BIST RF ports sends in an input calibration test signal for array characterization,
the other BIST RF port can be broadband terminated. This allows the input calibration
signal to be coupled to the front-end of each array element without suffering significant
reflections along the length of the built-in path. To implement CoMET in this architecture,
the calibration signal will be injected using the input series-fed network and extracted
from the output series-distributed network. This modified technique allows injection of
the test signal from either of the two BIST input ports via the built-in paths. Since the
two BIST input ports are located at the opposite ends of the embedded path, the injected
test signal directions are reversed. From a mathematical standpoint, we will observe that
the signal accrues modified phase information due to the reversal in test signal direction.
In the following section, this built-in architecture will be used to perform CoMET-based
measurement behaviorally on a series-fed phased array architecture. To avoid mathematical
However, this technique can be extended to larger array systems. As arrays are scaled up
in size, the built-in path design simply requires the series feeding transmission line to
be extended to the input signal-injection points of the array elements. We will find that
the architectural advantage of sending in the calibration signal in two reverse signal path
directions can be leveraged to obtain twice measured data-sets which is a benefit over the
state-of-the art technique. We will utilize this expanded data-sets to achieve better accuracy
in characterizing the array elements using CoMET.
2.3
CoMET embedded series-fed phased array architecture
This section discusses the behavioral implementation and analysis of CoMET-embedded
re-ceiver architecture for a multi-element series-fed phased array rere-ceiver. First, we introduce
the adaptations required in the COMET measurement technique for this type of
architec-ture. Then, a detailed mathematical analysis of this model is performed. The analysis is
completely a mathematical treatment of the system where the calibration test signals are
characteristically emulated using mathematical equations.
Shown in Figure 2.2 is a behavioral block diagram of an ‘n’ element receiver array.
The built-in path required to perform CoMET on this system is highlighted in green. The
architecture is similar to Figure 2.1, except, here the elements are placed adjacent to each
other and the input BIST path runs as one straight embedded path. First, a single-tone sine
wave is injected as a calibration signal into one of the two input BIST RF ports indicated as
BIST RFi n,1and BIST RFi n,2. When one BIST input port is ON, the other BIST input port is
considered terminated by a matching impedance. The RF input ports given by RFi n,1, RFi n,2
etc. are left open. The input calibration signal traverses through the lossy series path and is
capacitively coupled into the front-end of each array element. The series feed introduces
a path delay between two consecutive array elements and is denoted by a phase lag,ψ.
BIST RF
in,1 BIST RFin,2
∑ ∑
x2
x2
RFout,2BB out,2 RFout,1BB
out,1 90 0 0 0 90 0 0 0 90 0 0 0 I-VGA Q-VGA LNA ci,1 (t) cq,1 (t) RF
in,1 RFin,2 RFin,3
● ● ● ● ● ● ● ● ● Ψ Φ Φ Ψ
Figure 2.2Block diagram of a phased-array receiver in the series-feed series-combine BIST archi-tecture
blocks (LNA). The amplified signal passes through a passive 90◦coupler and branches out
into in-phase (I) and quadrature-phase (Q) components. Each I and Q component in the
array channel is then phase-shifted by a desired angle,θ. The phase shifter topology is a
phase-interpolation type. It consists of variable gain amplifiers (VGAs) in both the I and Q
paths. We term the two VGAs as I-VGA and Q-VGA respectively. The VGAs are used to weight
the I and Q signal vectors to achieve a desired phase shift per element. Once a desired phase
angle is set, the I-VGA and Q-VGA signal outputs are modulated by orthogonal codes. These
are unique Rademacher codes, (ci(t),cq(t)) that are applied to each I and Q path. The codes
modulate the amplitude of each I and Q path signals by a unique sequence of+1 and -1
across all gain settings of the I and Q-VGAs. The advantage of code-modulation is that each
I and Q paths can be sign inverted. Thus, a summation of the weighted I and Q vectors
can create phase settings across all the four Cartesian quadrants. The phase shifted signal
from all the channels are collected through a shared lossy series-distributed network. The
a square-law device. However, in this modified architecture, we introduce two different
output ports at a time to capture the baseband.
Along with the two RF output ports of the array, i.e. RFo u t,1and RFo u t,2, in this
measure-ment technique we behaviorally introduce two different baseband (BB) output ports for
the collection of the code-modulated baseband aggregate signal data, indicated as BBo u t,1
and BBo u t,2in Figure 2.2. As the baseband signal is collected out of one of the two BB ports,
the other BB port and all other RF output ports of the array are OFF or left terminated
by 50Ω. This is done to ensure that the collected code-modulated signal of the array can only be obtained at one of the two BB ports at a time. Since there are two input BIST RF
ports, by alternately turning ON each BIST input port, two sets of BB output data can be
obtained per signal-injection operation. A pictorial representation of the calibration signal
injection and extraction mechanism using the two BIST input and two BB output port
is indicated in Figure 2.2. Thus, this modified approach is able to create four sets of BB
measurement data. Table 2.1 indicates the port conditions for injection and extraction that
are used to obtained each set of measured data. We will call them measurement sets 1, 2,
3 and 4. Figures 2.2a, 2.2b, 2.2c and 2.2d illustrate the signal routing directions for each
measurement set respectively.
Table 2.1Port conditions for the four measurement sets
Meas. set Injection port Extraction port Terminated/OFF ports 1 BIST RFi n,1 BBo u t,1 BIST RFi n,2,RFo u t,1,RFo u t,2,BBo u t,2 2 BIST RFi n,1 BBo u t,2 BIST RFi n,2,RFo u t,1,RFo u t,2,BBo u t,1 3 BIST RFi n,2 BBo u t,1 BIST RFi n,1,RFo u t,1,RFo u t,2,BBo u t,2 4 BIST RFi n,2 BBo u t,2 BIST RFi n,1,RFo u t,1,RFo u t,2,BBo u t,1
In the discussion on prior art of CoMET, it was observed that the BB data captures the
BIST RFin,1 BIST RF in,2
∑ ∑
x2
x2
RFout,2BB out,2
90 0 0 0 90 0 0 0 90 0 0 0 I-VGA Q-VGA LNA ci,1 (t) cq,1 (t)
RFin,1 RFin,2 RFin,3
● ● ● ● ● ● ● ● ● Ψ Φ Φ Ψ RFout,1
BB out,1
(a)Measurement set 1
BIST RF
in,1 BIST RFin,2
∑ ∑
x2 x2
RFout,2BB out,2
90 0 0 0 90 0 0 0 90 0 0 0 I-VGA Q-VGA LNA ci,1 (t) cq,1 (t)
RFin,1 RFin,2 RFin,3
● ● ● ● ● ● ● ● ● Ψ Φ Φ Ψ RFout,1
BB out,1
BIST RFin,1 BIST RFin,2
∑ ∑
x2
x2
RFout,2BB out,2
90 0 0 0 90 0 0 0 90 0 0 0 I-VGA Q-VGA LNA ci,1 (t) cq,1 (t)
RFin,1 RFin,2 RFin,3
● ● ● ● ● ● ● ● ● Ψ Φ Φ Ψ RFout,1
BB out,1
(c)Measurement set 3
BIST RFin,1 BIST RFin,2
∑ ∑
x2
x2 RF
out,2BB out,2
90 0 0 0 90 0 0 0 90 0 0 0 I-VGA Q-VGA LNA ci,1 (t) cq,1 (t)
RFin,1 RFin,2 RFin,3
● ● ● ● ● ● ● ● ● Ψ Φ Φ Ψ RF out,1
BB out,1
(d)Measurement set 4
this modified approach perform similar operations except that by doubling the BB output
data-set, the number of cross-correlation pairs are also doubled in total. The extra BB data
set are additional sets of information and will be used to evaluate the series phase offsets
introduced by the BIST input feed network and output distribution network. The following
section is a mathematical analysis of the modified CoMET approach.
2.4
Mathematical analysis of the modified approach
In this mathematical analysis we will first show how the codes are applied via the RF phase
shifters to each array element, code-modulating the I and Q paths. The modulated response
is then combined and down-converted to form a cross-correlation-mixed baseband pattern
resulting from the squaring operation. Four sets of baseband waveform is obtained from
which array performance parameters are extracted. The following analysis is restricted to a
two-element phased array, although it can be extended to ‘n’ number of array elements.
2.4.1
Encoding mechanism
Consider a single-frequency tone, cos(ωt)at the desired characterization frequency
in-jected into the input port, BIST RFi n,1and distributed to the two-element array. At a desired
phase setting,θn, the I and Q components will be amplitude weighted by the I and Q-VGAs
and may be indicated byAi,n(θ)andAq,n(θ)respectively, where ‘n’ is the index number of
the array element. The lossy series feed path embedded in the phased array architecture
in-troduces a path delay between any two array elements, we denote it by an equivalent phase
lag,ψin the input distribution network. We consider that the input distribution signal
suffers a phase lag ofψi,nin the I-arm andψq,nin the Q-arm of each element. Likewise, as
the signal is collected from the output series distribution network, the signal accrues path
delays between the output signal of two different elements owing to the series topology
occurring in the signal before series-combining is considered included in the phasesψi,n
andψq,n. This assumption allows the use of a single output phase offset variable given by
φand avoids mathematical complexity.
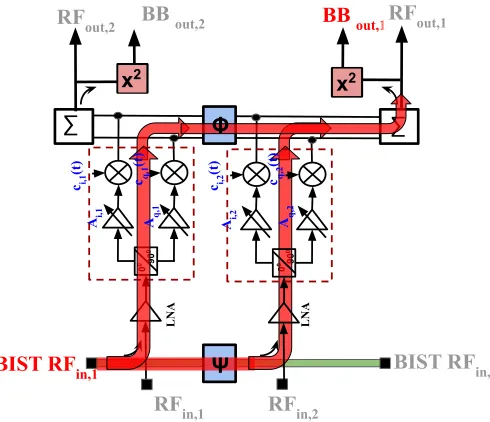
For the following analysis, we consider a two-element phased array system. Out of the
four measurement sets shown in Table 2.1, let us consider measurement set 1 where, the
port BBo u t,1is ON, all other output ports remaining OFF or terminated as shown in Figure
2.3. The active input port, BIST RFi n,1and BBo u t,1output port are indicated in red, all the
other ports are inactive and have been faded out in the illustration. Ports RFi n,1and RFi n,1
are left open, ports RFo u t,1and RFo u t,2are 50Ωterminated, port BBo u t,2is considered OFF. Considering two different orthogonal codes,ci,nandcq,napplied to the I and Q components
BIST RFin,1 BIST RFin,2
∑ ∑
RFout,2 BB out,2 BB out,1RFout,1
90 0 0 0 90 0 0 0 Ai,1 LNA ci,1 (t)
RFin,1 RFin,2
Ψ LNA cq,1 (t) ci,2 (t) cq,2 (t)
Aq,1 Ai,2 Aq,2
x2
Φ
x2
Figure 2.3Illustration of measurement set 1 in a two-element phased array. The active ports and path of calibration signal injection and extraction are indicated in red. The inactive ports are faded.
the elements 1 and 2 may be described by the following equations:
Ei,1(t) = (Ai,1ci,1)cos(ωt −φ) (2.1)
Eq,1(t) = (Aq,1cq,1)sin(ωt−φ) (2.2)
Ei,2(t) = (Ai,2ci,2)cos(ωt−ψi,2) (2.3)
Eq,2(t) = (Aq,2cq,2)sin(ωt−ψq,2) (2.4)
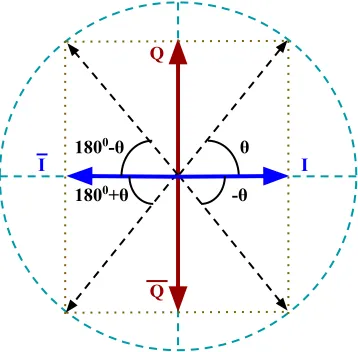
The above form of signal encoding corresponds to an initial phase setting,θn. Using
code-modulation, the phase setting is cycled through all four quadrants by sign invertingI and
Q components toI andQ depending on the sign of the code and the desired quadrant.
Figure 2.4 graphically portrays this. Next, consider measurement set 2 shown in Figure 2.2b
θ 1800-θ
1800+θ -θ
I I
Q
Q
Figure 2.4Polar diagram illustrating code-modulation of the in-phase and quadrature-phase components across the four Cartesian quadrants.
where, the output port BBo u t,2is ON, all other output ports remaining OFF or terminated,
the injection signal still coming in from port, BIST RFi n,1. This will result in similar form of
by the following equations:
Ei,1(t) = (Ai,1ci,1)cos(ωt) (2.5)
Eq,1(t) = (Aq,1cq,1)sin(ωt) (2.6)
Ei,2(t) = (Ai,2ci,2)cos(ωt −ψi,2−φ) (2.7)
Eq,2(t) = (Aq,2cq,2)sin(ωt−ψq,2−φ) (2.8)
Comparing equations 2.1-2.4 with equations 2.5-2.8, we find that the same array create
modified sets of equation with difference being in the performance parameters indicated
in sine and cosine arguments. This can be made useful to extract the series path delays.
Similar forms of equation can be obtained using measurement set 3 shown in Figure
2.2c, by injecting the test signal through the other input port, BIST RFi n,2and terminating
BIST RFi n,1. Considering the same initial phase setting,θn, and the output code-modulated
signal collected at BBo u t,1, the signal equations change to the following:
Ei,1(t) = (Ai,1ci,1)cos(ωt −ψi,1−φ) (2.9)
Eq,1(t) = (Aq,1cq,1)sin(ωt−ψq,1−φ) (2.10)
Ei,2(t) = (Ai,2ci,2)cos(ωt) (2.11)
Eq,2(t) = (Aq,2cq,2)sin(ωt) (2.12)
Next, turning ON port BBo u t,2keeping all other output ports OFF or terminated, the injection
signal still coming in from port, BIST RFi n,2results in measurement set 4 shown in Figure
2.2d. The above equations get modified as:
Ei,1(t) = (Ai,1ci,1)cos(ωt−ψi,1) (2.13)
Eq,1(t) = (Aq,1cq,1)sin(ωt−ψq,1) (2.14)
Ei,2(t) = (Ai,2ci,2)cos(ωt −φ) (2.15)
Eq,2(t) = (Aq,2cq,2)sin(ωt−φ) (2.16)
sets. It can be observed from the table that the encoding procedure in the two-element
array introduces 9 unknown parameters in both amplitude and phase terms. In the next
section a description of the detection scheme is given that allows demodulation of the
above derived equations to obtain valuable array metrics using CoMET.
Table 2.2Summary of phase arguments and the unknown array parameters obtained from the signal equations of the four different measurement sets for a two-element phased array
Meas. Set Element I/Q Path Phase argument Unknown parameters
First 1 I ωt-φ Ai,1,φ
Q ωt-φ Aq,1,φ
2 I ωt-ψi,2 Ai,2,ψi,2
Q ωt-ψq,2 Aq,2,ψq,2
Second 1 I ωt 0
Q ωt 0
2 I ωt-ψi,2-φ Ai,2,ψi,2,φ Q ωt-ψq,2-φ Aq,2,ψq,2,φ
Third 1 I ωt-ψi,1-φ Ai,1,ψi,1,φ
Q ωt-ψq,1-φ Aq,1,ψq,1,φ
2 I ωt 0
Q ωt 0
Fourth 1 I ωt-ψi,1 Ai,1,ψi,1
Q ωt-ψq,1 Aq,1,ψq,1
2 I ωt-φ Ai,2,φ
Q ωt-φ Aq,2,φ
2.4.2
Decoding mechanism
Each of the above set of code-modulated signals are RF combined and squared by a
square-law device. Thus in this mathematical model,thePI andPQ signals are added from
each element and squared. From the theory of CoMET we learnt that performing squaring
operation on the code-modulated array response creates inter-elemental cross
squaring operation on the output signal,Et o t(t)for measurement set 1 may be described
by the following equations:
Et o t2 (t) = [A2i,1+Aq2,1+A2i,2+A2q,2]
+2(Ai,1Aq,1)(ci,1cq,1)cos(ωt−φ)sin(ωt−φ)
+2(Ai,2Aq,2)(ci,2cq,2)cos(ωt−ψi,2)sin(ωt −ψq,2)
+2(Ai,1Ai,2)(ci,1ci,2)cos(ωt−φ)cos(ωt−ψi,2)
+2(Aq,1Aq,2)(cq,1cq,2)sin(ωt−φ)sin(ωt−ψq,2)
+2(Ai,1Aq,2)(ci,1cq,2)cos(ωt−φ)sin(ωt−ψq,2)
+2(Aq,1Ai,2)(cq,1ci,2)sin(ωt −φ)cos(ωt−ψi,2)
(2.17)
Equation 2.17 shows different terms with cross-product combinations of the I and Q
com-ponents of the array elements. Each term consists of an OCP as a result of the product of
two codes. Each of these terms can be individually multiplied by the corresponding OCP
so that the desired term is demultiplexed whereas all other terms average out to zero due
to the use of orthogonal code products. Thus, the cross-correlations can be divided into
three categories of correlations: a) The auto-correlations which are the result of mixing
a modulated signal with itself. The auto-correlations are represented by the first line in
Equation 2.17 and is proportional to the total power in the down-converted response. b) The
phase correlations formed by the cross-products of two signals in
quadrature-phase to one another. These correlations are formed by the cross-product of the I and Q
components of a single element or between two different elements and is represented
by the second,third, sixth and seventh line in Equation 2.17. c) The in-phase correlations
formed by the cross-products of two signals which are in-phase with one another. These
products can take the form of two I components or two Q components shown in line four
Using Matlab, the baseband composite signal is filtered, synchronously decoded by
multiplying each correlation term with its corresponding OCP and integrated over a full
code duration to form elemental correlations. The integration and parameter-extraction
method follows the same technique as CoMET technique discussed in Chapter 1. The
auto-correlation term is proportional to the total power in the baseband response, the
quadrature-phase correlations capture quadrature error within the same element or phase
offsets within two different elements. The in-phase correlations quantify the output power
and phase of each element. The correlations that are solutions to a system of non-linear
equations are processed in Matlab[MATe]to evaluate the performance metrics of the array.
The following is a representation of the set of cross-correlation equations obtained from
Measurement set 1:
Ri i,12= (0.5)(Ai,1Ai,2)cos(ψi,2−φ) (2.18)
Rq q,12= (0.5)(Aq,1Aq,2)cos(ψq,2−φ) (2.19)
Ri q,11= (0.5)(Ai,1Aq,1)sin(φ11) (2.20)
Ri q,22= (0.5)(Ai,2Aq,2)sin(φ22) (2.21)
Ri q,12=−(0.5)(Ai,1Aq,2)sin(ψq,2−φ) (2.22)
Ri q,21= (0.5)(Ai,2Aq,1)sin(ψi,2−φ) (2.23)
In the above equations,Ri i,12andRq q,12represent the in-phase correlation values whereas,
the remaining four correlations are the quadrature-phase correlations between same
ele-ment (Ri q,11,Ri q,22) and two different elements (Ri q,12,Ri q,21). We thus have all the possible
correlation equations needed to characterize the array. The correlation equations from the
four different measurement scenarios modify the phase argument and are summarized in
Table 2.3. Each measurement set results in six correlation equations A-F. The sign inversion
in the phase arguments in sets 1,2 and 3,4 occur due to change in the signal injection
direction. This property will be exploited to solve the correlation equations to obtain the
Table 2.3Summary of phase arguments obtained from correlation equations corresponding to the four baseband data-sets
Meas. Set Eqn. Correlation type Correlation value Phase arguments
First 1A In-phase Ri i,12 ψi,2-φ
1B In-phase Rq q,12 ψq,2-φ
1C Quadrature-phase Ri q,11 φ11
1D Quadrature-phase Ri q,22 φ22
1E Quadrature-phase Ri q,12 ψq,2-φ
1F Quadrature-phase Ri q,21 ψi,2-φ
Second 2A In-phase Ri i,12 ψi,2+φ
2B In-phase Rq q,12 ψq,2+φ
2C Quadrature-phase Ri q,11 φ11
2D Quadrature-phase Ri q,22 φ22
2E Quadrature-phase Ri q,12 ψq,2+φ
2F Quadrature-phase Ri q,21 ψi,2+φ
Third 3A In-phase Ri i,12 ψi,1+φ
3B In-phase Rq q,12 ψq,1+φ
3C Quadrature-phase Ri q,11 φ11
3D Quadrature-phase Ri q,22 φ22
3E Quadrature-phase Ri q,12 ψi,1+φ
3F Quadrature-phase Ri q,21 ψq,1+φ
Fourth 4A In-phase Ri i,12 ψi,1-φ
4B In-phase Rq q,12 ψq,1-φ
4C Quadrature-phase Ri q,11 φ11
4D Quadrature-phase Ri q,22 φ22
4E Quadrature-phase Ri q,12 ψi,1-φ
![Figure 1.3 Phased-array receiver with chip-level BIST system [Kim12]](https://thumb-us.123doks.com/thumbv2/123dok_us/1243983.1157034/18.612.157.474.73.324/figure-phased-array-receiver-chip-level-bist-kim.webp)
![Figure 1.4 Phased-array far-field characterization using orthogonal coding technique [Lie10]](https://thumb-us.123doks.com/thumbv2/123dok_us/1243983.1157034/19.612.118.517.368.686/figure-phased-array-eld-characterization-orthogonal-coding-technique.webp)
![Figure 1.6 Characterization of 8-element TX array using over-the-air CoMET [Hon19]](https://thumb-us.123doks.com/thumbv2/123dok_us/1243983.1157034/20.612.93.536.479.624/figure-characterization-element-tx-array-using-comet-hon.webp)
![Figure 1.7 Block diagram of a CoMET-embedded four element phased array a) receiver and b)transmitter [Gre17]](https://thumb-us.123doks.com/thumbv2/123dok_us/1243983.1157034/23.612.96.539.79.304/figure-block-diagram-comet-embedded-element-receiver-transmitter.webp)
![Figure 1.10 Performance parameters extracted in a swept power response using CoMET com-pared to the measured response of individual elements using a VNA [Gre17]](https://thumb-us.123doks.com/thumbv2/123dok_us/1243983.1157034/28.612.94.533.229.513/performance-parameters-extracted-response-measured-response-individual-elements.webp)
![Figure 2.1 Block diagram of a four-element phased-array transceiver employing on-chip series-fed BIST network [Yeh18]](https://thumb-us.123doks.com/thumbv2/123dok_us/1243983.1157034/35.612.157.472.75.292/figure-block-diagram-element-phased-transceiver-employing-network.webp)