RESTORATION OF DIGITAL IMAGE AFFECTED BY
SALT AND PEPPER NOISE
Amudha.J
1, Sudhakar.R
21
Assistant Professor, Dr. Mahalingam College of Engineering and Technology, Pollachi, India
2
Professor & Head/ ECE Dept, Dr. Mahalingam College of Engineering & Technology, Pollachi, India
ABSTRACT
This paper presents an efficient approach for restoring image affected by salt and pepper noise detection and removal. Initially, the detection stage will utilize the histogram of the corrupted image to identify noise pixels. These detected “noise pixels” will then be subjected to the second stage of the filtering action, while “noise-free pixels”
are retained and left unprocessed.The proposed algorithm replaces thenoisy pixel by trimmed median value when
other pixel values, 0’sand 255’s are present in the selected window and when all the pixel values are 0’s and 255’s then the noise pixel is replaced by mean value of all the elements present in the selected window except the processing pixel. This proposed algorithm shows better results than the Standard Median Filter (MF), Decision Based Algorithm (DBA), Modified Decision Based Algorithm (MDBA), and Progressive Switched Median Filter (PSMF). The proposed algorithm is tested against different grayscale and color images and it gives better Peak
Signal-to-Noise Ratio (PSNR)
Keywords: Restoration, Salt and Pepper Noise, Switching Median Filter, Denoising
I INTRODUCTION
The occurrence of salt-and-pepper noise can severely damage the information or data embedded in the original
image during image acquisition and transmission. Attenuation of noise and preservation of details are usually two
contradictory aspects of image processing. Nevertheless, both of them are important to subsequent processing stages
like edge detection or segmentation. One of the simplest ways to remove salt-and-pepper noise is by windowing the
noisy image with a median filter The median filter, as well as its modifications and generalizations [2],[3] has been
demonstrated to offer good performance in the removal of impulse noise. However, because these approaches are
typically implemented invariantly across an image, they also tend to alter noise free pixels moreover they are prone
to edge jitter in cases where the noise ratio is high [4].As a result, the effectiveness in noise suppression is often at
the expense of blurred and distorted image features. Many existing methods use noise detection stage to determine
whether a pixel is noisy or not. Then, the filtering process is applied only to the identified noisy pixels. The
corrupted pixels are replaced by median value. This switching strategy, has been shown to be simple and yet more
effective than median filter [5] [6]. These methods will not consider the local features as a result of which details
Algorithm (DBA) [7], was proposed by Jay raj to remove high density impulse noise. At higher noise densities the
median may also be a noisy pixel and it is replaced by the immediate neighborhood pixel. This produces streaking
effect.
II PROPOSED METHOD
The noise considered in this paper is salt and pepper noise. This method first detects the noise .If the standard
deviation is greater than T, multi level median filtering is performed. Next, minimum array was found from three
different arrays like red, green, blue and checked whether its elements consists of all „0‟‟s ,255‟s or both. If any of
these are present the pixels in the minimum array means the processing pixel are replaced by its mean value except
the current pixel, else they are replaced by its median value except the processing pixel to obtain the restored image
.If the standard deviation is less than or equal to T then, one neighbor array of the processing pixel is considered and
checked whether its elements consists of 0‟s, 255‟s or both. If any of these are present in the pixels, replace the
pixels by the mean value except the processing pixel, else they are replaced by its median value to obtain the
restored image.
Fig: 1.1 Flow Chart Restoring Image affected by Salt and Pepper Noise
NOYES Read the Noisy Image
Global variance >
T
Process 1
Process 2 Noise Detection
Multi Level Median Filter
Itt < N
Noise Free Image
Noise Free Image YES
YES
Fig: 1.2 Flow chart for Process 1 Fig: 1.3 Flow chart for Process 2
2.1 ALGORITHM
Step 1: Read the noisy image
Step 2: Perform the Noise Detection process for the Noisy Image
Step 3: If the Standard deviation of the image is greater than T means perform the Multi Level Median filtering. Step 4: Separate the three components (red, green, blue) from the image
Step 5: Create the mask of size (3,3) to the image. The range will be different for the three images for red(i-1,i,i+1), green(i-2,i,i+2), blue(i-3,i,i+3).
Step 6: Check whether the selected window contain all 0‟s, 255 are both
Replace the pixels with mean filter except the processing pixel. Otherwise
Replace the pixels with median filter except the processing pixel.
This process will be continued up to N times and displays the RGB Image Step 7: If the Standard deviation of the image is less than T means
Step 8: Create the mask of size (3, 3) to the image. The range will be different for the three images for red (i-1, i, i+1).
Step 9: Check whether the selected window contain all 0‟s, 255 are both
Replace the pixels with mean filter except the processing pixel. Otherwise Noisy Image NArray (i -1,i,i+1) Replacing Pixel with median filter except processing pixel Replacing Pixel with mean filter except processing pixel Noise Free Image Selected Array Contain all 0’s or 255 or
both
YES No
Noisy Image
N Array (i-1, i, i+1) L Array (i-2, i, i+2) M Array (i-3, i, i+3)
Minimum Array
Replacing Pixel with median filterexcept processing pixel
Replacing Pixel with mean filter except processing pixel
Noise FreeImage Selected Array Contain all 0’s or
Replace the pixels with median filter except the processing pixel. Step 10: Finally display the RGB image.
III EXPERIMENTAL RESULTS
In this section, the proposed method is evaluated and compared with many other existing methods. Experiments are
conducted on a variety of standard gray-scale and color test images with distinctly different features and different
sizes. Peak Signal-to-Noise Ratio (PSNR) and Mean Square Error (MSE) are used to represent the quantitative
performance measures. The test images used for comparison are camera man image of size 512 X 512, Lena color
image and Peppers color imageof size 256 X 256, which is corrupted by various noise density levels. Table I and
Fig.1 shows the comparison of the restoration results of different methods at different noise densities for Lena color
image. Table II and Fig.2 shows the comparison of the restoration results of different methods at different noise
densities for Peppers color image.
Table I
Comparison of Restoration Results in PSNR (dB) of different methods for
Lena Color Image of size 256 X 256
% NOISE DENSITY
PSNR in dB
Mean Method
Median Method
NAFSM Method
MUBUTMF Method
Proposed Method
10 30.7 31.5 28.2 32.4 35.6
20 25.3 28.9 25.6 30.0 32.3
30 22.2 25.2 24.3 26.7 30.1
40 20.0 21.6 23.0 24.4 28.1
50 18.2 18.5 21.6 22.4 26.3
60 17.0 16.4 18.3 19.3 24.5
70 15.7 14.8 14.4 16.4 22.5
80 14.9 13.1 10.5 13.4 18.1
90 14.2 12.1 7.5 10.0 16.0
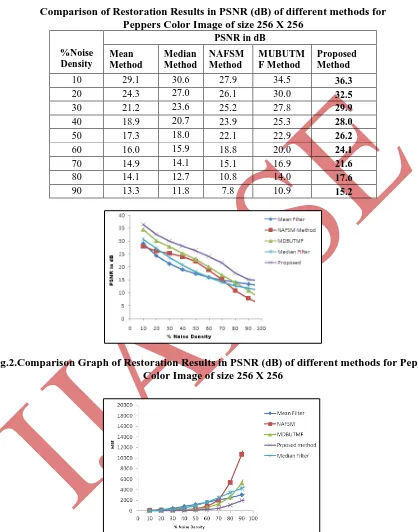
Table II
Comparison of Restoration Results in PSNR (dB) of different methods for
Peppers Color Image of size 256 X 256
%Noise
Density
PSNR in dB
Mean Method
Median Method
NAFSM Method
MUBUTM F Method
Proposed Method
10 29.1 30.6 27.9 34.5 36.3
20 24.3 27.0 26.1 30.0 32.5
30 21.2 23.6 25.2 27.8 29.9
40 18.9 20.7 23.9 25.3 28.0
50 17.3 18.0 22.1 22.9 26.2
60 16.0 15.9 18.8 20.0 24.1
70 14.9 14.1 15.1 16.9 21.6
80 14.1 12.7 10.8 14.0 17.6
90 13.3 11.8 7.8 10.9 15.2
Fig.2.Comparison Graph of Restoration Results in PSNR (dB) of different methods for Peppers
Color Image of size 256 X 256
Fig.4. Restoration Results of Cameraman gray Image of size 512 X 512.
(a) Original Cameraman gray Image contaminated by 80% Noise Density (b) Output by Mean
Filter (c) Output by Median Filter (d) Output by NAFSM Method (e) Output by MDBUTMF
Method (f) Output by Proposed Method
Fig.5 shows the restored results of Lena Color image which shows that the proposed method yields superior subjective quality with respect to salt and pepper noise suppression and image detail preservation.
Fig.5. Restoration Results of Lena Color Image of size 256 X 256.
(a) Lena Color Image contaminated by 50% Noise Density (b) Output by Mean Filter (c) Output
by Median Filter (d) Output by NAFSM Method (e) Output by MDBUTMF Method (f) Output by
Proposed Method
IV CONCLUSION
A new hybrid method is proposed for the removal of salt-and-pepper noise in this work. It can detect the impulse
noise efficiently while preserving the details. The simulation results demonstrate that our approach outperforms than
other existing techniques in terms of both quantitative evaluation and visual quality. Particularly, it removes the
REFERENCES
[1] K.K.V.Toh, H. Ibrahim, and M. N. Mahyuddin,”Salt-and-pepper noise detection and reduction using fuzzy switching median filter,”IEEE Trans. Consumer Electron., vol. 54, no. 4, pp. 1956–1961, Nov. 2008.
[2] S.-J. Ko and Y.-H. Lee, “Center weighted median filters and their applications to image enhancement,”
IEEE Trans. Circuits Syst., vol. 38, pp.984–993, Sept. 1991.
[3] H. Hwang and R. Haddad, “Adaptive median filters: New algorithms and results,”IEEE Trans. Image
Process., vol. 4, no. 4, pp. 499–502, Apr. 1995.
[4] T. A. Nodes and N. C. Gallagher, Jr., “The output distribution of median type filters,” IEEE Trans
Communication., vol. COM-32, pp. 532–541, May 1984.
[5] T. Chen and H. R. Wu, “Adaptive impulse detection using center-weighted median filters,” IEEE Signal Process. Letters, vol. 8, no. 1, pp. 1–3, Jan. 2001.
[6] P. Y. Chen and C. Y. Lien, “An efficient edge-preserving algorithm for removal of salt-and-pepper noise,”
IEEE Signal Process. Letters, vol. 15, pp. 833–836, 2008.