KINETICS AND MECHANISM OF OXIDATION OF
MIXTURE OF DL-MALIC ACID AND L (+)
TARTARIC ACID BY CHROMIC ACID IN PRESENCE
OF HYDROCHLORIC ACID AND SODIUM
CHLORIDE
Rupali Verma
1, Shaikh Ishrat Bano Ibrahim
2, Smita Shukla
3, B.K.Mishra
41
Department of Chemistry, Bansal Institute of Science & Technology, Bhopal (India)
2
Department of Chemistry, S.V.S’s Arts & Science College, Dondaicha, Duhule (India)
3
Department of Chemistry, R. K. D. F. Institute of Science & Technology, Bhopal (India)
4
Department of Chemistry, Laxmipati Institute of Science & Technology, Bhopal (India)
ABSTRACT
Kinetics and mechanism of oxidation of DL-Malic Acid and L(+)Tartaric Acid by Chromic Acid in presence of
Hydrochloric Acid and Sodium Chloride have been studied with a view to elucidate the mechanism of the
reaction in aqueous medium, isolate and identify the products and produce a reaction mechanism. Effect of
Hydrochloric Acid and Sodium Chloride onthe oxidation of mixture of DL-Malic Acid and L (+) Tartaric Acid
by Chromic Acid has been studied at three different temperatures. The rate of the oxidation increases with the
increase in the concentration of Hydrochloric Acid, while the reaction rate is decreases with the increase in the
concentration of Sodium Chloride. The order of reaction is one with respect to Chromic Acid and also one with
respect to mixture of DL-Malic Acid and L (+) Tartaric Acid .The kinetic parameters such as rate constant,
temperature coefficient and catalytic constant are determined.
I. INTRODUCTION
Chromium occurs in the environment mainly in the elemental state Cr0 or in compounds of Cr (III), the trivalent
species or hexavalent Cr (VI)10 .In soils and sediments, Chromium may be present in one of the two
thermodynamically stable oxidation states, Cr (III) or Cr (VI)9.Cr (VI) constitutes a significant health hazard and
the World Health Organization (WHO) has, therefore, established a limit of 0.05 mg/lit for Cr (VI) in drinking
water6. Compounds of Cr (VI) are generally more soluble in water than are those of Cr (III).Chromium (III)
presents only a low health risk. Chromium (III) as a metal ion has a tendency to be absorbed specifically on clay
and oxide surfaces and hydrolyze within the ordinary environmental pH range (pH=3-9). Kinetics and
mechanistic studies of Chromic Acid oxidation of α hydroxyl acid abound in the literature. The reaction follows
either two electrons or three electrons one step oxidation of substrates by Chromic Acid. Organic substrates
generally undergo at most a two electrons oxidation in a single step. One step three electron reduction of an
oxidant involves more than one molecule of an organic substrate in the activated complex Rocek et al5, have
is an organic acid carrying a second functional group and second substrate molecule is either identified with the
first or it may be a compound with a single functional group such as an alcohol.
The latter case represents a co oxidation in which two different substrates are oxidized simultaneously. Z.
Khan12, Mishra13 and his associates also reported three equivalent step of the oxidation of Malonic Acid by
Chromic Acid. According to Bronsted theory of an acid and base catalysis11, un dissociated molecule catalyze
the reaction rate. Acetic Acid13 can also catalyze the reaction rate at low concentration.
Experimental: All the chemicals were of AR grade, DL - Malic Acid (BDH), L (+) Tartaric Acid (BDH), Sodium Chloride (BDH), Chromium trioxide (Qualigens), Hydrochloric Acid (B.D.H.) and all other chemicals
were used of highest purity available as commercially. Standard solution of known DL-Malic Acid- (+) Tartaric
Acid was prepared by accurate weighing of the amount required and dissolving it quickly in double distilled
water. Stock solution of Chromium (VI) was prepared by dissolving of Chromium trioxide in double distilled
water and was standardized iodometrically. The reacting solutions were kept in a thermostat for about half an
hour. The temperature regulation was within 250C (0.1oC). After the solution had attended the experimental
temperature of the thermostat, then 20 ml of each reactant was pipette out and immediately transferred into the
flask. An aliquot of 5ml of the reaction mixture was then immediately withdrawn and its optical density (O.D.)
measured at once. Progress of the reaction was measured by using spectrophotometer. Data so obtained at 25oC
on various reaction mixtures containing different concentration of Hydrochloric Acid and Sodium Chloride,
while the concentration of DL-Malic Acid, L (+) Tartaric Acid and Chromic Acid were kept constant at 1.25 x
10-1 M,1.25 x 10-1 M and 4.80 x 10⁻³M respectively. Concentration of Hydrochloric Acid and Sodium Chloride
was varied from 1.00 x 10⁻² M to 8.00 x 10⁻² M respectively. Kinetic data are recorded in table No. 1, 2, 3 & 4.
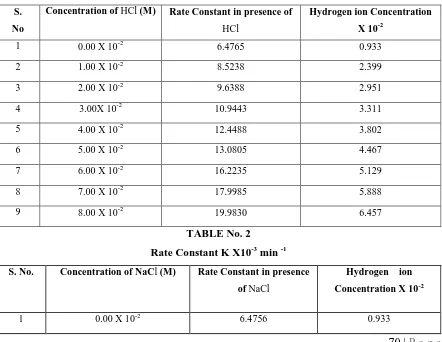
TABLE No. 1
Rate Constant K X10
-3min
-1S. No
Concentration of HCl (M) Rate Constant in presence of
HCl
Hydrogen ion Concentration X 10-2
1 0.00 X 10⁻² 6.4765 0.933
2 1.00 X 10⁻² 8.5238 2.399
3 2.00 X 10⁻² 9.6388 2.951
4 3.00X 10⁻² 10.9443 3.311
5 4.00 X 10⁻² 12.4488 3.802
6 5.00 X 10⁻² 13.0805 4.467
7 6.00 X 10⁻² 16.2235 5.129
8 7.00 X 10⁻² 17.9985 5.888
9 8.00 X 10⁻² 19.9830 6.457
TABLE No. 2
Rate Constant K X10
-3min
-1S. No. Concentration of NaCl (M) Rate Constant in presence
of NaCl
Hydrogen ion
Concentration X 10-2
2 1.00 X 10⁻² 5.2952 1.118
3 2.00 X 10⁻² 4.6775 1.660
4 3.00X 10⁻² 4.1150 2.138
5 4.00 X 10⁻² 3.7520 2.455
6 5.00 X 10⁻² 3.1164 2.951
7 6.00 X 10⁻² 2.7745 3.226
8 7.00 X 10⁻² 2.4565 3.467
9 8.00 X 10⁻² 2.1886 3.631
Average Value = 3.7107 x 10⁻¹ 1.660
TABLE No. 3
CATALYTIC CONSTANT AND DIELECTRIC CONSTANT S.
No
Concentration of HCl (M) Catalytic Constant KH+
x 10-1
Dielectric Constant
1 0.00 X 10⁻² - 1.898*
2 1.00 X 10⁻² 0.8534 1.844
3 2.00 X 10⁻² 1.0716 1.839
4 3.00X 10⁻² 1.3494 1.833
5 4.00 X 10⁻² 1.5708 1.830
6 5.00 X 10⁻² 1.6799 1.826
7 6.00 X 10⁻² 1.7054 1.823
8 7.00 X 10⁻² 1.9569 1.820
9 8.00 X 10⁻² 2.0917 1.818
Average Value =1.5349 x 10⁻¹ 1.829
*Not included in the average
TABLE No. 4
Catalytic Constant and Dielectric Constant
S. No. Concentration of NaCl (M) Catalytic Constant KH
+
x 10-1
Dielectric Constant
1 0.00 X 10⁻² - 1.898*
2 1.00 X 10⁻² -1.0571 1.878
3 2.00 X 10⁻² -1.0842 1.873
4 3.00X 10⁻² -1.1045 1.864
6 5.00 X 10⁻² -1.1386 1.853
7 6.00 X 10⁻² -1.1476 1.849
8 7.00 X 10⁻² -1.1595 1.844
9 8.00 X 10⁻² -1.1809 1.841
Average Value =-1.1229 x 10⁻¹ 1.857
*Not included in the average
Fig. No-01Variation Of Rate Constant With The Concentration Of Hydrochloric Acid Cf Table -01
Fig. No.-02 Variation Of Rate Constant With The Hydrogen Ion Concentration Cf Table -01
Fig. No.-03 Variation of Rate Constant With The Sodium Chloride Concentration cf Table -04
II. RESULTS AND DISCUSSION
The rate of the reaction is affected by the Hydrochloric Acid concentration, the extent of which depends on the
following two factors;
(1) The concentration of added Hydrochloric Acid in the reaction mixture
(2) The nature of the added Hydrochloric Acid.
As the rate of the reaction is altered in presence of Hydrochloric Acid, hence the reaction is catalyzed. The order
of the reaction with respect to Chromic Acid and Hydrogen ion (Fig.No.02) remains unaltered i.e., one in the
presence of Hydrochloric Acid in the system. A graph obtained between the rates constant and added
concentration of Hydrochloric Acid (Fig No. 01) suggests that the rate is linear function of the concentration of
Hydrochloric Acid. The increase in the rate of reaction in presence of Hydrochloric Acid is due to positive
catalysis which has been explained in several ways, the most important of these appears to be;
(a) Fast formation of the activated complex or to less stability of an intermediate catalyst compound
(b) Intermediate compound regenerates both the positive catalyst and the reactant
(c) Catalytic side reaction or decomposition
(d) Breaking of chain reaction
The rate however does not depend on the concentration of Hydrogen ion only. Thus the acid effect is not due to
specific acid catalysis. It seems to be due to general acid catalysis. It will be worthwhile to state that the values
of temperature coefficient of reaction depend upon the reaction themselves. It is observed from the table No-04
and 05 that temperature coefficient is fairly constant. The values of temperature coefficient are approximately
equal to two. The energy of activation is acquired by collision only. The temperature effect is thus purely
thermal. It seems that the source of acquiring energy of activation is practically the same at all temperatures.
obtained at250C will suffice, for it will hold, good the data observed at other temperature also, the difference
being in the values of the rate constants only.
Table No. 5 Temperature Coefficient
S. No. Concentration of Hydrochloric
Acid(M)
Temperature Coefficient
K36 / K 25 K45 / K 36
1 0.00 X 10⁻² 1.98 1.96
2 1.00 X 10⁻² 1.97 1.92
3 2.00 X 10⁻² 1.96 1.97
4 3.00X 10⁻² 1.95 1.97
5 4.00 X 10⁻² 1.97 1.99
6 5.00 X 10⁻² 1.95 1.96
7 6.00 X 10⁻² 1.98 1.92
8 7.00 X 10⁻² 1.95 1.96
9 8.00 X 10⁻² 1.97 1.95
Table No. 6 Temperature Coefficient
S. No. Concentration of Sodium Chloride
(M)
Temperature Coefficient
K35 / K 25 K45 / K 35
1 0.00 X 10⁻² 1.98 1.96
2 1.00 X 10⁻² 1.95 1.97
3 2.00 X 10⁻² 1.98 1.96
4 3.00X 10⁻² 1.95 1.96
5 4.00 X 10⁻² 1.98 1.97
6 5.00 X 10⁻² 1.95 1.93
7 6.00 X 10⁻² 1.98 1.97
8 7.00 X 10⁻² 1.97 1.97
9 8.00 X 10⁻² 1.97 1.95
It appears from the values of temperature coefficient(Table No.05 and 06) of the reaction in the presence of
Sodium Chloride that this salt produced mostly primary salt effect which is attributed to the dependence of
activity coefficient of ions and hence the activities of the reactants on the ionic strength of the system. The
activity coefficient of ions always decreases by the addition of small quantity of salt. All reactions involving the
ions should be expected to show a negative salt effect. The negative salt effect (Fig.No.03) is due to negative
catalysis which has been explained in several ways, the most of these appears to be; (a) slow formation of the
activated complex and more stability of an intermediate catalyze compound (b) regeneracy of both the negative
catalyst and the reactant from the intermediate compound (c) breaking of chain reaction (d) catalytic side
reaction or decomposition. No significant change in the average values of dielectric constant and average values
of catalytic constant of the system is observed by the concentration of the added Hydrochloric Acid.
In order to study the overall oxidation products of mixture of Oxalic Acid +DL-Malic Acid by Chromic Acid
Acid and Chromic Acid was kept at room temperature for a long time. After mixing the reactants, it was
observed that initial light yellow colour changed to light blue in the course of the reaction. This clearly indicates
that the oxidation of the reactants proceeds through different stages and the reduction of Cr (VI) to Cr (III) in the
oxidation of mixture of DL-Malic Acid, L (+) Tartaric Acid by Chromic Acid. Products were extracted with
ether by solvent extraction method and identified as Malonic Acid (DL-Malic Acid), Glyoxalic Acid [L (+)
Tartaric Acid] and Carbon dioxide. Liberation of Carbon dioxide shows that Chromic Acid is attacking of the –
COOH group of DL-Malic Acid, L (+) Tartaric Acid. Malonic Acid and Glyoxalic Acid was identified by its
melting point and spot tests8. Carbon dioxide was identified qualitatively by Ba(OH)212 and also confirmed by
passing the gas in lime water, which turned milky
III. MECHANISM OF REACTION
REFERENCES
[1]. A.V.Mahajai & Ansari A.H., J.Sci.Res.1,1-4(1978)
[2]. Srinivasan K.G & Rocek J., J. Am. Chem. Soc. 100, 2789.(1978)
[3]. Ip.D., & Rocek J., J.Org.Chem.44.312 (1979)
[4]. Mitewa M., & Bontches. Co-ord.Chem. Rev. 61. 241 (1985)
[5]. Rocek & Hassan.J.Am.Chem.Soc.94.9073 (1972)
[6]. Sheehan, P.J., Meyer, D.M., Sauer, M.M., Pausten bach, D.J.J. ToxicolEnviron. Health, 32,
16,161-201(1991)
[7]. Kabir-ud-Din, Khaled Hartani & Zaheer Khan. Ind. J. Chem. Vol 41B. 2614-2624 (2002)
[9]. James,B.R.,Baarlett,R.J. J.Envirom. Qual., 12,173-176 (1983)
[10]. Sigel,H.&Sigel,A.Metal ions in Biological Systems, Marcel Dekker,Inc., New York NY,pp.186-187
(1995)
[11]. Bronsted &Guginheim. J. Am. Chem. Soc., 49, 2554 (1927)
[12]. Z.Khan, D. Gupta & A.A. Khan, Int. J. Chem. Kinet. 24,481 (1992)