Available Online at www.ijcsmc.com
International Journal of Computer Science and Mobile Computing
A Monthly Journal of Computer Science and Information Technology
ISSN 2320–088X
IMPACT FACTOR: 6.017
IJCSMC, Vol. 7, Issue. 6, June 2018, pg.197 – 209
ANALYSIS AND DESIGN OF KOREA
MERCHANDISE SALES SYSTEM
(CASE STUDY IN SUEWEETIESID)
1
Eka Putri Apriliani,
2Indra Ranggadara
1,2
Faculty of Computer Science, Mercu Buana University, Indonesia
1
[email protected]; 2 [email protected]
Abstract—The design of the sales system in Sueweetiesid is based on the fan club of Korean artist Bae Suzy who wants Korean merchandise, started using social media to promote and offer it to various consumers, consumers who want to buy goods sometimes have to wait long because the admin must input order data one by one especially when booking very high, this is certainly very ineffective, in the design of this application using UML as a method used and needed analysis to see the tendency that occurs through SWOT analysis method, and the results obtained this design into a proposal for application development and analysis results obtained relationship by OW, WT, TS, and OS.
Keywords— SueweetiesID, Merchandise, Analytical Hierarchy Process, SWOT.
I. INTRODUCTION
goods sometimes have to wait long because the admin must input data orders one by one especially if the order is very high, this is certainly not effective. From these problems, it is necessary to design a system that can facilitate the consumer to perform these transactions in order to help facilitate in inputting data orders and data items available, can improve the efficiency of time so that consumers can order goods in want easily without waiting long.
A. Research Problems
Based on the background described above, then the outline of the problem is: 1) How to design Korean Merchandise Sales application in SueweetiesID?
2) How are the weaknesses, strengths, opportunities, and threats in designing the Korean Merchandise Sales system in SueweetiesID?
B. Limitation of Research
In order for the research to be conducted is not too widespread, there are limits to this research: 1) System Provides Information on merchants and products offered.
2) System Provides Information on price and availability of goods sold. 3) Booking done if it has become a member
4) Payment method using Bank Transfer only 5) The analysis in this study using SWOT Method
6) Assumption criteria used in Algorithm AHP only Excellence, Very Good, and Good as a requirement for the product favourite
7) The assumption on sub criteria using 5 products on the bracelet category
8) The assumption to calculate the favourite product is to use 100 people who have given ratings on the bracelet category
C. Purpose and Objectives
In this research is to know how to design Korean Merchandise Sales application in SueweetiesID, and to know the strengths, weaknesses, opportunities, and threats in the design of Korean Merchandise Sales system at SueweetiesID.
II. THEORYFUNDAMENTAL A. Previous Research
As an effort made to this research, to identify the methods that have been done. In order to know the application of methods created by others approaching this research. So here are some studies that are close to the research that will be discussed. The results of M. A. Sudarsono and Krisnawati showed that to design and build Android Based Applications required some software and hardware, starting from system analysis to design the process of this application [5]. Research A. Putranto explained based on the SWOT matrix, Regina Pacis High School Bogor can use the strengths to obtain opportunities. The way that can be done by SMU Regina Pacis Bogor, among others: make improving the competence of students and teachers by using existing facilities and technology; developing innovative learning methods by utilizing existing information technology channels (e-learning) and improving the quality of learning for students and teachers obtained from the technology channel [6]. Other research Y. Astuti and D. I. Fahmasari Pinter Java website provides feature article posting for member Pinter Java website that can be used to exchange information about Java Culture, and So people who will learn Javanese culture do not need to come directly to the island of Java [7]. From the previous research that has been described then it is necessary to develop to design sales applications in the analysis with SWOT, that is by adding feature product ranking into application design.
B. System Definition
The system is a network of interconnected procedures, gathered together to perform an activity or to complete a particular goal [8]. The system can also be defined as a set or set of organized elements, components, or variables, interdependent with each other, and integrated a system consisting of parts or components integrated for one purpose [9]. Meanwhile, according to Sutarman System is a collection of elements that are interconnected and interact in one unity to run a process of achieving a major goal [10].
C. Characteristic System
Here are the characteristics:
1) System Components
A system consists of a number of interacting components, which means working together to form a unity. System components or system elements can be either a subsystem or parts of the system. Each subsystem has the characteristics of a system that performs a particular function and affects the overall system process.
2) System Restrictions
Limit system is the area that limits between a system with other systems or with the environment outside. This system boundary allows a system to be viewed as a whole and shows the scope of the system.
3) External Environment System
The external environment of a system is beyond the limits of the system that affect the operation of the system. The external environment of this system can be both beneficial and detrimental. The favourable external environment is the energy of the system and thus must be maintained and maintained. While the adverse external environment must be retained and controlled, otherwise it will interfere with the viability of the system.
4) System Liaison
Liaison is a medium that connects between one subsystem with other subsystems. Through this link allows resources to flow from one subsystem to another. The output from one subsystem will be input to other subsystems through the link. With connecting one subsystem can integrate with other subsystem form one unity.
5) System Input
System input is the energy that is put into the system. Inputs can be maintenance input and signal input. Maintenance input is the energy entered so that the system can run. Input signal is the energy that is processed to get the output from the system.
6) System Output
System output is energy that is processed and classified into useful output. Output can be input to other subsystems.
7) Processing System
A system can have a processing section or system itself as a processor. The processor will convert the input into output.
8) Target System
A system must have a purpose or a target, if the system does not have a target then the system will not exist. A system is successful if reach it target or their purpose. Goals are very influential on the input and output generated.
D. Definition of Sales
Sales is an activity aimed at finding buyers, influencing, and providing guidance so that purchases can match their needs with the offered production and enter into agreements on prices that benefit both parties. The point is this understanding of sales is a favourable agreement between the buyer and the seller [12].
E. Decision Support System
The Decision Support System (DSS) is an interactive computer-based system that helps decision makers to use data and models to solve unstructured problems [13].
F. UML
UML (Unified Modelling Language) is one of the most widely used language standards in the industry to define needs, create analysis & design, as well as describe the architecture in object-oriented programming [14]. Other definition Use Case Diagram is a UML (Unified Modelling Language) diagram model used to describe the expected functional agreement of a system. Use Case is always made first, but another sequence of diagrams is created depending on the project and personal preferences of analyst [15].
G. Analytical Hierarchy Process Algorithm
Analytical Hierarchy Process (AHP) [16] was developed by Prof. Thomas Lorie Saaty (1998) from Wharston Business school to seek ranking or priority order of various alternatives in solving a problem. In everyday life, one is always faced with the choice of alternatives. Priority determination and consistency test are required on the options that have been made. In complex situations, decision-making is not influenced by just one factor but multi-factor and encompasses both levels and interests [17]. Basically, AHP is a general theory of measurement used to find the scale of ratio of both discrete and continuous pairwise comparisons. These comparisons can be drawn from the actual size or base scale reflecting the strength of feelings and relative preferences. Some principles in solving problems with Analytical Hierarchy Process (AHP) [18]:
1) Determining the hierarchy
4) Measuring consistency Λmaks.... [16]
5) Calculate index consistency CI = (Λmaks - n) / (n - 1)... [16] 6) Calculate the index ratios CR = CI / IR... [16]
H. SWOT Analysis
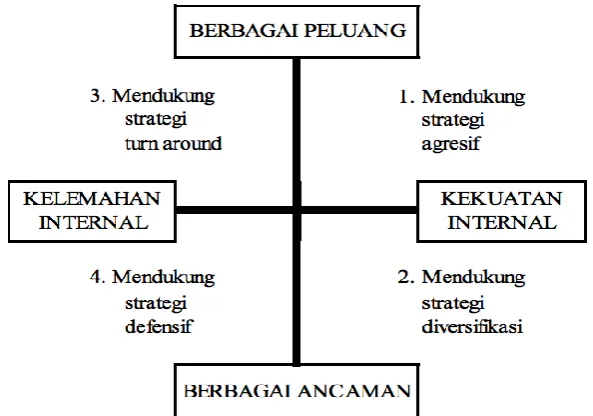
Business can be identified by using analysis to identify strengths, weekness, opportunities, and threats that can be identified by SWOT analysis. SWOT analysis compares between external Opportunities and Threats factors with internal Strength and Weakness factors [19].
Figure 1 SWOT Analysis Quadrant
III.METHOD
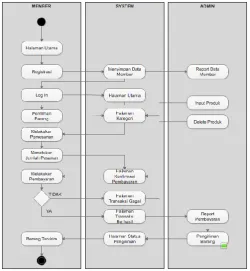
A. Business Process Current System
Here is the current business process in Sueweetiesid that can be described in figure 1.
Figure 2 Business Process Current System
B. Use Case Diagram
Figure 3 Use Case Diagram
Figure 3 describes in use case there are 2 actors namely member and admin, interaction in the system described member and actor can perform certain activities in ordering and updating goods sold by admin.
C. Activity Diagram
Figure 4 Explaining the activity flow of the three actors for the design of this application, referring to the process flow of figure 2, the activities performed will be the reference for creating the application.
D. Sequence Diagram
Figure 5 Sequence Diagram
Figure 5 explains the sequence flow in the purchase process of this application, by explaining the interaction with the administrator member of the application, by displaying on every page of each activity.
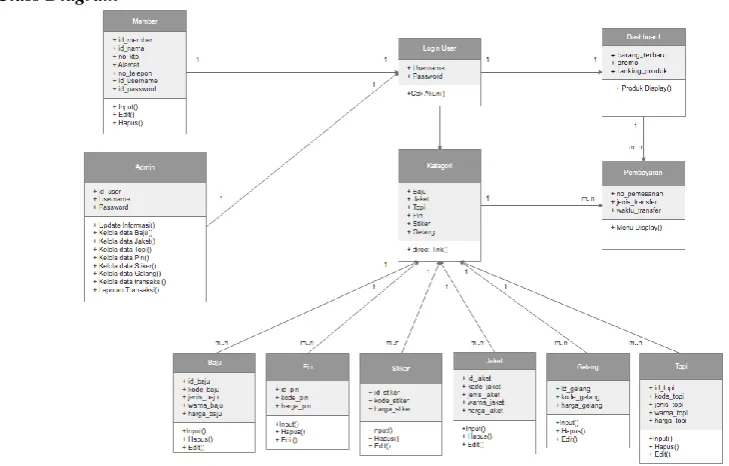
E. Class Diagram
Figure 6 Class Diagram
IV.RESULT AND CALCULATION
A. Collecting Data Method
The collecting data used in this research are [21]:
1) Interview
a. Drafting of interview materials, studying cases to be asked (resource persons to organization conditions). b. Conducting interviews with treasurers from several organizations.
2) Observation
3) Study Literature
Search the material to obtain information that is supportive for the design by reading and summarizing from the relevant material or source of reading.
4) Internet Reference
Surfing, looking for additional information both articles, journals, until the latest technological developments that can be used as a reference in the writing and system design.
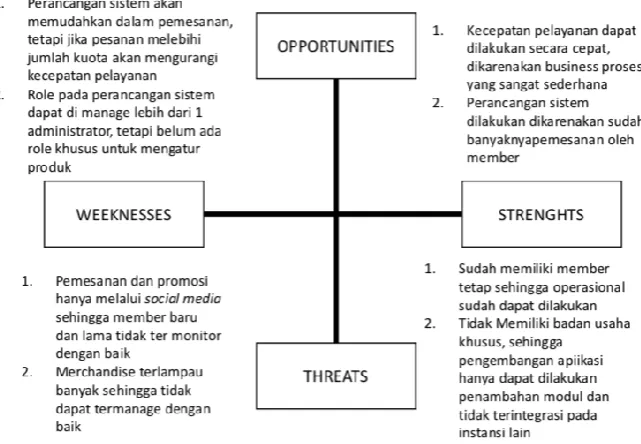
B. SWOT Analysis Result
Here is the result of the analysis for designing SueweetiesID application using SWOT method:
Figure 7 SWOT Analysis Result
Figure 7 describes strength, weakness, opportunity, and threats in formulating SueweetiesID application design, in which there are explanations of O-W, W-T, T-S, and O-S relationships described in Quadrant SWOT.
B. Login Page
B. Dashboard
Figure 9 Dashboard
C. Product Information Detail
D. Analytical Hierarchy Process for Rating Product
To use the AHP algorithm, we have to unravel its hierarchy, shown in Figure 11:
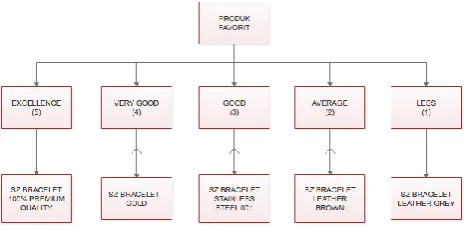
Figure 11 AHP Product Rating Hierarchy
Figure 11 explains the main purpose in this algorithm is to determine the favorite product, with 5 criteria rating ie; excellence (5 Stars), Very Good (4 Stars), Good (3 Stars), Average (2 Stars), and Less (1 Star). Of the 5 criteria, will be selected, for example to determine the favorite product of the bracelet category of 5 goods. As explained in the limitation of the problem for the criteria is only taken the highest 3 of excellence, very good, and good. Under these Criteria are not the criteria of favorite products such as Average and Less, and assuming 100-member rating.
1) Calculating Wire Pair Comparison Criteria Area
Table 1 Pair Comparison Criteria
Excellence Very Good Good
Excellence 1,000 24,000 20,000
Very Good 19,000 1,000 10,000
Good 15,000 9,000 1,000
TOTAL 35,000 34,000 33,000
2) Calculating Wire Pair Comparison Excellence Area
Table 2 Matrix Pair Comparison Excellence Area
SZ Bracelet 100% Premium Quality
SZ Bracelet-Gold
SZ Bracelet Stainless Steel 001
SZ Bracelet Leather Brown
SZ Bracelet
Leather Grey Priority Vector SZ Bracelet 100%
Premium Quality 1,000 5,000 4,000 4,000 5,000 42%
SZ Bracelet-Gold 0,000 1,000 2,000 2,000 3,000 18%
SZ Bracelet
Stainless Steel 001 2,000 1,000 1,000 1,000 2,000 16%
SZ Bracelet
Leather Brown 1,000 1,000 1,000 1,000 1,000 11%
SZ Bracelet
Leather Grey 2,000 1,000 1,000 1,000 1,000 13%
TOTAL 6,000 9,000 9,000 9,000 12,000 100%
3) Calculating Wire Pair Comparison Very Good Area
Table 3 Matrix Pair Comparison Very Good Area
SZ Bracelet 100% Premium Quality
SZ Bracelet-Gold
SZ Bracelet Stainless Steel 001
SZ Bracelet Leather Brown
SZ Bracelet
Leather Grey Priority Vector SZ Bracelet 100%
Premium Quality 1,000 3,000 3,000 3,000 2,000 40%
SZ Bracelet-Gold 1,000 1,000 1,000 1,000 1,000 17%
SZ Bracelet
Stainless Steel 001 1,000 1,000 1,000 1,000 1,000 17%
SZ Bracelet
Leather Brown 0,000 1,000 0,000 1,000 1,000 10%
SZ Bracelet
Leather Grey 1,000 1,000 1,000 1,000 1,000 17%
4) Calculating Wire Pair Comparison Good Area
Table 4 Matrix Pair Comparison Good Area
SZ Bracelet 100% Premium Quality
SZ Bracelet-Gold
SZ Bracelet Stainless Steel 001
SZ Bracelet Leather Brown
SZ Bracelet
Leather Grey Priority Vector SZ Bracelet 100%
Premium Quality 1,000 2,000 2,000 2,000 3,000 40%
SZ Bracelet-Gold 1,000 1,000 1,000 1,000 1,000 20%
SZ Bracelet
Stainless Steel 001 0,000 1,000 1,000 1,000 0,000 12%
SZ Bracelet
Leather Brown 0,000 0,000 0,000 1,000 1,000 8%
SZ Bracelet
Leather Grey 1,000 1,000 1,000 1,000 1,000 20%
TOTAL 3,000 5,000 5,000 6,000 6,000 100%
5) Calculating index consistency (Criteria)
Table 5 Matrix Normalization Criteria
Excellence Very Good Good Eigen Vector
Normalization
Excellence 0,029 0,706 0,606 1,341
Very Good 0,543 0,029 0,303 0,875
Good 0,429 0,265 0,030 0,724
6) Calculate index consistency (Excellence)
Table 6 Matrix Normalization Excellence
SZ Bracelet 100% Premium Quality
SZ Bracelet-Gold
SZ Bracelet Stainless Steel 001 SZ Bracelet Leather Brown SZ Bracelet Leather Grey Eigen Vector Normalization SZ Bracelet 100%
Premium Quality 0,167 0,556 0,444 0,444 0,417 0,406
SZ Bracelet-Gold 0,000 0,111 0,222 0,222 0,250 0,161
SZ Bracelet
Stainless Steel 001 0,333 0,111 0,111 0,111 0,167 0,167
SZ Bracelet
Leather Brown 0,167 0,111 0,111 0,111 0,083 0,117
SZ Bracelet
Leather Grey 0,333 0,111 0,111 0,111 0,083 0,150
7) Calculate index consistency (Very Good)
Table 7 Matrix Normalization Very Good
SZ Bracelet 100% Premium Quality
SZ Bracelet-Gold
SZ Bracelet Stainless Steel 001 SZ Bracelet Leather Brown SZ Bracelet Leather Grey Eigen Vector Normalization SZ Bracelet 100%
Premium Quality 0,250 0,429 0,500 0,429 0,333 0,388
SZ Bracelet-Gold 0,250 0,143 0,143 0,143 0,167 0,169
SZ Bracelet
Stainless Steel 001 0,250 0,143 0,143 0,143 0,167 0,169
SZ Bracelet
Leather Brown 0,000 0,143 0,143 0,143 0,167 0,119
SZ Bracelet
Leather Grey 0,250 0,143 0,143 0,143 0,167 0,169
8) Calculate index consistency (Good)
Table 8 Matrix Normalization Good
SZ Bracelet 100% Premium Quality
SZ Bracelet-Gold
SZ Bracelet Stainless Steel 001 SZ Bracelet Leather Brown SZ Bracelet Leather Grey Eigen Vector Normalization SZ Bracelet 100%
Premium Quality 0,333 0,400 0,400 0,333 0,500 0,393
SZ Bracelet-Gold 0,333 0,200 0,167 0,167 0,167 0,207
SZ Bracelet
Stainless Steel 001 0,000 0,200 0,167 0,167 0,000 0,107
SZ Bracelet
Leather Brown 0,000 0,000 0,167 0,167 0,167 0,100
SZ Bracelet
9) Calculating Maximum Eigen Vector (Criteria)
Λmaks = (35,000 x 1,341)+(34,000 x 0,875)+(33,000 x 0,724) = 100,556328
10) Calculating Maximum Eigen Vector (Excellence)
Λmaks =(6,000 x 0,406)+(9,000 x 0,161)+(9,000 x 0,167)+(9,000 x 0,117)+(12,000 x 0150) = 8,233
11) Calculating Maximum Eigen Vector (Very Good)
Λmaks =(4,000 x 0,388)+(7,000 x 0,169 )+(6,000 x 0,169)+(7,000 x 0,119)+(6,000 x 0,169) = 5,598
12) Calculating Maximum Eigen Vector (Good)
Λmaks =(3,000 x 0,393 )+(5,000 x 0,207 )+(5,000 x 0,107)+(6,000 x 0,100)+(6,000 x 0,207) =4,587
13) Calculate Index Consistency (Criteria)
CI = (100,556328-3) / (3-1) = 48,77816399
14) Calculate Index Consistency (Excellence)
CI = (8,233-5) / (5-1) = 0,80825
15) Calculate Index Consistency (Very Good)
CI = (5,598-5) / (5-1) = 0,1495
16) Calculate Index Consistency (Good)
CI = (4,587-5) / (5-1) = -0,10325
17) Calculate index ratio (Criteria)
CR = 48,77816399 / 0,58 = 84,10028275
18) Calculate index ratio (Excellence)
CR = 0,80825 / 0,58 = 1,393534483
19) Calculate index ratio (Very Good)
CR = 0,1495 / 0,58 = 0,257758621
20) Calculate index ratio (Good)
CR = -0,10325 / 0,58 = -0,178017241
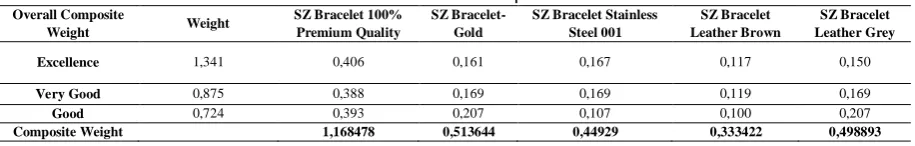
21) Calculating Overall Composite
Table 9 Overall Composite
Overall Composite
Weight Weight
SZ Bracelet 100% Premium Quality
SZ Bracelet-Gold
SZ Bracelet Stainless Steel 001
SZ Bracelet Leather Brown
SZ Bracelet Leather Grey
Excellence 1,341 0,406 0,161 0,167 0,117 0,150
Very Good 0,875 0,388 0,169 0,169 0,119 0,169
Good 0,724 0,393 0,207 0,107 0,100 0,207
Table 9 show composite weight obtained from the column weight multiplied by the employee on each criterion. So the result of the overall composite shows SZ Bracelet 100% Premium Quality with a value of 1.168478, showing the calculation results of the algorithm using AHP for the favorite product ranking, by taking the example for the Bracelet product category.
V. CONCLUSION
From the results of this research conclusions that can be taken are as follows:
1) SueweetiesID application design is done by defining the existing business process first, and then made UML Diagram like; Use case diagrams, Activity Diagrams, Sequence Diagrams, and Class Diagrams and then mock up the design of the application for the proposal in the development of the system
2) The results of analysis obtained from SWOT analysis get the relationship in O-W, W-T, T-S, and O-S. SWOT analysis results illustrate:
a) Opportunity - Weakness: The design of the system will facilitate the ordering, but if the order exceeds the quota amount will reduce the service speed and Role on the system design can be managed more than 1 administrator, but there is no specific role to set the product.
b) Weakness - Threat: Ordering and promotion only through social media so that new and old members are not well monitored and Merchandise is too much so it cannot manageable
c) Threat - Strength: Already have a fixed member so that operations can be done and Do not Have a special business entity, so the application development can only be done module addition and not integrated in other institutions
d) Opportunity Strength: Speed of service can be done quickly, due to business process is very simple and system design is done due to the number of reservations by members.
REFERENCES
[1] Lasminiasih, S. P, A. Akbar, M. Andriansyah and R. B. Utomo, “PERANCANGAN SISTEM INFORMASI KREDIT MIKRO MAHASISWA BERBASIS WEB,” Jurnal Sistem Informasi (JSI), vol. 8, no. 1, pp. 883-893, April 2016.
[2] I. Ranggadara, “ZACHMAN FRAMEWORK APPROACH FOR DESIGN SELLING BATIK APPLICATION BASED ON CLOUD,” International Research Journal of Computer Science (IRJCS), vol. 12, no. 4, pp. 15-20, December 2017.
[3] L. Christian, “MODEL APPLICATION OF ACCOUNTING INFORMATION SYSTEMS OF SPARE PARTS SALES AND PURCHASE ON CAR SERVICE COMPANY,” ComTech, vol. 6, no. 3, pp. 371-380, September 2015.
[4] S. Suhalim, “APLIKASI METODE ANALISIS SWOT UNTUK MERUMUSKAN STRATEGI BERSAING PADA PT BERKAT KARYA LESTARI,” AGORA, vol. 3, no. 2, pp. 392-399, 2015.
[5] M. A. Sudarsono and Krisnawati, “ANALISIS DAN PERANCANGAN APLIKASI “FUN 2D SHAPES LEARNING” BERBASIS MOBILE ANDROID,” Jurnal Ilmiah DASI, vol. 15, no. 02, pp. 35-40, Juni 2014.
[6] A. Putranto, “PERANCANGAN SISTEM E-LEARNING BERBASIS WEB DENGAN ANALISIS SWOT PADA SEKOLAH MENENGAH UMUM,” ComTech, vol. 2, no. 2, pp. 646-661, December 2011. [7] Y. Astuti and D. I. Fahmasari, “ANALISIS SWOT PADA WEBSITE PINTER JAWA UNTUK
MENENTUKAN PELUANG BELAJAR BUDAYA JAWA,” Jurnal Teknologi Informasi, vol. 12, no. 34, pp. 36-45, March 2017.
[8] F. Andalia and E. B. Setiawan, “PENGEMBANGAN SISTEM INFORMASI PENGOLAHAN DATAPENCARI KERJA PADA DINAS SOSIAL DAN TENAGA KERJA KOTAPADANG,” Jurnal Ilmiah Komputer dan Informatika (KOMPUTA), vol. 4, no. 2, pp. 93-98, October 2015.
[9] R. Saputra, “Desain Sistem Informasi Order Photo Pada Creative Studio Photo Dengan Menggunakan Bahasa Pemrograman Visual Basec.net 2010,” Jurnal Momentum, vol. 17, no. 2, pp. 86-93, August 2015. [10] Sutaman, Pengantar Teknologi Informasi, Jakarta: Bumi Aksara, 2012.
[11] A.-B. B. Ladjamudin, Analisis dan Desain Sistem Informasi, Yogyakarta: Graha Ilmu, 2013. [12] T. Abdullah and F. Tantri, Manajemen Pemasaran, Depok: PT Raja Grafindo Persada, 2016.
[14] R. A. Sukamto, Rekayasa Perangkat Lunak Terstruktur dan Berorientasi Objek, Bandung: Informatika, 2013.
[15] A. Dennis, B. H. Wixom and R. M. R. Dennis, Systems Analysis and Design, vol. 5, United States: Don Fowley.
[16] I. Ranggadara and R. Sahara, “Analytical Hierarchy Process Algorithm Approach for Determining Best Employee (Case Study IT Company in Jakarta),” International Journal of Computer Science and Mobile Computing, vol. 6, no. 12, pp. 59-64, December 2017.
[17] Saefudin and S. Wahyuningsih, “Sistem Pendukung Keputusan untuk Penilaian Kinerja Pegawai Menggunakan Metode Analytical Hierarchy Pprocess (AHP) pada RSUD Serang,” Jurnal Sistem Informasi, vol. 1, no. 1, pp. 33-37, 2014.
[18] M. Sulistiyono, “SISTEM PENUNJANG KEPUTUSAN UNTUK SELEKSI CALON GURU MENGGUNAKAN ANALYTICAL HIERARCHY PROCESS (AHP),” Jurnal Ilmiah DASI, vol. 17, no. 2, pp. 62-66, Juni 2016.
[19] F. Rangkuti, Analisis Swot Teknik Membedah Kasus Bisnis, Jakarta: PT Gramedia Pustaka Utama, 2009. [20] R. Sahara, H. Prastiawan and D. Rizal, “Rancang Bangun Sistem Informasi Mylibrary Telkomsel Berbasis
Website (Studi Kasus: PT. Telekomunikasi Selular),” Jurnal Format, vol. 6, no. 1, pp. 106-118, 2017. [21] R. Sahara and I. Ranggadara, “Design and Implementation of Treasury Application Based on Mobile in