International Journal of Advance Research In Science And Engineering http://www.ijarse.com
IJARSE, Vol. No.4, Issue No.01, January 2015 ISSN-2319-8354(E)
283 |
P a g e
SYSTEMATIC DESIGN, FABRICATION AND
EXPERIMENTAL STUDIES ON SOLAR THERMAL
WATER PUMP
Rohini kumar Bandaru
1, C. Muraleedharan
21
Assistant Professor, Department of Mechanical Engineering
2
Professor, Department of Mechanical Engineering
National Institute of Technology Calicut, NIT Campus P.O., Calicut - 673601, Kerala, (India)
ABSTRACT
The solar thermal pump is a good option where electrical power is not available and solar energy is in plenty. The
design of the solar pump which entailed detailed calculations to obtain the optimal volumes of vessels and
experimentation on the fabricated set up are presented in this paper. The pump employs ethyl ether as the working
substance which is an organic fluid with a low boiling point. The flat plate solar collector of area 1 m2 generates
vapour and its pressure is adequate to pump water from a well. The inclusion of storage tank for vapour and a
separate condenser facilitates greater freedom in the pump’s operation and thereby improved performance. The
performance of solar water pumphas been analyzed for three different discharge heads 3, 4 and 5 m with a
maximum efficiency of 0.14 x10⁻².
Key Words
:
Solar Thermal Pump, Optimal Design, Performance Analysis
I INTRODUCTION
International Journal of Advance Research In Science And Engineering http://www.ijarse.com
IJARSE, Vol. No.4, Issue No.01, January 2015 ISSN-2319-8354(E)
284 |
P a g e
A number of attempts have been made in different countries, to use solar energy for pumping water. These attempts have used different principles and have been successful to varying degrees. A perusal of the literature, on the subject of solar water pumps, reveals that a pump can be operated mainly on any of the fallowing three principles: (1) Pump driven by turbine operating with steam or any organic vapour generated using solar flat-plate collectors or concentrators; (2) Pump driven by electricity obtained from solar cells; (3) An unconventional pump in which the vapour of a low boiling point liquid is generated through flat plate collectors provides the motive power for lifting the water, while condensation of the vapour and the subsequent decrease in pressure provides for suction. In the first method, not only the capital cost of the system is high, but also the operation and maintenance problems are many because of the number of stages involved in conversion of solar energy to hydraulic work. In the second method, the present cost of solar cells makes the system uneconomical. The third method appears to be an attractive proposition and this paper presents the basic design, fabrication and experimentation on such a pump.Sumathy et al. [1] designed experimental set up with cooling coil in tank for condensing the working fluid and conducted experimental studies [2, 3] on solar thermal water pump with both ethyl ether and pentane as working fluids with separate storage tank for a delivery of 15 litres/cycle at 6 m, 8 m and 10 m delivery heads. Maximum efficiencies of 0.36% [9] and 0.42% [3] were reported with pentane and ethyl ether as working fluids, respectively at the delivery head of 6 m. Sumathy et al. [4] discussed the importance of effective condensation and design of the condensation coil. Effect of the condensation time and heating time on the performance of solar thermal water pump and change in condensation time as well as cycle time with inclusion of separate condenser at different delivery heads were reported by Wong and Sumathy [5].
The present work focuses attention on an unconventional pump with ethyl ether as working fluid. The inclusion of separate condenser for condensing the vapour facilitates greater freedom in the pump’s operation and thereby improves the performance. In this paper the system is designed for a maximum discharge head of 10 m and for a collector having an area of 1 m2. The optimized volumes of tanks have been obtained from the detailed consideration of the processes that occur in each of the tanks. The performance of the pump is evaluated experimentally at three different discharge heads 3, 4 and 5 m.
II
SYSTEM DESCRIPTION
The pump operates on the following principle: evaporation of a liquid of low boiling point, energized by flat plate solar collector, provides the motive force to lift water, while condensation of the vapour and the subsequent decrease in pressure provides the suction. The schematic diagram and photograph of solar thermal water pump are shown in Figs. 1 and 2, respectively. The system consists of the following main components:
(1) Flat-plate solar collector coupled to an insulated tank S both containing liquid ethyl ether (2) Insulated vapour storage tank N which stores ethyl ether vapour
(3) Insulated vessel A, completely filled with brine solution initially
International Journal of Advance Research In Science And Engineering http://www.ijarse.com
IJARSE, Vol. No.4, Issue No.01, January 2015 ISSN-2319-8354(E)
285 |
P a g e
(5) Vessel C immersed in the well water and provided with a one way valve(6) Overhead tank D and (7) Condenser
The choice of the working substance, to a large extent, depends on the boiling point and its miscibility with water. The normal boiling point of ethyl ether is 35 oC and it is only slightly miscible with water and is found to be immiscible with brine solution. When the pump is initially put into operation, tank N is in communication with tank S. Liquid ethyl ether, set in motion by thermo syphon action is heated in the flat-plate collector. As a consequence of heating, the temperature and the pressure increase. The saturated vapour separated in tank S is stored in the vapour storage tank N. When the pressure in tank N reaches a pre-determined value, it is isolated from tank S by closing valve 1. Then valve 2 is opened so that vapor from N flows quickly to vessel A. As a consequence, brine solution in tank A is displaced into tank B, which initially contains air at atmospheric conditions. The rising column of brine solution in B compresses the air in it and the compressed air in turn pushes the water in vessel C to the overhead tank D and this constitutes the pumping operation. At the end of pumping, valve 2 is closed and valve 1 is opened so that tank N is replenished with ethyl ether vapor for the next cycle. Concurrently, valve 3 is opened to discharge the expanded vapor to condenser and by opening the valve 4 the water from the overhead tank D is allowed to flow through the cooling coil in the condenser (before the water goes for end use) to condense the vapour in it. The flow rate of cooling water cannot be increased indefinitely. This is because the amount of cooling water available in each
International Journal of Advance Research In Science And Engineering http://www.ijarse.com
IJARSE, Vol. No.4, Issue No.01, January 2015 ISSN-2319-8354(E)
286 |
P a g e
cycle is restricted by the water lifted per cycle. Once vapour is discharged to the condenser the pressure in vessel A decreases, as a result of which the brine solution in vessel B returns to vessel A. During this period, the pressure of air in vessel B returns to its initial value. Consequently, the well water is sucked into vessel C through the one-way valve 6. One cycle of operation is thus completed and the pump is now ready for the next cycle.Inclusion of the separate condenser in the pumping system facilitates greater freedom in the operation of the system and improvement in the performance of the system due to
(a) Reduction in the condensation time which causes the reduction in the total time required to complete a cycle and (b) Saving in time required for the removal of condensed working fluid from tank A after every 5 or 6 working cycles when there is no separate condenser.
The P-V diagram shown in Fig. 3 represents the various states followed by the working fluid (ethyl ether) during the pumping and condensation operations in a complete cycle. Here, 1-2 represents heating of the working fluid due to thermo syphon circulation in the collector at constant volume. During the process 2-3 the saturated vapor is (at state 3) separated out from tank S and is stored in tank N. process 3-4 represents isentropic expansion of vapour to
Fig. 2 Photograph of the solar thermal water pump
the pressure corresponding to discharge head (PD), in the tanks N and A. At the end of the pumping, the expanded
International Journal of Advance Research In Science And Engineering http://www.ijarse.com
IJARSE, Vol. No.4, Issue No.01, January 2015 ISSN-2319-8354(E)
287 |
P a g e
III DESIGN OF EXPERIMENTAL SETUP
The pump employs a flat-plate collector of area 1 m2 exposed to solar radiation. The volumes of the tanks used in the system depend largely on the collector area, delivery head of the pump and the quantity of water to be lifted per cycle.
Fig. 3 p-V diagram [5]
The air in tank B has to be first compressed to the pressure corresponding to the discharge head and thereafter the compressed air entering tank C accomplishes the task of pumping water. The compression of air is assumed to be isothermal (because the tank B and the long pipe connecting tanks B and C, which contain the air during the compression process, are not insulated and as such are exposed to atmospheric air, and also the air column is in communication with water at both ends). For isothermal compression, neglecting the internal volumes of the connecting pipes [1],
1 B D B F
P V P V
(1)
Where is the initial pressure of air in vessel B (=1 bar) and is the final volume of air when the pressure in B
just reaches the discharge pressure, . The compression of air in turn is accomplished by the volume of brine
solution entering from A to B. If is the volume of brine solution that has entered B from A, then [1],
B F B X
B D B X
V V V
V P V V
Hence,
(2)
From this instant, the pump is ready for operation, and for every additional litre of water entering B, a litre of air is displaced from B to C to cause pumping of one litre of water at constant discharge pressure, . Therefore [1],
International Journal of Advance Research In Science And Engineering http://www.ijarse.com
IJARSE, Vol. No.4, Issue No.01, January 2015 ISSN-2319-8354(E)
288 |
P a g e
Where, is the total volume of ethyl ether vapour in tank A at a final pressure , to pump litres of water in onecycle. Here, water to be lifted per cycle is fixed as 5 litres and hence substituting for in Eq. (3) gives,
VX V 5
(4)
When is replaced by , Eq. (2) reduces to,
(5)
But for a head of 10 m, delivery pressure bar (abs), hence,
0 .5 B 5
V V
(6)
Table 1 gives the quantity of ethyl ether vapour required for various assumed volumes of tank B calculated using Eq. (6).
For successful operation of the pump, the volume of B should be larger than that of C and also the volume of vapour should be less than or equal to VB. Also, it is advantageous to have as less as possible; otherwise (1) the
collector will take a longer time to generate this vapour; (2) losses from tank N will also be more, as its size directly depends on . It can be readily seen from Table 1 that 10 litres appears to be the appropriate volume for tank B, and
the corresponding value of is also 10 litres.
The volume of VA depends on the volume of vapour V required per cycle. A must be such that there is always a
water seal at its bottom to avoid the entry of ethyl vapour into tank B and that it can accommodate 1 to 2 litres of liquid ethyl ether floating on water. Thus, the volume of tank A has to be at least 5 litres more than the volume of vapour it has to accommodate. ie. VA = V + 5.As a result, the volume of tank A is taken as 15 litres.
Table 1 Relation between volume of tank B (V
B) and volume of ethyl ether vapour (V)
(litres)
5
10
15
20
25
30
35
40
(litres)
7.5
10
12.5
15
17.5
20
22.5
25
At the start of the first cycle the pressure of vapour in N must be higher than the discharge pressure. In fact, this pressure has to be such that at the end of the pumping process the pressure of ethyl ether vapour, now occupying tanks N and A, must be equal to the discharge pressure. When tank N communicates with tank A, the vapour expands (assumed to be reversible and adiabatic, since tanks N and A are well insulated) to PDand occupies a final
volume of (VN + V). Let PNbe the final pressure of ethyl ether vapor in tank N. The relation [1],
N N D N
International Journal of Advance Research In Science And Engineering http://www.ijarse.com
IJARSE, Vol. No.4, Issue No.01, January 2015 ISSN-2319-8354(E)
289 |
P a g e
fixes the value of VN for an assumed value of PN . γ is the ratio of specific heats for working fluid which is taken as1.05 and V is 10 litres.
The mass of ethyl ether initially in tank N is mi, which is equal to the ratio of VN and the specific volume of saturated
vapour at PN. Now, a check is made to assess the correctness of the volume and the assumed initial pressure of ethyl
ether. If the pressure assumed is correct, the following energy balance must be satisfied [1],
i.e.
m ui
f ui
W1W2(8)
Where W1 is the work done by the diethyl ether vapour in compressing the air in tank B isothermally to the
discharge pressure and is given by [1],
1 1 ln
B F B
B V
W P V
V
(9)
Where P1and VB are the initial pressure and volume of air in tank B before compression and VBF is the final volume
of air after compression and W2 is the hydraulic work done by the pump per cycle to lift VC litres of water and is
given by [1],
W2 VC g h
(10)
Here, ui is the specific internal energy of ethyl ether corresponding to the initial state in tank N (before expansion),
and ufthe final internal energy of ethyl ether (existing finally in tanks N and A) at the discharge pressure. During the
reversible adiabatic expansion process, the entropy remains constant. Thus, finally two properties, namely the pressure and the entropy are known and hence the final state of the ethyl ether vapour can be fixed, so that uf can be
calculated. If the arbitrarily assumed PN does not satisfy the above energy equation, a new value is assumed and the
procedure is repeated until the energy balance is established. The volume corresponding to the value of pressure that satisfies the above procedure will be about 15 litres.
From the literature review [4] it is found that the condensation time is critical for these pumps in achieving greater number of cycles per day. Here the expanded vapour after pumping is allowed to flow in to a separate tank inside which the copper coils are arranged as shown in Fig 4. The cooling water from the overhead tank will flow through these coils and the vapour surrounding these coil will come in contact with surface of coil will get condensed and is stored in the tank itself. For the next day before exposing collector to sun condensed liquid is fed into S tank through the pipe connected between these two. The advantage of providing such a condenser is that, it is possible to start the next cycle before the condensation of vapour in previous cycle is over. Assuming expansion of vapour from tank A to condenser chamber as isentropic (process 4-5), from state equation,
(11)
where and are the pressure and volume in tank A and PCOND is the pressure in the condenser and it should be 1
International Journal of Advance Research In Science And Engineering http://www.ijarse.com
IJARSE, Vol. No.4, Issue No.01, January 2015 ISSN-2319-8354(E)
290 |
P a g e
In Fig. 3 process 5-7 is the isobaric condensation in which the process 6-7 is in vapour dome hence is isothermal whereas in process 5-6 the temperature decreases. Hence the energy to be extracted to condense the vapour is,
v p 5 6 v 6 7
Q m c T T m h h
(12)
Where, is the mass of ethyl ether vapour to be condensed which is equal to the ratio of volume of tank A to the
specific volume of vapour at state 4. In the condenser cooling water circulated in the coil should carry away this much heat. If the condensation is to be accomplished within 3 minutes (comparable with heating time) then rate of heat removal is
kJ/s.
(13)
For the cooling water side, rate of heat carried by the cooling water is given by,
qw m cw p
To u t Tin
(14)
Fig. 4 Schematic representation of condenser
Under steady state conditions, qc = qw. Since the working fluid is ethyl ether the maximum value of ∆T can be only
4 oC (assuming Tin = 30 oC and Tout can be maximum 34 oC). Mass flow rate of cooling water can be estimated from
this and a check is made to make sure that the cooling water mass flow rate does not exceed the mass of water pumped per cycle.
The condenser coil material selected is copper of nominal size 6 mm diameter. For the flow through uniform tubes, mass flow rate where, is the density of water, A is the cross sectional area of the copper tube and C
International Journal of Advance Research In Science And Engineering http://www.ijarse.com
IJARSE, Vol. No.4, Issue No.01, January 2015 ISSN-2319-8354(E)
291 |
P a g e
at the water side can be evaluated and the correlation used is [12],
0 .5 0 .6 7 R e P r8
1 .0 7 1 2 .7 P r 1
8 n m w f N u
f
(15)
where 0.11 for heating of fluids [12] and friction factor is is given by [12],
(16)
On the vapour side the condensation is assumed to be film wise and the appropriate correlation is used to determine the heat transfer coefficient at vapour side. For laminar film wise condensation in bank of N (N is assumed as 8) horizontal tubes [12],
0 .2 5 3 2
0 .7 2 8 fg
l v s
k g h
h
N D T T
(17)
As the ethyl ether vapour condenses, the coil is progressively submerged in liquid ethyl ether. In order to consider this effect, the expression for the heat transfer coefficient ( ) is modified as [13],
1 6
v
h h N
(18)
Once heat transfer coefficient on both sides is calculated, then by neglecting the resistance of tube wall thickness the overall heat transfer coefficient is given by [4],
1 1 1 o o
i w v
d U
d h h
(19)
Here and are inside and outside diameter of the tube. Then the rate of heat transfer from vapour to cooling
water is [4],
qC U Ao S
Tsv Tw
(20)
where is the saturated vapour temperature and is the average water temperature. Since , and
temperatures are known surface area can be determined which decides the length of tube to be used.
International Journal of Advance Research In Science And Engineering http://www.ijarse.com
IJARSE, Vol. No.4, Issue No.01, January 2015 ISSN-2319-8354(E)
292 |
P a g e
2
t o t N W
H
(21)
where the number of cycles per day is the hydraulic work done by the pump and is the total solar
radiation incident on the collector during the period of operation of the pump. Since all other quantities are known, the number of cycles per day can be determined from the above equation. Once the number of cycles per day is known the mass of ethyl ether used per day is given by,
M ass o f d ieth y l eth er p er d ay = n u m b er o f cy cles × m ass o f d ieth y l eth er p er cy cle
(22)
Here mass of pentane used per day is found to be 5 kg. The outlet from the collector in to tank S must not be higher than the level of liquid in S to ensure thermo syphon flow in the collector. Hence some excess liquid is to be kept in the S tank, considering these also the mass of diethyl ether required in a day is fixed as 10 kg. Since mass of ethyl ether used per day is known, volume of S tank can be found easily.
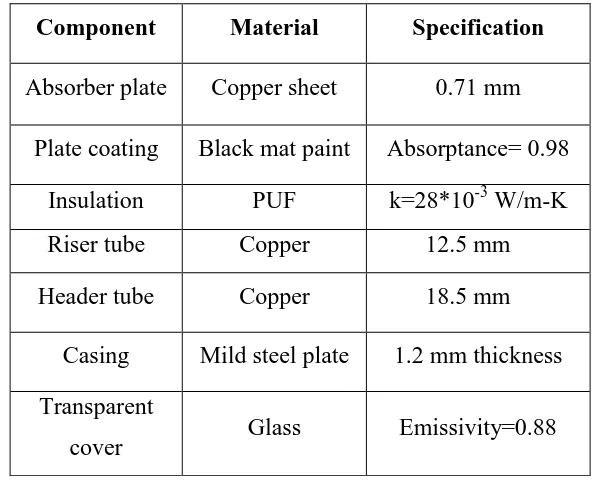
Table 2 provides the details of the flat plate collector used in the set up. Based on the procedure discussed above the optimum sizes of different tanks to pump 5 litres of water per cycle is determined and the design results are tabulated in Table 3.
Table 2 Details of various components in the Collector (Surface area of the collector = 1 m
2)
Component
Material
Specification
Absorber plate
Copper sheet
0.71 mm
Plate coating
Black mat paint
Absorptance= 0.98
Insulation
PUF
k=28*10
-3W/m-K
Riser tube
Copper
12.5 mm
Header tube
Copper
18.5 mm
Casing
Mild steel plate
1.2 mm thickness
Transparent
International Journal of Advance Research In Science And Engineering http://www.ijarse.com
IJARSE, Vol. No.4, Issue No.01, January 2015 ISSN-2319-8354(E)
293 |
P a g e
Table 3 Details of various tanks
Tank
Volume
(litre)
Diameter
(mm)
Length
(mm)
Thickness
(mm)
Material
Insulation
N
15
300
225
3
Mild steel
PUF
S
12
300
200
3
Mild steel
PUF
A
15
300
225
3
Mild steel
PUF
B
10
300
150
3
Mild steel
Not applicable
C
5
200
160
3
Mild steel
Not applicable
Condenser
30
300
425
3
Mild steel
PUF
IV RESULTS AND DISCUSSION
The experiments were conducted for three different delivery heads of 3 m, 4 m and 5 m during March and April 2014 months at which the availability of solar radiation is maximum at a place like Calicut. The maximum solar radiation during the test period is found to be around 880 W/m2. The experiments were conducted continuously for four days at each delivery head. Every day the collector is exposed to radiation from 8.00 AM onwards and the pump is ready to execute its first cycle around 10.30 AM. Consistent results at each discharge head were observed on all days at a particular discharge head.
The variation of the solar radiation with time on a typical solar day in which the experiments were conducted is plotted in Fig. 5. It is clear that the solar radiation is very less in the morning and gradually increases till the noon thereafter it decreases which is a standard trend of variation. But the maximum availability of solar radiation in a day compatible to the experiment is found to be between 10.30 AM and 3.00 PM. The pump is expected to give the best performance during this time interval and the experimental results are exactly matching. The heating time during the solar noon time is found to be much lesser as compared to other time.
International Journal of Advance Research In Science And Engineering http://www.ijarse.com
IJARSE, Vol. No.4, Issue No.01, January 2015 ISSN-2319-8354(E)
294 |
P a g e
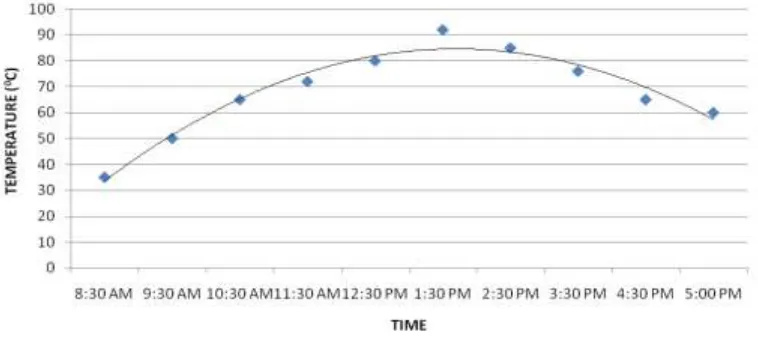
Since the solar radiation directly influences the ambient temperature, the ambient temperature variation also shows the same trend as that of the solar radiation curve which is shown in Fig. 6. If the ambient temperature remains more than that of the normal boiling point of the working fluid for a very long time then this will adversely affect the condensation process. A long time taken to complete the condensation process leads longer cycle time, with which achieving the advantage of the special condenser in this system will become considerably difficult. The variation of ambient temperature is found to be within limit during the present experimentation as shown in Fig. 6.Fig. 6 Variation of ambient temperature with time
The maximum pressure and temperature achieved are found to be around 4 bar and 90 oC when the pump is not in operation which means the valve 2 is closed. The maximum pressure achieved is more than 3.5 bar which is the theoretical pressure to be attained to pump the water to a head of 10 meter. Moreover, it is observed that the designed value of 10 bar which is more than two times the maximum pressure value and the system is always safe. Since pumping is not performed there will not be any fluctuation in the pressure and temperature build up, but in the case of pumping it will be frequently fluctuating. The variation of pressure in S tank is shown in Fig. 7 and the variation of temperature in the S tank is shown in Fig. 8.
International Journal of Advance Research In Science And Engineering http://www.ijarse.com
IJARSE, Vol. No.4, Issue No.01, January 2015 ISSN-2319-8354(E)
295 |
P a g e
the required value so heating time will be always more for the first cycle and there- after heating time will be less. Figs 9 and 10 show the exact variation of the pressure and temperature when the pump is in operation.0 0.5 1 1.5 2 2.5 3 3.5 4 4.5
8:30 AM
9:30 AM
10:30 AM
11:30 AM
12:30 PM
1:30 PM
2:30 PM
3:30 PM
4:30 PM
5:00 PM
P
res
sur
e
(ba
r)
Time of the day
Fig. 7 Variation of pressure in S tank in a day when the pump is not in operation
Fig. 8 Variation of temperature in S tank in a day when the pump is not in operation
International Journal of Advance Research In Science And Engineering http://www.ijarse.com
IJARSE, Vol. No.4, Issue No.01, January 2015 ISSN-2319-8354(E)
296 |
P a g e
maximum quantity of water pumped in a day is found to be 35 litres for a head of 3 m and the same at a head of 5 m is found to be 15 litres as shown in Table 4. Efficiency depends upon the number of cycles per day and the work output per cycle at a discharge head. Since the effect of increase in efficiency due to increase in work output per cycle dominated by the effect of decrease in efficiency due to reduction in number of cycles per day at higher delivery heads, efficiency decreases with increase in delivery head as shown in Table below.Time
09:00:00 AM 11:00:00 AM 01:00:00 PM 03:00:00 PM 05:00:00 PM
Pr
essur
e (bar)
0.4 0.6 0.8 1.0 1.2 1.4 1.6 1.8 2.0 2.2
Fig. 9 S tank pressure variation when pump is in operation
Time
09:00:00 AM 11:00:00 AM 01:00:00 PM 03:00:00 PM 05:00:00 PM
Tem
per
ature
(°
C)
35 40 45 50 55 60 65 70
Fig. 10 S-tank temperature variation when pump is in operation
International Journal of Advance Research In Science And Engineering http://www.ijarse.com
IJARSE, Vol. No.4, Issue No.01, January 2015 ISSN-2319-8354(E)
297 |
P a g e
pressure calculated to pump water and the actual pressure. This may be due to the condensation of some part of vapour while coming in contact with the brine solution in A tank. This condensation reduces the pressure inside the tank. It is found that the difference in theoretical and actual pressure is getting increasing as head increases. The more the difference in temperature between brine solution and vapour more will be the rate of condensation. DuringTable 4
Number of cycles per day, discharge and efficiency
Sl. No.
Delivery
Head
(m)
No. of
cycles per
day
Discharge
(litres per day)
Efficiency x 10
2%
1
3
7
35
0.14
2
4
4
20
0.125
3
5
3
15
0.09
the experiment it is noticed that some amount of vapour is reaching even up to C tank. This means that since water column in A tank is not a rigid one there occurs some bubbling of vapour through the brine solution so that it reaches C tank along with the air. This difficulty can be overcome by introducing a floating body over brine solution.
V UNCERTAINTY ANALYSIS
The errors involved in measuring instruments will influence the accuracy of the calculated results. So, determination of uncertainty in the measurements of experimentation is important. The only measurement required to know performance of the pump is solar radiation and the others such as number of cycles per day and quantity of water lifted per cycle are general observations. The error involved with the pyranometer which is used to measure the solar radiation is ± 5%.
Propagation of uncertainty method [16] is used to determine the combined effect of random measurement errors. According to this method the result R is a given function of variables x1,x2,x3,x4……..xn . Thus,
International Journal of Advance Research In Science And Engineering http://www.ijarse.com
IJARSE, Vol. No.4, Issue No.01, January 2015 ISSN-2319-8354(E)
298 |
P a g e
Let wR be the uncertainty in the result and w1, w2, w3, w4……wn be the uncertainties in the independent variables. Ifthe uncertainties in the independent variables are all given with the same odds, then the uncertainty in the result will
be
By following this method percentage of uncertainty in the performance parameter (energy efficiency) is 0.7245 %.
VI CONCLUSIONS
A systematic design of a thermal water pump is presented for ethyl ether as working fluid. Experiments on fabricated solar thermal water pump have been carried out for different heads of 3 m, 4 m and 5 m. The performance parameters like the efficiency of the pump and mass flow rate of water were estimated. The pump is found to be capable of operating 7 cycles per day. The heating time for the working fluid and condensation of the vapour are found to be the critical factors for time required to complete any working cycle. The high heating time for every working cycle at any delivery head was observed as a significant reason for obtaining less number of cycles per day which can be improved by using a more efficient solar collector. Since the number of cycles per day is less the overall efficiency of the pump obtained (0.14x10⁻² %) is also very less than expected
.
REFERENCES
[1] K. Sumathy, “Experimental studies on solar thermal water pump”, Applied ThermalEngineering, vol. 19, pp. 449-459, 1999.
[2] K. Sumathy, Venkatesh A, V. Sriramulu, “A Solar thermal water pump”, Applied Energy, vol. 53, pp. 235-243, 1996.
[3] Y. W. Wong, K. Sumathy, “Performance of solar water pump with ethyl ether as working fluid”, Renewable Energy, vol. 22, pp. 389-394, 2001.
[4] Sumathy K, Venkatesh A, Sriramulu V, “The importance of the condenser in a solar water pump”, Energy Conversion and Management, vol. 36, no.12, pp. 1167-1173, 1995.
[5] Y. W. Wong, K. Sumathy, “Thermodynamic analysis and optimization of a solar thermal water pump”, Applied Thermal Engineering, vol. 21, pp. 613-627, 2001.
[6] K. Sumathy, Venkatesh. A, V. Sriramulu, “Thermodynamic analysis of a solar thermal water pump”, Solar Energy , vol. 57, no.2, pp.155-161, 1996.
[7] K. Sumathy, Venkatesh. A, V. Sriramulu, “Heat transfer analysis of a flat plate collector in a solar thermal water pump” Energy, vo.l 19, no.9, pp.983-991, 1994.
[8] K. Sumathy, Venkatesh. A, V. Sriramulu, “Experimental studies on heat transfer in the flat plate collector of a solar pump”, WREC 1996.
International Journal of Advance Research In Science And Engineering http://www.ijarse.com
IJARSE, Vol. No.4, Issue No.01, January 2015 ISSN-2319-8354(E)
299 |
P a g e
[10] Y. W. Wong, K. Sumathy, “Solar thermal water pumping systems: a review,” Renewable and SustainableEnergy Reviews, vol. 3, pp. 185-217, 1999.
[11] C.L. Yaws, Thermodynamic and Physical Property Data, Gulf publishing, Houston, 1992.
[12] C.P. Kothandaraman, S. Subramanyan, Heat and Mass Transfer Data Book, New Age International Publishers, 2004.
[13] Donald. Q. Kern, Process Heat Transfer, McGraw Hill Company, 2004.
[14] D.P. Rao, K.S. Rao, Solar water pump for lift irrigation, Solar Energy, vol. 18, pp. 405-411, 1976.
[15] K. Sumathy, Venkatesh. A, V. Sriramulu, “Effect of discharge head on the performance of a solar water pump” International Journal of Energy Research , vol. 18, pp.623-629, 1989.