Article
1
Complementary Qualitative Methodologies
2
for the Analysis of Intra-urban Socio-environmental
3
Vulnerability in Barcelona (Spain). Case Studies
4
Antonio Palacios 1,*, Ana Mellado 2 and Yazmín León 3
5
1 Geography Department, Universidad Autónoma de Madrid, Cantoblanco Campus, 28049, Madrid, España;
6
7
2 Geography Department, Universidad Autónoma de Madrid, Cantoblanco Campus, 28049, Madrid, España;
8
9
3 Geography Department, Universidad de Costa Rica, Costa Rica; [email protected]
10
* Correspondence: [email protected]; Tel.: +34-606-846-093
11
12
Abstract: The city of Barcelona, like other cities in the world, suffers strong internal socio-economic
13
inequalities. Numerous works have sought to detect, quantify, characterize and / or map existing
14
intra-urban differences, almost always based on quantitative methodologies. With this
15
contribution, we intend to illuminate the complementary role that qualitative methodologies can
16
play in studies on urban socio-environmental vulnerability. We consider aspects that are not
17
quantifiable but that may be inherent to many such vulnerable spaces, both in the constructed
18
environment and in the social ambit. These questions are considered through selected
19
neighborhoods of Barcelona which have been shown (in prior works, mainly studies of
20
quantitative manufacturing) to possess elements of vulnerability including a high presence of
21
immigrants from less-developed countries, low per capita income, aging populations, or low
22
educational levels. The results reveal the multidimensionality of vulnerability in the
23
neighborhoods analyzed, as well as the essential complementarity among methodologies that
24
detect and support possible public actions aimed at reducing or eliminating intra-urban
25
inequalities.
26
Keywords: Socio-environmental vulnerability; Barcelona; spatial analysis; qualitative
27
methodology; GIS
28
29
1. Introduction
30
Urban socio-environmental vulnerability is a social phenomenon currently arousing much
31
interest in the scientific community. The concept refers to the existence of intra-urban inequalities,
32
established by differences in the social composition of a population through spatial distribution, as
33
well as how this issue affects uneven behavior in the face of social, urban, economic, demographic
34
and / or environmental problems. From this perspective, it is important to investigate the factors,
35
causes and consequences being generated, as well as possible solutions, in order to improve the
36
situation of those groups deemed most vulnerable to diverse threats.
37
In the orbit of vulnerability are found concepts such as exclusion, marginality, and poverty,
38
which though not synonymous may be mutually reinforcing. Socio-environmental vulnerability is a
39
broader concept that affects a potentially larger part of the population [1]. It is evident that the poor
40
are by their very nature vulnerable in economic terms. But here we are dealing in dynamic concepts,
41
which are not necessarily always related. The present contribution is focused on the social approach
42
to vulnerability: to show how socio-spatial structures and processes are indeed dynamic, and may
43
determine the daily lives of disadvantaged people and groups [2].
44
This contribution might be inserted in an even broader line concerned with the measurement of
45
environmental injustices at the local level, focused on the unequal behavior of diverse external
46
externalities vis-à-vis sensitive or vulnerable groups such as children or the elderly, or populations
47
with lower educational levels or income. The multifaceted character of the conditions impacting the
48
phenomena in question must always be taken into account.
49
This paper is a continuation of a series of prior works [3-4], fundamentally quantitative in
50
nature. From these emerged a synthetic indicator of relative socio-spatial vulnerability, which was
51
then applied to all neighborhoods in the city of Barcelona. In this particular contribution, we apply a
52
qualitative methodology (fieldwork) to that city’s four most vulnerable neighborhoods, in order to
53
detect non-quantifiable urban and social deficiencies.
54
The following section briefly addresses the question of urban socio-environmental vulnerability
55
in the scientific literature, also highlighting sources of information and methodological issues. Next
56
the qualitative analysis is presented, and finally some concise conclusions are offered.
57
1.1. Vulnerability in the scientific literature
58
Socio-environmental vulnerability is in itself a multidimensional and multifaceted concept [5]
59
[6], and there is no consensus regarding its definition or measurement [2]. From a strictly
60
etymological conception, it usually implies physical, economic, political, or social susceptibility; that
61
is, the potential of a population to be affected by an external issue or destabilizing phenomenon,
62
whether of natural or anthropic origin [7], and which, if not resolved, could lead to more critical
63
levels of disadvantage, poverty, and exclusion [8].
64
However, it must be borne in mind that when social inequalities are analyzed in any area,
65
reference is inescapably made to personal issues having to do with the individuals who live there.
66
That is to say that vulnerability, like any similar phenomenon under study, has a clear social
67
component. It does not affect all populations (individual, household, group, society) equally, but
68
represents a factor of internal risk corresponding to the susceptibility or predisposition of each to
69
suffer harm [7]. It is this incapacity or difficulty of certain people or groups in the face of threat (risk)
70
and / or propensity for later recovery that we understand as socio-environmental vulnerability. As
71
noted by Mateos [6], based on prior studies and from a social and economic perspective,
72
vulnerability is not a supervening condition, but rather a dynamic state. It influences diverse factors
73
such as the unequal distribution of resources, the action or inaction of individuals, and historical
74
patterns of domination and social marginalization. In fact, the most persistent cases of vulnerability
75
reveal profound deficiencies in public policies and institutions, historical exclusions and cultural
76
practices, and long-established social norms.
77
Although anyone may be vulnerable at some point in their lives, some groups are more
78
sensitive than others. The United Nations establishes three large groups: 1) the poor and informal
79
workers; 2) women, migrants, minorities, young people, the elderly, and persons with disabilities;
80
and 3) entire communities or regions.
81
The absence of a single definition demonstrates the variety of causes that may motivate or
82
encourage vulnerability. Its relationship with risks and threats is evident, and this in turn may be the
83
cause of its origin. The literature reveals two categories of hazards: those of natural origin
84
(environmental hazards) and those of human origin (social hazards). The latter are of greater interest
85
to the social sciences, but are less defined or consolidated. In addition, they are precisely the hazards
86
that appear in urban areas, linked to those groups most sensitive to the impacts mentioned above.
87
The diversity of causes that motivate human vulnerability would also explain why it has been
88
studied from many perspectives, with different approaches, definitions, and methodologies that
89
depend on the particular risk being considered [1]. From this plenitude, various types of
90
vulnerability (socio-demographic, socio-economic, environmental, residential, subjective) have been
91
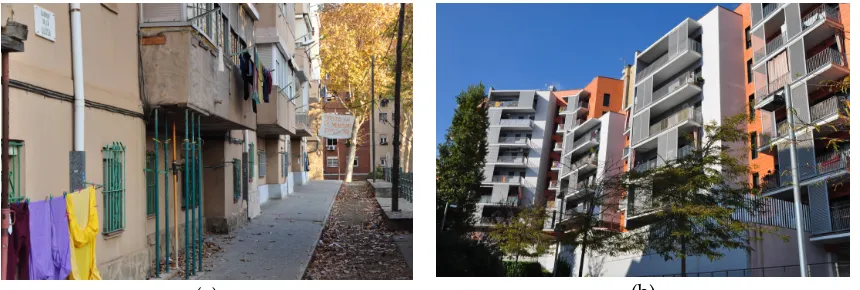
discerned.
92
With regard to the measurement of vulnerability, numerous attempts have been made in recent
93
years to create indicators and measures from different perspectives and methodologies. In the
94
dimensions of demographics (age, race, sex, country of birth, education, occupation, etc.), economics
96
(social status, income, savings, etc.), or another type (housing, endowments, social networks,
97
security, etc.), usually referenced at the individual or household level. Many studies opt for
98
analytical methodologies that transform and combine the variables used, building indices of
99
socio-economic status or social vulnerability [9]. Some of the references cited thus far offer extremely
100
valuable statements on the use of quantitative methodologies over time.
101
Less often, works that seek to measure vulnerability have been complemented by qualitative
102
methodologies. This was the case for example in the Catalog of Vulnerable Districts, included in the
103
Observatory of Urban Vulnerability, developed jointly by the Ministry of Development and the
104
Department of Urban Planning of the Polytechnic University of Madrid. Elsewhere, a working
105
group at the University of Granada led by Carmen Egea has long experience in the use of mixed
106
methodologies. More recently, geo-demographic analysis has been incorporated into urban social
107
geography, which (beyond providing a general index) focuses on the formulation of a specific
108
geo-demographic classification to typologies of hazard and place, more heavily weighting the most
109
significant variables to a specific geo-historical context, and based on mixed methodologies.
110
2. Objective, materials, and methods
111
Starting from the above considerations, our objective here is to show the role that fieldwork can
112
play as a complementary, qualitative methodology in studies on urban socio-environmental
113
vulnerability when detecting deficiencies or non-quantifiable social and urban problems.
114
The information sources used in the quantitative analyses pre-dating this work [3-4] were the
115
statistical data provided by the Statistics Department of the Barcelona City Council (Municipal
116
Register) and, occasionally, data from regional organizations. The year of reference is 2015.
117
The digital geodata layers of the city, with their respective divisions, were likewise facilitated
118
by the municipal administration. The selected scale of analysis was the neighborhood and the
119
"populated urban area" (AUP). The latter indicates the residential or mixed-use urban space where
120
the population has greater presence in their daily lives (see Figure 1).
121
122
123
The facets or components of vulnerability considered were diverse and varied, depending on
125
incidence and the availability of data. Variables were combined related to: education, given that
126
persons with low or no training show limited capacities for self-protection and personal care, or
127
limited recourse to existing defense facilities; age, which makes some people more fragile than others
128
in the face of external factors; demographic mortality indicators that reflect living conditions and are
129
an expression of extreme vulnerability; income and professional status, key to assuaging the
130
vulnerability of individuals and certain groups; immigration status, supposing the individual has
131
moved geographically; and size of household, in the number of members that compose it, reflective of
132
housing shortages. All these facets can greatly impact on the intensity with which
133
socio-environmental vulnerability is manifested.
134
The research crystallized in a Synthetic Index of Relative Socio-spatial Vulnerability (ISVuSAR),
135
resulting from a principal component analysis (PCA) with Varimax rotation, and in normalization of
136
the variables linked to each of the above facets by matching amplitude and eventual transposition.
137
This allowed classification of the neighborhoods of the city (see Figure 2).
138
139
140
Figure 2. Map of the ISVuSAR results by neighborhood (AUP) of Barcelona. Source: [3]
141
142
As regards using fieldwork and other sources as qualitative methodological tools, to
143
complement previous analysis, an intensive fieldwork approach was developed in October 2017 for
144
the selected cases, later completed with relevant information from scientific publications, reports,
145
press releases, and websites, as well as interviews with neighborhood associations. Dossiers were
146
prepared by theme and neighborhood into which non-quantifiable aspects or components of
147
socio-environmental vulnerability were collected. These aspects were further divided into two
148
categories: the constructed environment and the social sphere. The former involves issues such as
149
deficiencies in infrastructure, green space, public space, transport, facilities, or housing, whether
150
such deficiencies are owed to status, age, deterioration, or other factors. The social sphere refers to
151
problems linked to endowments and facilities at the association level, to the presence of ethnic
152
groups facing integration difficulties, to the physical exclusion of the natural environment, to the
153
3. Results and Discussion. The most acute dimension of vulnerability: case studies
155
Socio-environmental vulnerability manifests in different intensities, as we have seen. It would
156
be impossible here to rigorously detail the many investigations into vulnerability in Barcelona
157
carried out in recent decades. An article by Sargatal [10] gives a very complete review of the main
158
contributions focused on the historical center, and the methodologies used. There is noticeable and
159
increasing interest from diverse disciplines in the approach to, and knowledge around, socio-spatial
160
reality. Similarity to the our topic moves us to highlight works by Martori and Hoberg [11-12],
161
Martínez et al. [13], Domingo and Bayona [14], and Subirats and Rius [15], which from diverse
162
methodological approaches have deepened knowledge on the reality of the city.
163
In this work, we focus on four neighborhoods to which the ISVuSAR has ascribed higher values
164
(1.5 times the deviation). These are the Trinitat Nova, Raval, Marina del Prat Vermell, and
165
Barceloneta neighborhoods. For these areas, aspects or qualitative problems stemming from both the
166
constructed environment and the social sphere have been analyzed using the proposed
167
methodology.
168
Trinitat Nova is a neighborhood of the Nou Barris district, located on the northeastern
169
periphery of the city, on the mountain slopes of Collserola and on the left bank of the Besós (Figure
170
3). The neighborhood occupies an area of 0.80 km2 and numbered 7,257 inhabitants in 2016 (down
171
from 8,110 in 2008). Its physical boundaries coincide with the streets Aiguablava, Via Favéncia and
172
Garbí, and Avenida Meridiana.
173
174
175
Figure 3. Location of the Trinitat Nova neighborhood. Source: own elaboration
176
177
This dormitory quarter (monofunctional) is a clear example of massive collective social housing
178
from the Franco regime. Its poor construction quality (aluminosis and carbonatosis), together with
179
the gradual socio-economic and environmental deterioration of the site (Figure 4a), were the bases
180
for two major urban interventions carried out in recent decades (Figure 4b). The first, in 1997,
181
followed the city’s Urban Plan and involved area remodeling through special planning (PERI),
182
improvement of accessibility via the metro, and integration into the ECO-City Project (financed by
183
the European Community within its Fifth Framework Program for Research and Development). The
184
second intervention, the Trinitat Nova Urban Initiative of 2007-2013 (20 million euros) continued the
185
Barrios Plan of 2016-2020 (http://pladebarris.barcelona/es), promoted by the Barcelona City Council,
187
consists of ten plans involving 16 city neighborhoods in the city, targeting integrated actions in
188
education, social rights, economic activity, and urban ecology, with a planned investment of more
189
than 150 million euros. Of the four cases here analyzed, three (Trinitat Nova, Raval, and La Marina
190
del Prat) are featured in some of these plans. Trinitat Nova will, without a doubt, see the reduction
191
or elimination of a good many existing problems.
192
193
(a) (b)
Figure 4. Trinitat Nova. (a) Housing pending demolition; (b) New homes.
194
Source: authors (November 2017)
195
196
The Trinitat Nova neighborhood, largely populated by the working class and immigrants,
197
exhibits socio-demographic characteristics that could clearly be improved, as repeatedly
198
demonstrated by historical and current association and protest movements. The Community Plan of
199
Trinitat Nova (and its corresponding diagnoses), launched in 1996 on the initiative of the
200
Neighborhood Association, has led to development of an innovative instrument and integrator of
201
concerned social agents. Blanco [16] offers an interesting comparative analysis of the urban
202
regeneration policies developed in the Raval and Trinitat Nova neighborhoods, two areas of
203
Barcelona where family income is the lowest. Trinitat Nova presents a very high percentage of
204
population without education (8.6%), a low rate of population with higher education (5.7%), a high
205
percentage of foreign residents (around 24%), an unemployment rate around 18%, and the highest
206
rate of teen pregnancy in the city.
207
Qualitative analysis reveals problems linked to the urban environment, including: the presence
208
of architectural barriers; noise and pollution from road transport infrastructures; deterioration of
209
public spaces, especially in the vicinity of the Les Freixes urban gardens; and problems (currently
210
being addressed) related to the antiquity, poor state of conservation, and lack of basic facilities
211
within residential buildings. Special attention is needed to resolve issues deriving from a substantial
212
increase in the Property Tax (IBI) borne by tenants of new officially protected housing (three or four
213
times the prior rates).
214
The social environment is further defined by the physical exclusion of the neighborhood with
215
respect to the city as a whole (barrier effect), derived from its geographical position and the layout of
216
large transport infrastructures (Meridiana and Dalt Avenues). The lack of youth-oriented, sports
217
facilities and economic activities is also significant. The latter are present only in the commercial
218
spaces of new buildings constructed during regeneration, or in the traditional market. According to
219
El Diario, "While Barcelona averages one commercial establishment for every 28 inhabitants, in
220
Trinitat Nova there is one for every 180 inhabitants" (eldiario.es, 21 January 2016). Added to this is
221
the persistence of marginal activities, and latent insecurity near the housing blocks to which
222
relocation of inhabitants affected by demolition of old structures is pending, as well as the
223
difficulties of integration of certain groups (Gypsies from outside Barcelona and mainly Pakistanis).
224
For its part, the Raval neighborhood, long regarded as Chinatown or a rogue area, is located in
225
the Ciutat Vella district (Figure 5). Its defined boundaries are Parallel Avenue to the south (dividing
226
Sant Antoni district); and Pelayo Street and La Rambla, marking the division from the adjacent
228
Gothic Quarter. Two large urban projects, Rambla del Raval and Illa Robadors, are located within
229
the zone.
230
231
232
Figure 5. Location of the Raval neighborhood. Source: own elaboration
233
234
The Raval presents two significant demographic features. On the one hand, it has a very high
235
population density (around 44,000 inhabitants per km2, or 47,000 inhabitants within an area of 1.07
236
km2). On the other hand, almost half of the population (47%) is of immigrant origin, coming from
237
less-developed countries. Furthermore, analysis shows that more than half of the houses are of small
238
size (56.5%) and that around 40% of persons over 75 years of age live in one-person homes.
239
From the social perspective, this complex neighborhood is an authentic laboratory for urban
240
studies [13], characterized by its curious socio-economic mix, with more-or-less differentiated areas
241
tending to correspond to the country of origin of the inhabitants. Thus, areas of higher income tend
242
to coincide with inhabitants of national origin, along with a significant number of European
243
immigrants of fairly recent arrival. On the other side, the percentage of extra-European immigrants
244
is extremely high, with a clear predominance of Filipinos, Pakistanis, and Moroccans.
245
This neighborhood first emerged as a suburb beyond the medieval wall, and it is rich in cultural
246
and architectural heritage (Mercado de la Boquería, Contemporary Art Museum, Contemporary
247
Culture Center, Güell Palace, etc.); but this is currently marred by marginal activities linked to drugs
248
and prostitution (traditional, perhaps), as well as notorious "narco-flats". And yet given its central
249
location, it is undergoing gentrification at high magnitude, served by intense tourist activity
250
(festivals, fairs, congresses, cruises, etc.). This has led to the dispersal of longtime residents to the
251
city’s peripheral zones, and to a gradual denaturalization of the neighborhood’s traditional character
252
[17].
253
Our qualitative analysis reveals multiple problems linked to the urban environment such as: the
254
lack of green spaces (the Jardins de Sant Pau del Camp and Rubió i Lluch being exceptions, in
255
addition to the Plaza de Josep Folch); noise pollution and garbage (Figure 6a); difficulty in physical
256
mobility due to the layout and narrowness of streets, and to problems derived from the scarcity of
257
parking; and housing issues including superannuation, poor maintenance or reform, overcrowding,
258
lack of basic facilities and, more recently, tourism outsourcing. Regarding the social environment,
259
the main problems detected here include: difficulty of immigrants to integrate, with clear spatial
260
differentiation by group; the gradual orientation of economic activities towards tourism, with the
261
consequent loss of traditional trade; explicit insecurity, evidenced by robberies of tourists; the
262
marginal activities described above; and the increase in real-estate pressures driven by gentrification
263
(a) (b)
Figure 6. El Raval. (a) Rubbish and deterioration; (b) Neighborhood demands.
265
Source: authors (November 2017)
266
267
The third neighborhood under analysis, La Marina del Prat Vermell, is located in the
268
Sants-Montjuïc district (Figure 7) and presents certain singularities. It is currently inhabited by only
269
a thousand people (1,143 in 2016), of whom approximately one fifth are immigrants, and with much
270
lower density (around 80 inhabitants per km2). It is among the neighborhoods with the highest
271
percentage of residents without education (7.8%), and of the four most vulnerable neighborhoods
272
discussed here, it suffers the highest rate of unemployment (19.4%). Also high is the proportion of
273
undersized houses (77.1%), mitigated by the city’s lowest rental and sales prices, per square meter
274
(396 euros and 684 euros, respectively).
275
276
277
Figure 7. Location of the La Marina del Prat Vermell neighborhood. Source: own elaboration
278
279
This small neighborhood’s origins were oriented to agriculture and livestock, and it is located
280
between Montjuïc mountain and the Zona Franca industrial sector. The stamp of the Primo de
281
Rivera regime was visible in the promotion of cheap "Eduardo Aunós" houses of 1929, the
282
demolition / relocation of which in the 1990s made room for today’s constructions. Some historic
283
industrial (often obsolete) buildings survive, along with scattered residential nuclei (Figure 8a).
284
With other nearby neighborhoods (Polvorín, Can Clos, Can Tunis), La Marina del Prat Vermell
285
project is under consideration by Barcelona Urban Planning Management (BAGURSA). The project
287
was initially proposed in 2004 as part of a major urban renewal drive that included 22 @, La Sagrera,
288
Plaça de les Glòries, and Can Batlló [18]. The new resultant neighborhood will cover 80 hectares and
289
feature 11,000 homes (slightly less than half of them public) to accommodate 30,000 potential
290
residents (http://www.bagursa.com/lamarina/proj.html). This process has been made possible
291
thanks to modifications to the Metropolitan General Plan of 1976, through requalification of the land
292
from industrial to mixed-use. The urban renewal project will mean development of the area around
293
the inhabited nucleus, favoring the location of economic activities, along with significant additions
294
of public facilities and spaces to help unite the old Free Trade Zone socially and urbanistically. This
295
project’s the lack of sensitivity to architectural and industrial heritage is perhaps its most
296
controversial aspect, with the Bausili and Santiveri colonies and the Bertrand and Serra factories [19]
297
slated for removal.
298
Today, problems linked to the urban environment have mainly to do with the scarcity and poor
299
accessibility of urban transport (currently accessible only by bus, with plans for metro extension),
300
and to the lack of parking and poor quality of certain buildings, despite their fairly recent
301
construction (Figure 8b).
302
303
(a) (b)
Figure 8. La Marina del Prat Vermell. (a) Homes of the Bausili Colony;
304
(b) Deterioration of modern buildings. Source: authors (November 2017)
305
306
In terms of the social perspective, the neighborhood’s problems are expressed in: a lack of
307
endowments and facilities (there are no schools or nurseries); the physical exclusion of the area,
308
given its distance from the core city; the social uprooting of inhabitants, many of whom had been
309
relocated from other areas; and latent insecurity and the presence of marginal activities linked to
310
drugs, despite the adjacent Mossos de Esquadra Police Station.
311
Finally, the neighborhood known as La Barceloneta is also located in the Ciutat Vella district
312
(Figure 9), but its population volume and density, although quite high (16,000 inhabitants in 1.24
313
km2, or 12,900 inhabitants per km2), are lower than in nearby Raval. The percentage of foreign
314
residents (31.3%) is the second highest among the neighborhoods analyzed.
315
This old seaside district (the beach neighborhood), traditionally popular and working class, is
316
strong in character. Urban contrasts exist between the maritime front (the promenade and beaches of
317
San Miguel, San Sebastián, and Barceloneta-Somorostro) and the western border (Moll), and
318
between large corporate headquarters buildings (Gas Natural or Mapfre), casinos, and hotels (Arts)
319
and the residential nucleus, where traditional housing coexists with novel social housing (the MTM
320
project, Figure 10a). All of this shares an area limited by the sea and by urban pressures to densify
321
the use of space. Notable are successful drives by local associations (the Ostia and the Platform in
322
Defense of Barceloneta, now united as "La Barceloneta diu prou") to halt projects deemed harmful to
323
the neighborhood [20].
324
Worthy of further note is recognition of the important role of the public space as useful and
325
condition the urban impact or more traditional buildings of lower height, whose progressive growth
327
contrasts with the narrowness of the streets.
328
329
330
Figure 9. Location of the Barceloneta neighborhood. Source: own elaboration
331
332
Within the neighborhood, problems related to the urban environment include: the lack of green
333
spaces (only Barceloneta Park, located at one extreme, is significant); difficulty in physical mobility,
334
both for vehicles and pedestrians, given the narrowness of streets in the residential nucleus; the
335
small number of surface parking spaces; housing concerns related to antiquity, poor maintenance,
336
lack of facilities and sometimes over-occupation (infamous "houses of rooms", Figure 10b). The
337
excessive supply of tourist homes in the core neighborhood is also a current concern, driving out
338
traditional residents and prompting fierce neighborhood protests (2014 saw many mobilizations
339
under the slogan "La Barceloneta is not sold", seeking to publicize the proliferation of tourist
340
apartments derived from transformation of older housing into modern flats destined exclusively for
341
rental by tourists). Finally, as elsewhere, the neighborhood has experienced a significant increase in
342
housing prices (a more detailed analysis of the evolution of this market in La Barceloneta can be
343
found in Pareja and Simó [21].
344
345
(a) (b)
Figure 10. La Barceloneta. (a) Social housing in MTM; (b) Small houses.
346
Source: authors (November 2017)
347
Problems linked to the social environment are here fundamentally due to intensive tourism,
349
which the neighborhood supports, also reflected in the commercial tertiarization towards this sector
350
(hospitality) and in the lack (or expulsion) of local commerce. As a consequence, the (latent, at least)
351
social uprooting of the residents is another growing concern.
352
In line with the above, Alamilla [22] offers an interesting analysis of the costs and benefits
353
derived from tourism among a residential population. Chief among the costs would be a rise in
354
consumption of alcohol, increased noise and crowding in public spaces, increases in the prices of
355
goods and services, and mounting crime. Among the benefits would be the growth of commercial
356
activity and employment and the conservation of typical local cuisine.
357
5. Conclusions
358
The detection and analysis of urban socio-environmental vulnerabilities, from both quantitative
359
and qualitative perspectives, can be very useful for informing public actions aimed at reducing or
360
eliminating intra-urban inequalities. In this work, we have sought to deepen understanding of these
361
issues through the use of fieldwork and other qualitative sources, as a complement to quantitative
362
methods, and we believe we have demonstrated the suitability of such research.
363
With regard to the four case studies, we offer the following reflections. In the Trinitat Nova
364
neighborhood, time will tell whether the integral regeneration plan being undertaken is effective or
365
not. The most colorful and evident urban transformation are already clearly visible. But these sorts
366
of urban operations have been practiced time and again in many other cities, without managing to
367
significantly improve the living conditions of inhabitants in terms of employment, education,
368
ecology, economy, etc. We hope that this will not be the case in Trinitat Nova, and that European
369
and municipal resources will serve to reverse current imbalances vis-à-vis other neighborhoods of
370
the city, as the slogan of the Neighborhood Plan promises.
371
In Marina del Prat Vernell, interventions have tended toward urban renewal, ignoring the
372
neighborhood’s past and seeking to bring it in closer alliance with the city center. It remains to be
373
seen whether the zone’s geographical location makes it a target location for hotels and offices, which
374
could serve as an economic boost and help diminish its traditional isolation.
375
Raval, an archetypal space characterized by a mixed uses and social collectives, is among the
376
most studied of Barcelona’s neighborhoods, from various perspectives. The diversity and
377
multidimensionality of the socio-spatial phenomena in this neighborhood presents the main obstacle
378
to the adequate and consensual implementation of urban policies. Here, more than anywhere in
379
Barcelona, the participation of all relevant agents is necessary. This is no small challenge, but it must
380
be confronted to alleviate the neighborhood’s persistent vulnerabilities.
381
Like Raval, La Barceloneta is today characterized by a confluence of well-differentiated social
382
groups, including immigrants, tourists, new urban tribes, and traditional residents. This is an
383
example where urban processes and interventions have driven changes to the neighborhood’s
384
traditional residential function, mostly due to the increase in its tourist attraction. As recognized by
385
Pareja and Simó [21], its potential as a gentrificable space is very high, and this is seen clearly in the
386
protests and demonstrations of residents carrying banners.
387
In this work, we set out to complement analysis of the multidimensionality and growing
388
vulnerability of these neighborhoods, from a geographic / territorial perspective rather than a
389
quantitative one. This seems to infer a further need to undertake (or to continue, in some cases)
390
actions aimed at improving both the constructed environment and the social ambit, to ensure the
391
right of people to the city itself, and a better quality of life to those who live there.
392
Author Contributions: All the authors have contributed in similar proportion to the development of this work.
393
The sections have been developed jointly and coordinated among all authors. The supervisory task
394
corresponded to the first signatory author.
395
Funding: This research has been funded by the Ministry of Economy and Competitiveness of Spain, within the
396
framework of the Research Project "Air pollution, vulnerable populations and health: analysis of environmental
397
Conflicts of Interest: The authors declare no conflict of interest. The funding organism had no role in the design
399
of the study; in the collection, analysis, or interpretation of data; in the writing of the manuscript; or in the
400
decision to publish the results.
401
References
402
1. Morrone, A.; Scrivens, K.; Smith, C.; Balestra, C. Measuring vulnerability and resilience in OECD
403
countries. Document prepared for the IARW-OECD Conference on economic insecurity, November 22-23,
404
2011, Paris (France).
405
2. Sánchez, D.; Egea, C. Enfoque de vulnerabilidad social para investigar las desventajas socioambientales.
406
Su aplicación en el estudio de los adultos mayores. Papeles de población. 2011, 17 (69), 151-185.
407
3. Moreno, A.; Palacios, A.; Suárez, P. Elaboración de un índice de vulnerabilidad socio-ambiental
408
intraurbana apoyado en sistemas de información geográfica. In Naturaleza, territorio y ciudad en un mundo
409
global; Allende, F. et al., Eds.; Ediciones de la Universidad Autónoma de Madrid and AGE: Madrid, 2018,
410
2629-2638.
411
4. Moreno, A.; Palacios, A.; Suárez, P. Medición de la vulnerabilidad socio-ambiental intraurbana: un ensayo
412
exploratorio basado en SIG. In Aplicaciones geotecnológicas para el desarrollo económico sostenible, XVII
413
Congreso Nacional de Tecnologías de la Información Geográfica; Galacho, F. et al., Eds.; Asociación de
414
Geógrafos Españoles: Madrid, 2016, 214-223.
415
5. Alguacil, J.; Camacho, J.; Hernández, A. La vulnerabilidad urbana en España. Identificación y evolución
416
de los barrios vulnerables. EMPIRIA. Rev. de Metodología de Ciencias Sociales. 2014, 27, 73-94.
417
6. Mateos, P. La doble segregación urbana: desigualdades socio-espaciales y justicia ambiental. In Actas del
418
III Congreso Internacional de Desarrollo Local; Márquez, J. et al., Coords.; Universidad de La Habana:
419
Cuba, 2013, 3488-3510.
420
7. Cardona, O. La necesidad de repensar de manera holística los conceptos de vulnerabilidad y riesgo: una crítica y una
421
revisión necesaria para la gestión; Centro de Estudios sobre Desastres y Riesgos de la Universidad de los
422
Andes: Bogotá, Colombia, 2003.
423
8. Brooks, N. Vulnerability, risk and adaptation: a conceptual framework, Working Paper 38; Tyndall Centre for
424
Climate Change Research, University of East Anglia: Norwich, 2003. Available at: www.tyndall.ac.uk
425
9. Holand. I.; Lujala, P. Replicating and adapting an index of social vulnerability to a new context: a
426
comparison study for Norway. Annals of the Association of American Geographers. 2013, 65 (2), 312-328.
427
10. Sargatal, Mª. El barrio del Raval de Barcelona (1999-2008). Transformaciones urbanas y nuevos enfoques
428
metodológicos para el estudio del centro histórico. Biblio 3W. Rev. Bibliográfica de Geografía y Ciencias
429
Sociales. 2009, vol. XIV, nº 824. <http://www.ub.es/geocrit/b3w-824.htm>
430
11. Martori, J.; Hoberg, K. Indicadores cuantitativos de segregación residencial. El caso de la población
431
inmigrante en Barcelona. Scripta Nova. Rev. Electrónica de Geografía y Ciencias sociales. 2004, vol. VIII, nº 169.
432
<http://www.ub.es/geocrit/sn/sn-169.htm>
433
12. Martori, J.; Hoberg, K. Nuevas técnicas de estadística espacial para la detección de clusters residenciales de
434
población inmigrante. Scripta Nova. Rev. Electrónica de Geografía y Ciencias sociales. 2008, vol. XII, nº 261.
435
<http://www.ub.es/geocrit/sn/sn-263.htm>
436
13. Martínez, S.; Carreras, C.; Frago, L. El Raval de Barcelona, un laboratori d’estudis urbans. Treballs de la
437
Societat Catalana de Geografia. 2015, 79, 125-150.
438
14. Domingo, A. ; Bayona, J. Movilidad, vivienda y distribución territorial de la población marroquí en
439
Cataluña. Estudios Geográficos. 2007, 68 (263), 465-496.
440
15. Subirats, J.; Rius, J. Del Xino al Raval; Editorial Hacer: Barcelona, España, 2008.
441
16. Blanco, I. Gobernanza urbana y políticas de regeneración: el caso de Barcelona. Rev. Española de Ciencia
442
Política. 2009, 20, 125-146.
443
17. Fernández, M. Asaltar el Raval. Control de población y producción de plusvalías en el barrio barcelonés.
444
URBS. Rev. de Estudios Urbanos y Ciencias Sociales. 2012, vol, 2, nº 1, 51-68.
445
18. Badia, J. La Marina del Prat Vermell : ¿nueva centralidad urbana? Master’s thesis, UPC, Barcelona, 2015.
446
19. Granados, J.O. Els grans projectes d’actuació a la Marina del Prat Vermell i al Morrot de Montjuïc. Biblio
447
3W. Rev. Bibliográfica de Geografía y Ciencias Sociales. 2013, Vol. XVIII, nº 1049(06).
448
<http://www.ub.es/geocrit/b3w-1049/b3w-1049-06.htm>
449
20. Makhlouf, M. Transformaciones urbanas desde la resistencia. Aproximaciones a un movimiento vecinal
450
21. Pareja, M.; Simó, M. Dinámicas en el entorno construido: renovación, gentrificación y turismo. El caso de
452
la Barceloneta. ACE: Architecture, City and Environment. 2014, 9 (26), 201-222.
453
22. Alamilla, C. Análisis de los impactos socioculturales desde la perspectiva del residente que el turismo
![Figure 1. Territorial delimitations in Barcelona. Source: [3]](https://thumb-us.123doks.com/thumbv2/123dok_us/8057908.1342885/3.595.195.425.455.759/figure-territorial-delimitations-in-barcelona-source.webp)
![Figure 2. Map of the ISVuSAR results by neighborhood (AUP) of Barcelona. Source: [3]](https://thumb-us.123doks.com/thumbv2/123dok_us/8057908.1342885/4.595.189.430.272.595/figure-map-isvusar-results-neighborhood-aup-barcelona-source.webp)