Wage Dynamics and Minimum Wages in Britain
Richard Frederick Dickens
ProQuest Number: 10106665
All rights reserved
INFORMATION TO ALL USERS
The quality of this reproduction is dependent upon the quality of the copy submitted.
In the unlikely event that the author did not send a complete manuscript and there are missing pages, these will be noted. Also, if material had to be removed,
a note will indicate the deletion.
uest.
ProQuest 10106665
Published by ProQuest LLC(2016). Copyright of the Dissertation is held by the Author.
All rights reserved.
This work is protected against unauthorized copying under Title 17, United States Code. Microform Edition © ProQuest LLC.
ProQuest LLC
789 East Eisenhower Parkway P.O. Box 1346
Abstract
After a long period of relative stability, wage differentials in the UK have risen
sharply since the late 1970s. Wage inequality is now greater than it was 100 years ago.
This increase in cross sectional inequality has been widely documented. The aim of the
first part of thesis is to estabhsh the degree to which earnings differences are permanent
or transitory and to study the level of mobility of individuals within the earnings
distribution. Using data from the New Earnings Survey (1975-1994) and the British
Household Panel Survey (1991-1994), I provide an analysis of the dynamics of the
earnings process and investigate whether this has changed over time.
An examination of the covariance structure of male earnings points to the
existence of a permanent component, that increases with age, and a highly persistent
transitory component. Both of these components rise over time, each explaining about
half of the rise in wage inequality from 1975 to 1994. The investigation into wage
mobility suggests considerable persistence in the wage distribution. There is some
evidence that mobility has fallen over this time period.
The second part of this thesis studies the economic effects of minimum wages in
Britain. Using a panel of Wages Council industries I report evidence showing that
increases in the minimum wage compress the wage distribution, but there is no evidence
of any adverse employment effects. Meyer and Wise (1983a, 1983b) propose a technique
for estimating the employment effects of the minimum wage from data on a single cross
section of earnings. I show that, at least for Britain, their approach is highly sensitive to
key assumptions about the functional form for wages and the impact of the minimum on
the wage distribution. Their technique although appealing on an intuitive level does not
Acknowledgements
Firstly, I would like to thank my supervisors Richard Blundell and Stephen Machin
for all their invaluable advice and suggestions. Special thanks also to Alan Manning for
many helpful suggestions and discussions. Many others have provided helpful discussions
and comments; including Joe Altonji, Danny Blanchflower, Donna Brown, Ken Burdett,
David Card, Kevin Carter, Paul Gregg, Alan Krueger, Costas Meghir, Bruce Meyer, Steve
Pischke, Xavier Ramos, Mark Stewart, Chris Trinder, Jonathan Wadsworth, Stephen
Woodland and a number of anonymous referees. I would also like to thank seminar
participants at the University College London, the Centre for Economic Performance, the
Labour Market Changes and Income Dynamics Conference at the CEP and the ESRC
Seminar Group on income distribution, taxes and benefits. Thanks also 6oProfessor J. 7.
Hughes for providing an insight into the wage setting procedure in the Wages Councils,
I would like to thank the Office for National Statistics for providing me with
access to both the New Earnings Survey micro data and the Joint Unemployment and
Vacancy Operating Statistics data. Particular thanks go to Robert Jukes for his assistance
with this data. The British Household Panel Survey was provided by the ESRC Research
Centre on Micro Social Change at the University of Essex and supplied through the ESRC
Data Archive. The Labour Force Survey was supplied by the ESRC Data Archive.
Thanks to David Wilkinson for assistance with the Labour Force Survey. Excellent
computing facilities and support were provided by Adam Lubanski and Lucy Matthew.
I am grateful to the Centre for Economic Performance for providing me with a
DECLARATION
1. No part of this thesis has been presented to any University for any degree.
2. Two Chapters of this thesis were undertaken as joint work with my supervisor, Professor Stephen Machin, and with Dr Alan Manning of the London School of Economics. For the first of these, (chapter 5) “The Effects of Minimum Wages on Employment: Theory and Evidence from Britain”, 1 contributed 33% of the work. For the second, (chapter 6) “Estimating the Effect of Minimum Wages on Employment from the Distribution of Wages: A Critical View”, I contributed 50% of the work. A statement from my co-authors confirming this is given below.
1 conjSrm the above declaration referring to Joint work carried out with Richard Dickens.
Stephen Machin
1 confirm the above declaration referring to joint work carried out with Richard Dickens.
(Ai
Table of Contents
Chapter 1 - Introduction 12
Chapter 2 - A Review of the Literature 19
2.1 Cross Sectional Wage Dispersion in the UK 19
2.1.1 The UK Experience in an International Context 19
2.1.2 The UK Experience in More Detail 21
2.1.3 Possible Explanations for the Rise in Inequality 23
2.1.4 Is the Rise in Wage Inequality Important? 25
2.2 The Dynamics of Individual Earnings 27
2.2.1 Evidence from the US 27
2.2.2 The UK Evidence 31
2.2.3 Recent Evidence from Other Countries 34
2.3 The Economic Effects of Minimum Wages 36
2.3.1 The Effects of Minimum Wages in the US 37
2.3.2 The Evidence from the UK Wages Councils 43
Chapter 3 - The Evolution of Individual Male Wages
in Great Britain: 1975-94 51
3.1 Introduction 51
3.2 Why are Earnings Dynamics Important? 53
3.3 Data Description 59
3.4 The Covariance Structure of Earnings 63
3.5 Variance Components Models 66
3.6 Summary and Conclusions 73
Chapter 4 - Caught in a Trap?
Wage Mobility in Great Britain: 1975-94 83
4.1 Introduction 83
4.2 Data Description 86
4.3 The Transition Matrix Approach to Mobility 92
4.3.1 Mobility in the 1990s 92
4.3.2 Have Mobility Patterns Changed Over Time? 97
4.4 Other Approaches to Mobility 103
4.5 Conclusion 114
Chapter 5 - The Effects of Minimum Wages on Employment:
Theory and Evidence from Britain 161
5.1 Introduction 161
5.2 The Model 163
5.3 The Effects of Minimum Wages on Employment in Britain:
The Wages Councils 170
5.3.3 The Effect of the Wages Councils on Employment;
Panel Data Estimates 173
5.4 Conclusion 180
C hapter 6 - Estim ating the Effect of M inim um Wages on Em ploym ent
from the D istribution of Wages: A Critical View 190
6.1 Introduction 190
6.2 The Meyer-Wise Approach 191
6.3 The Wages Councils 197
6.4 The Effect of Minimum Wages on the Wage Distribution 199
6.5 The Effect of Minimum Wages on Employment 200
6.6 Conclusions 205
C hapter 7 - Conclusions 218
Appendix 1 - Technical Appendix for Chapter 3 222
Appendix 2 - Additional Figures for Chapter 3 225
Appendix 3 - Additional Tables for Chapter 6 238
List of Tables
Table 2.1 90 -1 0 Wage Ratios for Selected OECD Countries: 1973-1995 46
Table 2.2 Wage Inequality in the UK: 1886-1990 47
Table 2.3 Five Year Earnings Mobility in Selected OECD Countries for
Full Time Wage and Salary Workers: 1986-1991 48
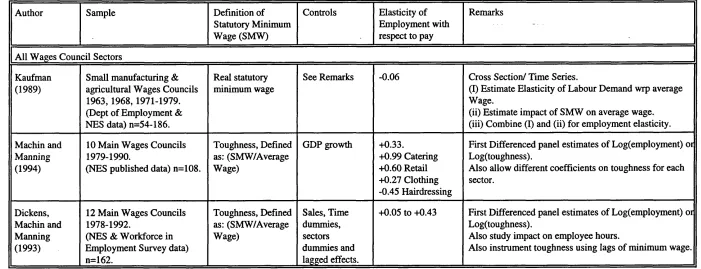
Table 2.4 The Effects of the UK Wages Councils on Employment 49
Table 3.1 The Structure of the Panel by Cohort - Percent of Cohort
Present After Given Number of Years 75
Table 3.2 Descriptive Statistics of Log Real Hourly Earnings each Year 77
Table 3.3 Error Components Models for Log Real Hourly Earnings 78
Table 4.1a Labour Force Transitions 1993/94 - Males 116
Table 4. lb Labour Force Transitions 1993/94 - Females 117
Table 4.2a Male One Year Transition Rates (NES) 1993/94 118
Table 4.2b Male One Year Transition Rates (BHPS) 1993/94 119
Table 4.2c Female One Year Transition Rates (NES) 1993/94 120
Table 4.2d Female One Year Transition Rates (BHPS) 1993/94 121
Table 4.3a Male Three Year Transition Rates (NES) 1991/94 122
Table 4.3b Male Three Year Transition Rates (BHPS) 1991/94 123
Table 4.3c Female Three Year Transition Rates (NES) 1991/94 124
Table 4.3d Female Three Year Transition Rates (BHPS) 1991/94 125
Table 4.4a Male Five Year Transition Rates (NES) 1989/94 126
Table 4.4b Female Five Year Transition Rates (NES) 1989/94 127
Table 4.5a Male One Year Transition Rates (NES) 1977/78 128
Table 4.5b Male One Year Transition Rates (NES) 1988/89 129
Table 4.5c Female One Year Transition Rates (NES) 1977/78 130
Table 4.5d Female One Year Transition Rates (NES) 1988/89 131
Table 4.6a Male Five Year Transition Rates (NES) 1984/89 132
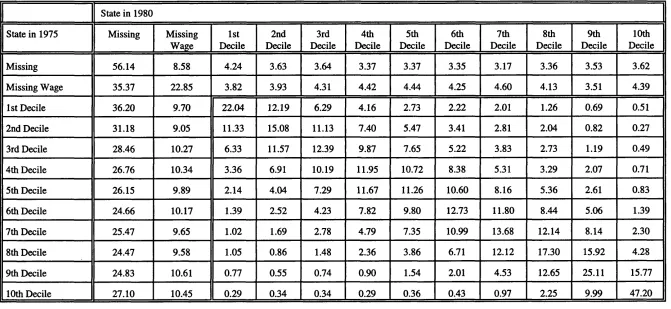
Table 4.6b Male Five Year Transition Rates (NES) 1975/80 133
Table 4.6c Female Five Year Transition Rates (NES) 1984/89 134
Table 4.6d Female Five Year Transition Rates (NES) 1975/80 135
Table 4.7a Male One Year Transition Rates (NES) 1977/78
by Absolute Earnings Bands 136
Table 4.7b Male One Year Transition Rates (NES) 1988/89
by Absolute Earnings Bands 137
Table 4.7c Female One Year Transition Rates (NES) 1977/78
by Absolute Earnings Bands 138
Table 4.7d Female One Year Transition Rates (NES) 1988/89
by Absolute Earnings Bands 139
Table 5.1 Table 5.2 Table 5.3 Table 5.4 Table 6.1 Table 6.2 Table 6.3 Table 6.4 Table 6.5 Table 6.6 Table 6.7 Table 6.8 Table A6.1 Table A6.2 Table A6.3 Table A6.4 Table A6.5 Table A6.6 Table A6.7 Table A6.8 Table A6.9 Table A6.10 Table A6.11
Summary of Wages Council Data 186
Effects of Minimum Wages on the Wage Distribution 187
Employment Equations in 18
Wages Council Industries: 1978-92 188
Dynamic Employment Equations in 18
Wages Council Industries: 1978-92 189
The Effects of the Minimum Wage on the Adult Wage Distribution 207
Descriptive Statistics 208
Maximum Likelihood Estimates of the Employment Parameter (|)
Assuming Log Normal Wage Distribution 209
Kolmogorov-Smimov Test of Estimated Distribution (P-Values)
Assuming Log Normal Wage Distribution 210
Maximum Likelihood Estimates of the Employment Parameter (|)
Assuming Singh-Maddala Wage Distribution 211
Kolmogorov-Smimov Test of Estimated Distribution (P-Values)
Assuming Singh-Maddala Wage Distribution 212
Maximum Likelihood Estimates of the Employment Parameter (|) by Age Group 1990 - Assuming Log Normal Wage Distribution 213 Maximum Likelihood Estimates of the Employment Parameter (|) by Age Group 1990 - Assuming Singh-Maddala Wage Distribution 214 Maximum Likelihood Estimates of Mean of Log Normal
Wage Distribution 238
Maximum Likelihood Estimates of Standard Deviation of Log
Normal Wage Distribution 239
Maximum Likelihood Estimates of Paramter , Singh- Maddala
Wage Distribution 240
Maximum Likelihood Estimates of Paramter 8%, Singh- Maddala
Wage Distribution 241
Maximum Likelihood Estimates of Paramter 63, Singh- Maddala
Wage Distribution 242
Maximum Likelihood Estimates of Employment Parameter (|)
by Age Group, 1987- Assuming Log Normal Wage Distribution 243 Maximum Likelihood Estimates of Employment Parameter (|)
by Age Group, 1988- Assuming Log Normal Wage Distribution 244 Maximum Likelihood Estimates of Employment Parameter (|)
by Age Group, 1989- Assuming Log Normal Wage Distribution 245 Maximum Likelihood Estimates of Employment Parameter (|)
by Age Group, 1987- Assuming Singh-Maddala
Wage Distribution 246
Maximum Likelihood Estimates of Employment Parameter ([) by Age Group, 1988- Assuming Singh-Maddala
Wage Distribution 247
List of Figures
Figure 3.1 Auto-Covariances for Selected Cohorts: 1975-94 79
Figure 3.2 The Life Cycle Profile of Variances and Covariances: 1975-94 80 Figure 3.3 Actual and Predicted Variances for Selected Cohorts: 1975-94 81 Figure 3.4 Permanent and Transitory Effects on the Predicted Variances
for Selected Cohorts: 1975-94 82
Figure 4.1a Proportion of Employees going into Unemployment:
Males 1975-94 144
Figure 4. lb Proportion of Employees going into Unemployment:
Females 1975-94 145
Figure 4.2a Proportion of Employees Remaining in Employment:
Males 1975-94 146
Figure 4.2b Proportion of Employees Remaining in Employment:
Females 1975-94 147
Figure 4.3a Earnings Ranking in 1977 and 1978: Males 148
Figure 4.3b Earnings Ranking in 1988 and 1989: Males 148
Figure 4.4a Earnings Ranking in 1977 and 1978: Females 149
Figure 4.4b Earnings Ranking in 1988 and 1989: Females 149
Figure 4.5 One Year Mobility Index and Inflation:
Males and Females 1976-94 150
Figure 4.6 Alternative One Year Measures of Mobility - Males: 1976-94 151 Figure 4.7 Alternative One Year Measures of Mobility - Females: 1976-94 152 Figure 4.8 TwoYear Averaged Mobility Index and Inflation:
Males and Females 1978-94 153
Figure 4.9a Earnings Ranking in 1975 and 1980: Males 154
Figure 4.9b Earnings Ranking in 1984 and 1989: Males 154
Figure 4.9c Earnings Ranking in 1989 and 1994: Males 155
Figure 4.10a Earnings Ranking in 1975 and 1980: Females 156
Figure 4.10b Earnings Ranking in 1984 and 1989: Females 156
Figure 4.10c Earnings Ranking in 1989 and 1994: Females 157
Figure 4.11 Five Year Mobility Index and the Inflation Rate:
Males and Females 1980-94 158
Figure 4.12 Alternative Five Y ear Measures of Mobility - Males : 1980-94 159 Figure 4.13 Alternative Five Year Measures of Mobility - Females: 1980-94 160
Figure 5.1 The Monopsony Model: The Three Regimes 182
Figure 5.2 The Effect of the Minimum Wage on Employment 183
Figure 5.3 The Toughness of the Wages Councils
-Mean Ratio of Minimum to Average Hourly Earnings: 1975-92 184
Figure 5.4 Changes in Log(Employment) and Changes in Log(Toughness) 185
Figure 6.1a The Meyer-Wise Technique with no Spillover Effects 215
Figure 6. lb The Meyer-Wise Technique with Spillover Effects 215
Figure 6.2a Log Hourly Wage Distribution for Female Retail
Employees in 1990 216
Figure 6.2c Log Hourly Wage Distribution for Female Wholesale
Employees in 1990 217
Figure 6.2d Log Hourly Wage Distribution for Male Wholesale
Employees in 1990 217
Figure A3.1 Auto-Covariances for all Cohorts: 1975-94 225
Figure A3.2 The Life Cycle Profile of Variances and Covariances
Chapter 1 - Introduction
One of the most alarming changes in the UK labour market over the last couple
of decades has been the sharp rise in wage inequality since the late 1970s. After a long
period of relative stability, differentials have risen so that wage inequality is now greater
than it was 100 years ago (Machin, 1996a). Differences between individuals have risen
at all points in the wage distribution, so that the relative position of workers at the bottom
of the distribution has deteriorated markedly. The UK has not been alone in this
experience. A number of other OECD countries have also experienced increases in wage
dispersion, but the UK and the US stand out for the sheer scale of their increases (OECD,
1993, 1996).
This rise in cross sectional wage inequality has been extensively documented and
researched by labour economists. However, little attention has been paid to the important
issue concerning the degree of mobility that individuals face within the wage distribution
from year to year. Cross section data provide only a snapshot of the earnings distribution
at a point in time. The observed wage differences between individuals in a given year may
be reflective of long run permanent differences or short run transitory differences. The
relative size of these components has potentially important welfare implications
concerning the increase in cross sectional inequality. For example, if wage differences are
largely transitory, and there is a high level of movement of workers within the wage
distribution each period, then inequality is in some sense being averaged out amongst
individuals. However, if wage differences are largely permanent, and there is little
movement within the wage distribution, then cross section differences are largely reflective
inequality are likely to be much more serious.
In chapter 2 ,1 provide a review of the literature concerning these important issues.
The first section (2.1), summarises the evidence about the rise in cross sectional wage
inequality in the UK, setting this in an international context. The evidence shows that the
UK and US stand out as the two countries that have experienced massive increases in
inequality. Wage differentials have risen both between and within groups of individuals
with certain characteristics (i.e. education, age, occupation) with the more highly skilled
doing better both in terms of the wage they receive and the employment opportunities
open to them. Possible explanations for this phenomena are skill biased technological
change or increasing competition due to the growth in world trade. However, there is
also evidence that the declining impact of institutions, such as unions and minimum wages,
has contributed to the rise in inequality. There are a number of reasons why the rise in
wage dispersion is important. Firstly, earnings are a major component of household
income. Changes in the distribution of earnings have serious implications for the
distribution of income and the incidence of poverty. Secondly, some economists have
argued that high levels of inequality are bad for economic efficiency and growth.
The next section (2.2) reviews the evidence on the dynamics of individual earnings.
Most of the work in this area has come from the US, however there is a growing literature
from the UK as panel data become more widely available. The evidence from the US
suggests that a significant proportion of earnings differences are permanent. Furthermore,
about half of the rise in wage inequality, since the late 1960s, is explained by a rise in
permanent inequality, with mobility rates within the distribution remaining constant or
falling. Evidence from the UK is also indicative of the existence of significant permanent
bottom of the distribution characterised by individuals cycling between low paid jobs and
non-employment. Unfortunately the existing evidence from the UK has not looked at the
question of whether earnings dynamics have changed over time. This is a question I
address in chapters 3 and 4 of this thesis.
Chapter 3 studies the dynamic structure of individuals’ (males) wages in Great
Britain between 1975 and 1994. The aim of this chapter is to decompose earnings
differences into permanent and transitory components, and to study how these have
changed over time. For this analysis I use the New Earnings Survey panel dataset (NES).
I split the data into year of birth cohorts and study the auto-covariance structure of hourly
earnings for each cohort. This provides the basis for an examination of whether the
covariance structure has changed over time, after controlling for life cycle effects. I find
that the variances and covariances of earnings increase both over the life cycle and over
time. I then go on to fit error component models to the auto-covariances of earnings.
The earnings process is adequately fit by a permanent component, modelled as a random
walk in age, and a highly persistent transitory component, an ARMA(1,1) process. Time
variation is introduced with weights on these components that vary from year to year. I
find that nearly half of the rise in wage inequality can be explained by an increase in the
permanent component, with the rest explained by an increase in the highly persistent
transitory component. A result not dissimilar to that found in the US.
In chapter 4 , 1 go on to study earnings mobility in the NES from 1975-94 for
males and females. I have access to the Joint Unemployment and Vacancy Operating
Statistics (JUVOS) data, which can be matched into the NES in order to look at
individuals’ movement into and out of unemployment. This enables an analysis of both
different points in the distribution. I append this analysis with an investigation of earnings
transitions in the British Household Panel Survey (BHPS) from 1991-1994, and labour
market transitions in the Labour Force Survey (LFS) between 1975 and 1994.
The results from looking at decile (and absolute earnings band) transition matrices
indicate quite low levels of mobility over the space of one year. Mobility rates are higher
when measured over a longer period, but there is still evidence of persistence.
Furthermore, mobility rates appeared to have fallen over the time period of my analysis.
A potential problem with decile transition matrices is that they only pick up movements
across deciles of the wage distribution, but not mobility within the deciles. This problem
may be confounded by the rise in inequality, which means the deciles cover a larger range
of earnings now than at the beginning of the sample. Consequently, I also present a
mobility measure based on each individual’s actual percentile ranking in the distribution.
There is some evidence that this measure may also have fallen over time, a result that has
potentially important welfare consequences.
The second part of this thesis is concerned with the economic effects of minimum
wages in the UK. Interest in the impact of minimum wages on earnings and employment
has intensified with the publication of a number of recent studies (Card, 1992a, 1992b;
Katz and Krueger, 1992; Card and Krueger, 1993; Machin and Manning, 1994; Card and
Krueger, 1994) and a much debated book (Card and Krueger, 1995) that have found zero
or positive effects of minimum wages on employment. This result is contrary to the
conventional view, that arises out of the standard competitive model of the labour market,
that minimum wages unambiguously destroy jobs. Prior to the publication of these studies
a consensus appeared to have been reached that increases in the minimum wage had small
results have re-opened the debate about the economic effects of minimum wages.
Interest in the use of a minimum wage as a pohcy tool to fight low pay and poverty
has increased with the huge rise in wage inequality in the US and the UK, Indeed, after
years of neglect in the early 1980s the US senate increased the Federal minimum wage in
the early 1990s. In addition, there has been a further increase recently and another rise
is scheduled for September 1997. Conversely in the UK, the present Conservative
government removed the only minimum wage fixing machinery in operation, with the
abolition of the Wages Councils in August 1993 (the exception being the Agricultural
Wages Boards). However, both the main opposition parties are committed to the
introduction of a National minimum wage if they gain power at the next election. As a
consequence, the question of the economic effects of the minimum wage has recently
received great attention from both economists and policy makers.
In the third section of the next chapter (2.3), I provide an overview of the recent
evidence on the economic effects of minimum wages in the US and UK. The evidence
from the US confirms that increases in the minimum wage have a positive effect on wages.
With the publication of a survey by Brown at al (1982) a consensus seemed to have been
arrived at that increases in the minimum had small negative effects on employment. The
increases in the Federal and certain States’ minimum wages in the early 1990s provided
a “natural experiment” for studying the impact of the minimum. Most of the studies
conducted in the early 1990s found zero, or even positive, effects on employment. The
early evidence in the UK also found conventional negative effects, but some studies did
find positive effects. However, more recent analysis has found the unconventional
positive effect. The jury is still out on this issue.
the UK. As a theoretical background, I present a model of the labour market in which
firms potentially have some degree of monopsony power. I then proceed to investigate
the effects of the UK Wages Councils using panel data from 1975-1992. I find that
minimum wages increase wages at the bottom of the wage distribution. This has the effect
of compressing the distribution of wages within the Wages Council industries. However,
I can find no evidence that increases in the minimum over this time period had any
negative impact on employment. In fact, the results point towards a weak positive effect.
Most of the analyses of the effects of minimum wages on employment use data
with some variation in the minimum wage, either over time or regions, to identify the
employment effect. However, in an ingenious piece of work, Meyer and Wise (1983a,
1983b) estimate the impact of the minimum on employment using data from a single cross
section. Their basic premise is that in the absence of a minimum wage the distribution can
be modelled with a certain functional form. When the minimum wage is introduced a
number of individuals will lose their jobs, causing a truncation in the wage distribution at
the bottom, and a number will have their wages raised to the minimum, causing a spike
at the minimum. They present a methodology for estimating this truncated distribution
and inferring the employment effect by comparing the predicted size of the truncation with
the actual number of individuals at the minimum. Their results suggest that in 1978 the
US minimum wage reduced employment for 16-24 year olds by at least 7%.
In chapter 6 of this thesis, I present a critique of the Meyer-Wise study, providing
an apphcation of their methodology to British data between 1987 and 1990. I show that
their estimation technique is sensitive to a number of key assumptions. In particular, the
assumed functional form for the distribution of wages in the absence of minimum wages,
conclusions are that, for British data at least, the estimates are not robust and the Meyer-
Wise approach can not be applied safely.
In chapter 7 , 1 provide a brief overview of this thesis, with a summary of each
chapter. The implications of my results on earnings dynamics and minimum wages are
Chapter 2 - A Review of the Literature
The aim of this chapter is to provide a summary of the existing literature that is
important to this thesis. In Section 2 .1 ,1 review the work that has analysed the rise in
cross sectional wage dispersion in the UK, drawing on some international comparisons.
Section 2.2 provides a summary of the earnings dynamics literature and section 2.3 looks
at the recent evidence on the economic effects of minimum wages.
2.1 Cross Sectional Wage Dispersion in the UK
Most of the empirical work on cross sectional wage and income inequality has
originated from the US where dispersion has increased rapidly since the late 1960s.
However, the experience of a sharp rise in inequality in the UK over the last couple of
decades has led to a burgeoning literature documenting this rise. In this section, I provide
a review of the principal papers that have been written on the UK experience and pull out
the key points that have emerged from this literature.
2.1.1 The UK Experience in an International Context
Table 2.1, adapting a table from Machin (1996a) and OECD (1996), provides an
international comparison of wage inequality between 1973 and 1995.^ Data on the ratio
of the 90th to the 10th percentile of the wage distribution are presented for males and
females for eleven OECD countries. We can see that in the 1970s the wage distribution
remained stable in most countries with the exception of the US, where inequality has been
rising since the late 1960s. The 1980s saw an increase in inequality in a number of
countries but by far the greatest increases occurred in the US and the UK. Indeed, the rise
in UK wage dispersion in the 1980s was even faster than that in the US. Despite this, the
level of inequality in the US remains much higher than in the UK. In many countries
inequality was unchanged and in some (notably Germany, France and Italy) it actually fell.
The first half of the 1990s has seen a continuation of this trend, with the UK standing out
from the other countries, experiencing a continued increase in wage dispersion (See
OECD, 1996). Of particular interest is the fact that hourly wage inequality (as measured
by the 90/10 ratio) has stopped rising in the US in the early 1990s. However, if one looks
at weekly earnings data there is still a rise in inequality over this period.
Although the US and UK have both experienced rapid increases in wage inequahty
over the last couple of decades, their experiences in terms of real wage growth differ. In
the US real wages have fallen sharply at the bottom of the distribution, with real wages
for the 10th percentile male falling by 10% between 1985 and 1995 (OECD, 1996).
Indeed, wages have fallen for the bottom 80% of males between 1989 and 1995 (Baker
and Mishel, 1995). This is in contrast to the experience in the UK where real wages have
risen at the bottom of the distribution, albeit at a slower rate than at the middle and the
top. Actually, there is some contention over what has happened to the wages of the low
paid in the UK. The New Earnings Survey provides evidence that real wages for males
at the 10th percentile rose by about 10% over the 1980s. However, Goshng, Machin and
other available survey with a consistent hourly earnings series through the 1980s) that real
wages have remained static for the 10th percentile male. The difference may arise due to
the undersampling of low paid workers in the NES. Nevertheless, it is clear that wages
haven’t fallen sharply at the bottom as they have in the US.
Unsurprisingly, the countries with the highest level of inequality also have a high
incidence of low pay (as measured by the proportion earning below 50% or 66% of the
median). The US has some 25% of full time employees earning below 66% of the median
wage, compared to 20% for the UK (OECD, 1996). However, the UK has one of the
highest incidences of low pay in Europe (Gregory and Sandoval, 1994).
2.1.2 The UK Experience in More Detail
The experience in the UK of sharply rising wage inequality is perhaps even more
striking when one looks at this from a historical perspective. Table 2.2 (also taken from
Machin, 1996a) presents time series data on wage dispersion for male manual workers in
the UK from 1886 to 1990. This is the only consistent data series available back to the
last century. It is evident that throughout most of this century their has been a striking
level of stability in the level of wage dispersion as measured by the ratios of the 10th
percentile to the median and the 90th percentile to the median. However, since the late
1970s wage dispersion has increased rapidly so that it is now higher than at any other time
this century.
A number of papers have decomposed the rise in wage inequality into differences
arising between and within groups of individuals with certain characteristics, such as
for different countries from the late 1960s to the early 1990s. In many countries,
including the UK, the education premium fell during the 1970s. However, in the 1980s
the premium rose sharply in the UK and US, the two countries with the fastest growth in
inequality.
Schmitt (1995) uses the UK General Household Survey between 1974 and 1988
to look at returns to different human capital variables. He estimates Mincer type wage
equations for each yearly cross section and looks at the changing returns on different
characteristics. This methodology allows him to study changing returns on one variable
while controlling for other characteristics. Returns to education fell between the early
1970s and the late 1970s. However, by the late 1980s they had increased again, albeit not
up to the level of the early 1970s. This rise in education returns occurred despite an
increase in the relative supply of more highly educated workers. Similarly, the wage
returns to potential labour market experience fell in the 1970s but rose strongly in the
1980s, surpassing their early 1970s level.
Berman and Machin (1995) study wage differentials by occupation groups for the
US and UK. They find that the non-manual/manual wage differential displayed a similar
pattern to the education differential, falling in the 1970s but rising quite sharply in the
1980s. Once again, this is despite an increase in the relative employment of non-manual
labour throughout the 1970s and 1980s (See Machin, 1996b).
Wage differentials between age groups have also changed over the 1970s and
1980s. Davis (1992) reports an increasing wage premium for older workers over younger
workers in both the US and UK. Gosling, Machin and Meghir (1996a, 1996b) also report
increasing relative wages for older workers. The early rise in the wage premium could be
labour market. However, since the mid-1980s the increased supply of younger workers
stopped but the wage premium for older workers continued to rise.
The evidence for the UK tells us that wage differentials have risen between
individuals with different levels of education, skill (as measured by occupation) and
experience or age. This has occurred despite an increasing supply of more highly
educated and skilled workers. It seems likely that there has been an increase in the relative
demand for such workers that has not been sufficiently matched by supply, resulting in
higher wage premiums. More highly educated and skilled workers have done relatively
better both in terms of the wages they receive and the employment opportunities open to
them.
In addition to these clear rises in between group wage differentials there has also
been an equally, if not more, important increase in within group dispersion. Machin
(1996a), using Family Expenditure Survey data, reports increasing within group standard
deviations in the 1980s by education, occupation, public/private sector and age groups.
The increase is particularly large for the lower education group. He also reports an
increasing dispersion of the residuals from yearly cross section regressions on age and
schooling, indicating that a large degree of the rise in dispersion has occurred within these
groups. In fact, Schmitt (1995) finds that in addition to the changes in labour market
returns between education and experience groups, about 60% of the rise in wage
inequality has occurred within these groups between 1974 and 1988.
2.1.3 Possible Explanations for the Rise in Inequality
dispersion is that it is reflective of an increase in demand for unobserved skill or ability.
We have seen that there has been an increase in the return to being more highly educated,
skilled and experienced, driven by an increase in demand for these qualities. It seems
plausible that there would also be a rise in demand for the unmeasured part of an
I
individuals ability. This is not an unreasonable proposition since it is likely that an
i
individuals measured skill attributes are correlated with their unmeasured skill attributes.
Given that ability differs within groups of individuals, say amongst university graduates,
then we would see a rise in dispersion within these groups.
Another possible explanation put forward by Gosling et al (1996a, 1996b) is that
the distribution of pre-labour market skills of new cohorts entering the labour market is
becoming wider. In an earlier paper. Gosling, Machin and Meghir (1994), they argue that
although the age profile of wages has risen, that this is attributable to cohort differences
rather than any increases in the return to experience. In fact they only find experience
effects on wages for more educated workers. They also show that the distribution of
earnings is larger for younger cohorts entering the labour market. Possible reasons given
for this are the successive education reforms that have been introduced in the UK and
changes in the quality and distribution of education. One depressing conclusion from their
work is that despite the existence of a cross sectional correlation between wages and
experience, there is nothing to suggest that the wages of poorly educated young cohorts
will rise as they become older and gain experience.
There are two main explanations put forward for the rise in relative demand for
more highly skilled workers. These are increased competition in low skill industries due
to the growth in world trade and increasing technological change biased towards more
hypothesis rather than the trade argument. Berman, Bound and Grilliches (1994) and
Machin (1996b) study the skill composition of employment in US and UK manufacturing
respectively. If the trade argument were dominant we would expect to see falls in
employment in the low skilled industries most affected by foreign competition. However,
most of the change in the composition of employment has occurred within industries
rather than between industries. In addition, they find that larger changes in the skill
composition have occurred in the industries with higher levels of Research &
Development, suggesting a link between technology changes and the demand for more
skilled workers. This result is backed up by Machin, Ryan and Van Reenen (1996)
looking at a panel of manufacturing industries in the UK, the US, Denmark and Sweden
between 1973 and 1989.
The changing role of labour market institutions has also been considered as a
potential cause of the rise in wage inequality. Gosling and Machin (1995) study the role
of falling unionisation on the distribution of wages in the UK. They estimate that around
20% of the rise in inequality can be attributed to the declining importance of unions.
Similarly, Bell and Pitt (1996) find that 20% of the rise in the variance of log earnings can
be explained by declining union density. Machin and Manning (1994) consider the impact
of the declining value of the minimum wage on the wage structure in the Wages Council
industries. Their estimates suggest that the erosion of the minimum has increased
inequality in these low paying industries by somewhere between 9% and 20%.
2.1.4 Is the Rise in Wage Inequality Important
important. Firstly, labour earnings are the major component of household income and,
as such, changes in the distribution of earnings have serious implications for the
distribution of income and poverty. Gregg and Machin (1994) consider the common
presumption that everybody in society gains from economic growth. They find that the
relationship between inequality (and poverty) and aggregate variables such as gross
domestic product and unemployment breaks down in the mid-1980s. They interpret this
as evidence that the trickle down process stopped in the 1980s with the huge growth in
inequality.
Some theorists have also argued that higher inequality may lead to a loss of
efficiency and lower economic growth. Persson and Tabellini (1994) develop a theoretical
model whereby investment is stifled by higher levels of inequality, leading to lower
growth. Murphy, Schleifer and Vishny (1989) have also argued that higher inequality
suppresses demand and is therefore bad for economic growth. Indeed, aggregate cross
country regressions do display a negative correlation between growth and inequality. One
should note that the direction of causation in these correlations is not clear and so should
be viewed with some caution.
The importance of the rise in cross sectional wage inequality will also depend on
whether it is reflective of a rise in permanent or transitory differences between individuals.
If there is a large degree of movement within the wage distribution each year and the rise
in inequality is due to a rise in transitory differences then this may be considered less
serious. The fact that differences between individuals with relatively permanent
characteristics, such as education, have risen suggests that the rise is at least partly
reflective of permanent differences. However, we also saw that most of the rise in
be reflecting increasing transitory differences. In the next section I provide an overview
of the existing earnings dynamics literature.
2.2 The Dynamics of Individual Earnings
2.2.1 Evidence from the US
The existing literature on the dynamics of individual wages is predominantly from
US data (See Atkinson, Bourgingon and Morrisson (1992) for a survey of the literature
on earnings dynamics). Early work concentrated on fitting statistical models to the
earnings process. Lillard and Willis (1978) fit an error components model to male
earnings from the Panel Study of Income Dynamics (PSID) and find a substantial
permanent element, predicting a low degree of mobility. Similarly, Lillard and Weiss
(1979) estimate error components models for American scientists for 1960-70,
incorporating some time variation with a random growth rate term.
MaCurdy (1982) estimates models of weekly and hourly earnings growth for prime
age males from 1967 to 1976, also using the PSID. He finds that a stationary MA(2)
process adequately describes the path of wage growth. This is consistent with the
presence of a permanent effect in wage levels, since differencing will eliminate any fixed
effect or random walk component. Abowd and Card (1989) fit models of the covariance
structure of earnings and hours changes for three different US datasets; the PSID from
1969 to 1979, the National Longitudinal Survey of men aged 45-59 from 1966 to 1975
and data from the Seattle and Denver Income Maintenance Experiment between 1971 and
bivariate MA(2) process that is compatible with the presence of a permanent effect,
possibly a random walk, in earnings levels. Both these studies are consistent with the
presence of an permanent individual component of earnings and a serially correlated
transitory effect. However, neither of them estimate the relative importance of these
components and, perhaps more significantly, neither model the changing structure of these
over time.
More recently, Gottshalk and Moffitr( 1994,1995) have produced two pieces of
work studying permanent and transitory components of annual earnings using the PSID.
In the first, Gottschalk and Moffilt(1994), they take white male household heads aged 20
to 59 from 1970 to 1987. They split their sample into two nine year periods, 1970-78 and
1979-87, and for each individual compute average earnings in each of these periods. This
they take as their measure of permanent earnings for each period. (They actually use
residuals from a regression of log earnings on a quartic in age to remove the effects of
systematic life cycle growth on earnings). Transitory earnings are then computed as
yearly deviations from the period specific permanent earnings. They then compute the
variance of these components and see how they have changed over the period of analysis.
The variance of permanent earnings in the first period constitutes two thirds of the total
variance in annual earnings. In addition, both the permanent and transitory components
have risen by around 42% between the periods, indicating that two thirds of the rise in
earnings dispersion is permanent. They also find that earnings are much more transitory
for the poorly educated, the young and those at the bottom of the earnings distribution.
The rise in the transitory variance has also been more marked for these individuals.
In a later piece of work, Gottschalk and Moffitf(1995) again use the PSID to
aged 22 to 59 and study how these have changed over time. Splitting their data into ten
year birth cohorts they model the permanent component of earnings as an individual effect
(a random walk in age) and the transitory component as a low order serially correlated
effect (an ARMA(1,1)). They split their data into cohorts in an attempt to separate out
the changes in permanent earnings that arise from life cycle effects from those that arise
due to calendar time effects. Hence, they also allow the parameters of their error
components model to vary over time. The random walk in age implies that permanent
differences between individuals of the same age cohort increase as the cohort grows older.
They find that the parameters do increase over time so that the permanent component of
earnings explains about 40% of the rise in inequality between 1967 and 1987, the rest
being explained by a rise in transitory inequality.
Gottschalk and Moffitt (1995) also look at mobility rates using quintile transition
matrices of the earnings distribution. They find that long run mobility fell in the 1970s,
as a result of the rise in the permanent variance of earnings, and short run mobility fell in
the 1980s, due to the rise in the serially correlated transitory component of earnings. The
mobility declines appear to occur in the bottom and top quintiles of the earnings
distribution.
In both papers they argue that the literature on earnings inequality has overlooked
an important aspect, namely the rise in the instability of earnings. They question the
hypothesis that rising inequality is being driven by a rise in the return to unobserved
ability. If one thinks of unobserved ability as being a relatively permanent attribute then
one would expect this to be reflected in a rise in permanent earnings. The fact that they
also find significant increases in transitory dispersion leads them to question this
differences are a rise in job shopping and part time work or the decline in union power.
Gittleman and Joyce (1994) use matched cross sections from the Current
Population Survey from 1967-91 to estimate patterns of earnings mobility in the US.^
They find differences across demographic groups in terms of mobility. In particular, the
less educated and blacks appear to have less stable earnings. Looking at changes over
time, they find little evidence of a changing short run mobility structure.
Buchinsky and Hunt (1996) analyse wage mobihty using the National Longitudinal
Survey of Youth from 1979 to 1991. This data follows a sample of individuals aged
between 14 and 24 in 1979. They use summary inequality measures and study how these
change when individuals earnings are averaged over time periods of more than one year.
Their results suggest that when dispersion is computed for four year averages of earnings,
inequality is reduced by 12-26% in comparison to the one year cross section figure. This
is due to the mobility of individuals in the wage distribution each year. Nevertheless, they
also report falling mobility over the sample period, as measured by decile transition
matrices. This implies that the rise in dispersion of permanent earnings is greater than that
of transitory earnings. Consequently, lifetime inequality is actually rising faster than cross
sectional inequality.
The evidence from the US suggests a strong permanent component to earnings
that increases with age. In addition, the rise in earnings inequality appears to be driven
by substantial increases in both permanent and transitory differences in earnings. As a
consequence, mobility rates within the distribution are fairly stable or may be falling. This
is very worrying from a welfare point of view. The increasing cross sectional differences
between individuals appear to be reflective of largely permanent differences.
2.2.2 The UK Evidence
The quantity of work on earnings dynamics in the UK has been rather sparse to
date. However, with the availability of new panel datasets, research in this area is
growing. The early work that was carried out on UK data established a high degree of
correlation between individuals’ earnings in different time periods (See Greedy and Hart,
1979; Hart, 1976; Department of Employment, 1977; Atkinson et al (1992) provide a
summary of this work). This correlation declines at longer lags but is still indicative of a
strong permanent component of earnings. For example, the Department of Employment
study reports a correlation coefficient of 0.65 between weekly earnings of manual males
in 1970 and 1971. This declines to 0.52 when comparing 1970 with 1974.
More recently, Gregory and Elias (1994) use the New Earnings Survey Panel to
study transition rates out of the bottom earnings quintile. They find that young males in
the bottom quintile in 1976 face a low probability of remaining there by 1984 and 1991.
For example, only 8% of males under the age of 25 in the bottom decile in 1976 remain
there in 1991. However, exit rates are much lower for older males. Some 35% of low
paid males over the age of 35 in 1976 remain low paid in 1991. For females, exit from
low pay is much more difficult for all age groups; 30% of low paid females under 25 in
1976 remain low paid in 1991. This rises to 34% for females over the age of 35 in 1976.
Gregory and Elias conclude that the experience of low pay is closely linked to life cycle
should note that when looking at transitions Gregory and Elias only look at individuals in
the panel in both periods, since their data cannot measure transitions into and out of
employment. This is a potential problem if transitions rates into and out of employment
are different for individuals at different points in the wage distribution.
Stewart and Swaffield (1996, 1997) use the British Household Panel Survey
(BHPS) to study transitions into and out of various low pay thresholds. They report a
high degree of persistence of low pay for certain individuals. For example, they find that
44% of low paid males in 1991 remain low paid in 1992. However, of those low paid in
both 1991 and 1992,75% remain low paid in 1993. (Low pay is here defined as one half
the median hourly wage.) They also emphasise that the low paid are more likely to move
into non-employment than those further up the distribution. As a consequence, restricting
attention to those in employment will overstate the probability of moving up the
distribution. Those entering employment are more likely to do so into low paid jobs and
those who had previously been low paid are more likely to be low paid again when they
move back into employment. This, they say, is evidence of a cycle for some individuals
of non-employment and low paid jobs.
Sloane and Theodossiou (1996) also use the British Household Panel Survey to
study transitions out of low pay between 1991 and 1993. Defining the low paid as those
in the bottom third of the earnings distribution, they find that 56% of the low paid in 1991
remain low paid in 1993. Some 15% of the low paid have progressed into higher paying
jobs, while 29% have moved into other labour market states. Unsurprisingly, they find
that women are more likely to be low paid and also find it harder to escape low pay. They
also find important life cycle effects in the progression out of low pay.
1997) uses National Insurance Contributions data to look at long run earnings mobility
between 1978/79 and 1993/94, taking a cohort of males aged between 25 and 44 in
January 1978. They have information on annual earnings and employment/benefit status
in 1978/79 and 1993/94. Their results paint a picture of a high degree of persistence in
terms of earnings and dependency on benefits. Taking those aged 25 to 34 in 1978, of
those in the bottom decile in 1978/79 only 13% are in the bottom decile in 1993/94.
However, 28% have moved onto either a full or partial years benefit and 8% have moved
into self employment. Of those that do move up the distribution, only about 35% get
beyond the median. It seems likely that much of this progression is related to the normal
life cycle increase in earnings. When they look at the 35 to 44 year olds they find more
persistence with 19% remaining in the bottom decile and 41% moving onto benefits. Of
these older males that have moved up the distribution, only 22% have moved above the
median. Also striking in their analysis is the numbers of individuals who remain on
benefits. Some 64% of the 25 to 34 year olds on benefit in 1978/79 are on benefit in
1993/94. This rises to a startling 78% for the older males. Their analysis seems to
confirm the pattern of individuals caught in a trap of low paid jobs and non-employment.
A drawback with much of the UK analysis is that it has not addressed the question
of whether there have been changes in the dynamics of the earnings process. However,
in an ingenious piece of work, Blundell and Preston (1995a, 1995b) develop an
intertemporal model of consumption expenditure. They show that permanent and
transitory income inequality can be identified from individual level cross section data on
consumption and income. The results of their analysis of Family Expenditure Survey Data
from 1970-92 suggest a steady increase in permanent inequality over this period coupled
Jarvis and Jenkins (1996) also study household income mobility using the BHPS
from 1991 to 1994. They find evidence of considerable income mobility over the space
of a year, but that very few households experience long range mobility. So, although only
40% of households remain in the same decile from one year to the next, over 70% remain
in the same or neighbouring decile. Interestingly, they find more income mobility than
earnings mobility, a result at odds with the view that the benefit system dampens transitory
changes in income. Looking at transitions out of low income (defined as half average
income in 1991) they find considerable movement out of this state from one year to the
next, with 50% moving up the income distribution. However, 30% of those that do
escape experience low income again within another year. They also find that a small
group of households are persistently in a state of low income in all years.
2.2.3 Recent Evidence from other Countries
There are also a number of studies of earnings dynamics from other countries. The
OECD (1996) provide an analysis of earnings mobility between 1986 and 1991 in eight
OECD countries; the US, the UK, Germany, France, Italy, Denmark, Finland and Sweden.
Table 2.3 presents some of the summary measures of mobility from this study. It appears
that there are similar levels of mobility in these countries both in terms of the number of
individuals moving quintiles between 1986 and 1991 and the correlation between earnings
in the two periods. This suggests that the differences in cross sectional earnings mobility
across these countries is probably reflective of the differences in lifetime earnings
inequality.
share of workers who are low paid (in the bottom quintile) in 1986 who remain low paid
in 1991 varied from 27% in Germany to 44% in Italy. A considerable proportion of the
low paid in 1986 have left full time employment by 1991. There is clearly a potential
problem with these cross country comparisons arising from the fact that the range of the
quintiles will differ widely across these countries since the distribution of earnings is so
different. They attempt to remedy this by looking at absolute threshold points for
earnings. For example, when they define low pay as 65% of the median, they find
transitions out of low pay vary much more widely; from 6% in Denmark to 34% in the UK
and US. They also report some evidence that those countries with higher levels of cross
sectional earnings inequality have lower levels of upward mobility of low paid workers.
Bingley, Bjom and Westegard-Nielsen (1995) study wage mobility in Denmark
from 1980 to 1990, a period when the wage distribution was very stable. They report that
some 44% of males in the bottom decile in 1985 remain there one year later, with 40%
moving up the distribution and the rest leaving employment for other states. 71% of
males in the top decile in 1985 retain their position and of those that do move down the
wage distribution, 62% fall only to the next decile. Mobility is longer over four years with
just over 20% of males in the bottom decile in 1980 remaining there in 1984. However,
a further 20% of these have left the sample or gone into non-employment. They estimate
an econometric model of the determinants of wage mobility. Their results suggest that
mobility is associated with the normal life cycle growth in earnings. Spells of
unemployment reduce upward wage mobility as do changes in industry and occupation,
although there is clearly a potential for endogeneity bias here.
Bigard, Guillotin, Lucifora and Rappelli (1996) (See also Lucifora, 1997) compare
Records. They employ a decile transition approach to study mobility between 1974 and
1988. They report a higher level of mobility in France than Italy and find more immobility
at higher points in the wage distribution. They also find that mobility is related to the
normal life cycle progression of individuals in the wage distribution and that mobility is
reduced in periods of lower unemployment.
2.3 The Economic Effects of Minimum Wages
Minimum wages were introduced in the UK in 1909 with the formation of the
Wages Councils, which set minimum rates of pay in a number of low paying industries.
Wages Councils were initially set up in small manufacturing industries but coverage
increased to a peak in the mid 1960s, encompassing the growing service sector. However,
with the growth of collective bargaining the influence of the Wages Councils diminished
and they were abolished in 1993 by a Conservative Government opposed to any form of
wage fixing. The UK has never had a National Minimum wage but both the Labour and
Liberal Parties are committed to introducing one if they win the next election. In the US,
minimum wages were introduced in Massachusetts in 1912 to protect the pay of women
and minors in a number of industries. A number of other states followed suit but these
were challenged and declared unconstitutional. However, this ruling was overturned and
under the Fair Labor Standards Act of 1938 a Federal minimum wage was introduced.
Ever since the advent of minimum wages economists have debated their relative
merits and drawbacks. Minimum wages are designed to protect the low paid by
providing a subsistence level of pay, however many economists argue that they destroy
question has motivated many studies into the impact of minimum pay rates on wages and
employment. Much of this work has come from the US and has taken the form of time
series studies on employment and unemployment.
2.3.1 The Effects of Minimum Wages in the US
Brown, Gilroy and Cohen (1982) provide a comprehensive survey of the
theoretical and empirical literature on the impact of minimum wages in the US. The
standard competitive model of the labour market predicts that minimum wages reduce
employment by pricing workers out of jobs. This viewpoint seems to be borne out by the
work reviewed by Brown et al (1982). Most of the studies looked at the effect of
variations in the minimum over time on teenage (16-19 years) employment rates. Some
of the studies have looked at the impact on young adults (20-24 years) and a number have
looked at all adults. They find that minimum wages raise the wage of covered workers
up to the minimum and has some knock on effects further up the distribution of wages.
They conclude that the weight of evidence points to a fairly small negative impact on
teenage employment; a 10% increase in the minimum wage reducing employment by 1-
3%. For young adults the effects are still negative but smaller in absolute terms, while for
all adults the impact is uncertain, although this conclusion is based on a smaller number
of studies.
Brown et al (1982) also review the cross section studies of the impact of minimum
wages. These generally take the form of cross state studies that attempt to identify the
employment effect from the different level of minimum and average wages across states.
is an issue with these studies about whether they are correctly identifying minimum wage
effects rather than average wage effects.
However, Meyer and Wise (1983a, 1983b) propose an ingenious methodology for
inferring employment effects of the minimum from data on a single cross section of
wages. Using individual data they estimate a parametric distribution for wages from the
top part of the wage distribution, that is from those individuals unaffected by the
minimum. They then predict how many individuals should be in the bottom part of the
distribution and compare this to the actual number present. This gives them their
measured employment effect. They find that in 1978 the minimum reduced employment
of 16-24 year olds by at least 7%. Although this seems an ingenious idea there are a
number of serious flaws in their study. Dickens, Machin and Manning (1994) (and
Chapter 6 of this thesis) criticises their study by showing how the estimated employment
effects are highly sensitive to certain key assumptions.
With the publication of Brown et al (1982) a consensus seemed to have been
reached that minimum wages in the US had small negative effects on employment at the
levels they had conventionally been set at. However, beginning in the late 1980s, after a
couple of decades of neglect, there were a number of sharp increases in minimum wages
at both a State and Federal level. In 1988, the Californian State minimum was raised from
$3.35/hour to $4.25/hour, a 27% increase in the minimum. In April 1990 the Federal
minimum, which had been fixed at $3.35/hour since January 1981, was increased to
$3.80/hour. In April 1991, it was increased further to $4.25/hour. A year later the New
Jersey minimum was increased from $4.25/hour to $5.05/hour. These relatively large
increases provided an opportunity for economists to study the employment effects in what
work was carried out by David Card, Larry Katz and Alan Krueger and is collected in the
book by Card and Krueger (1995). The results of these studies cast doubt on the
conventional view that minimum wages destroy jobs and have re-opened the arguments
about the economic effects of minimum wages which are still raging today.
The first of these studies Card (1992a), (See also Card and Krueger, 1995)
analysed the impact of the July 1988 increase in the Californian minimum wage. He
estimates that the increase in the minimum raised the average wages of teenagers in
California by 10% and the average wage in the Retail sector by 5%. Comparing
employment levels in California with the rest of the US, he finds no adverse employment
effects. Surprisingly, he finds a small positive effect on teenage employment and a similar
trend in Retail employment as in comparable neighbouring States.
Card (1992b) and Card and Krueger (1995) provide a comparison of the impact
of the 1990 and 1991 increases in the Federal minimum on cross State changes in wages
and employment. They take advantage of the fact that wage rates vary a great deal across
States and consequently the importance of a Federal minimum varies from State to State.
In low wage States the proportion of workers effected by the increase in the minimum will
be far higher than in high wage States. One would expect to see more severe employment
consequences fi'om the increase in the minimum in these low wage States. Their results
indicate that teenage wages rose more in States with a higher proportion of effected
workers. However, they found no evidence that teenage employment rates were lowered
more in the highly affected States. They also use data from the retail sector and again find
no adverse employment effects across States. In fact, they report that retail sector
employment increased more rapidly in States where the Federal increase in the minimum
Katz and Krueger (1992) analyse the effect of the April 1991 Federal minimum
wage increase on the fast food industry in Texas. They carried out a telephone survey of
Burger King, Wendy’s and Kentucky Fried Chicken restaurants in both December 1990
and July-August 1991 collecting information on starting wages and employment by
establishment. They found that those firms that had to raise wages the most to comply
with the new minimum were more likely to increase employment. Defining a variable
called the wage gap as the proportional increase in the starting wage required to comply
with the minimum they find this is positively correlated with changes in employment. A
finding that is at odds with the predictions from the standard competitive model of the
labour market.
Perhaps the most important and controversial piece of new work on the effects of
minimum wages is that by Card and Krueger (1994, 1995) looking at the impact of the
State increase in the New Jersey minimum in April 1992. They carried out a telephone
survey of fast food restaurants in New Jersey in February-March 1992 and then 10 months
later in November-December 1992. They also surveyed restaurants in Pennsylvania,
where the minimum was unchanged, to act as a control group. Their results show that
employment actually increased in New Jersey as compared to Pennsylvania between the
two surveys. In addition, employment in those New Jersey establishments that had to
raise their wages the most to comply with the new law rose relative to those unaffected
by the minimum. This result is similar to that found in the Texas study and is contrary to
the conventional thinking about the economic effects of minimum wages.
Card and Krueger (1995) also carry out a re-evaluation of the time series studies
of the impact of the minimum wage on teenage employment. Most of the time series