O R I G I N A L R E S E A R C H
ICAM1 Regulates the Development of Gastric
Cancer and May Be a Potential Biomarker for the
Early Diagnosis and Prognosis of Gastric Cancer
This article was published in the following Dove Press journal: Cancer Management and Research
Songda Chen1 Shan Pan1 Huijie Wu 1 Jingyuan Zhou1 Yueli Huang1 Shuai Wang2 Aiqun Liu1
1Department of Endoscopy, Guangxi Medical University Cancer Hospital, Nanning, Guangxi, People’s Republic of China;2Department of Colorectal Anal Surgery, Guangxi Medical University Cancer Hospital, Nanning, Guangxi, People’s Republic of China
Background:Gastric cancer (GC) is among the most common forms of cancer affecting the
digestive system. This study sought to identify hub genes regulating early GC (EGC) in order to explore their potential for early diagnosis and prognosis of patients.
Methods: We utilized a publically available dataset from the Gene Expression Omnibus
database (GSE55696). Differences between EGC and LGIN with respect to gene expression were compared using the limma software. Identified differentially expressed genes (DEGs) were subjected to gene ontology (GO) and pathway enrichment analyses with the DAVID application, and the STRING website and Cytoscape software were used to construct a protein-protein interaction (PPI) network incorporating these DEGs. This network was in turn used to identify hub genes among selected DEGs, which were analyzed with the Kaplan-Meier Plotter database. In addition, Western blotting, qRT-PCR, immunohistochemistry, and UALCAN were all employed to validate the relationship between the expression of these genes and GC patient prognosis.
Results:A total of 482 DEGs were identified, with GO analyses indicating an increase in the
expression of genes linked with the development of cancer. Pathway analyses also indicated that these genes play a role in certain cancer-related pathways. The PPI network highlighted four potential hub genes, of which only ICAM1 was linked to a poor GC patient prognosis. This link between ICAM1 and GC patient outcomes was confirmed via UALCAN, Western blotting, immunohistochemistry, and qRT-PCR.
Conclusion: ICAM1 may therefore modulate tumor progression in GC, thus potentially
representing a valuable prognostic and diagnostic biomarker of EGC.
Keywords:bioinformatics analysis, gastric cancer, early diagnosis, ICAM1, biomarker
Introduction
Gastric cancer (GC) remains one of the most common forms of digestive system tumors, and the third leading cancer-associated cause of death according to GLOBOCAN2018. Approximately 10,000,000 new GC cases were diagnosed in 2018, with 783,000 people having died of the disease, which occurs twice as often in
men as it does in women.1GC is the third most common form of cancer in China and
the second most prominent cause of cancer-associated mortality.2This mortality often results from a failure to detect early GC (EGC), as current diagnostic strategies
primarily depend upon endoscopic examination, imaging, and serology,3–5with most
analyzed patients already being in the advanced stages of disease when subjected to these analyses. In China, GC has a 5-year survival rate of 35.9%, which is lower than
Correspondence: Aiqun Liu Department of Endoscopy, Guangxi Medical University Cancer Hospital, Nanning, Guangxi, People’s Republic of China
Email liuaiqun_2004@163.com
Cancer Management and Research
Dove
press
open access to scientific and medical research Open Access Full Text Article
Cancer Management and Research downloaded from https://www.dovepress.com/ by 118.70.13.36 on 24-Aug-2020
rates in Japan and South Korea (60.3% and 68.9%, respec-tively). This is largely explained by the much higher rates of EGC diagnosis and detection in Korea and Japan.6,7As such, there is a clear need for the more reliable detection of EGC through the use novel biomarkers of this disease.
A common current strategy for analyzing tumor-associated gene expression depends upon the use of micro-array and bioinformatics analytical approaches. Through
such strategies, Li et al identified CLO4A1 as a potential
biomarker of recurrent GC.8 Yan et al also found
COL1A1, MMP2, FN1, TIMP1, SPARC, COL4A1, and
ITGA5 to all represent potential GC biomarkers.9 These
biomarker identification strategies, however, largely
depend upon comparisons between normal tissue and advanced GC tissue samples, making them of limited utility when guiding EGC diagnosis. The WHO
reclassi-fied gastric cancers in 2010 into low-grade intraepithelial
neoplasia (LGIN), high-grade intraepithelial neoplasia (HGIN), EGC, and GC categories, although controversy
regarding the definition of these different disease states
remains.10For example, researchers in Japan posit that as
HGIN tumors exhibit dysplasia, they are better classified
as instances of EGC.11 Such discrepancies may further
explain the increased rates of EGC detection in Japan. In the present study, to better identify genes associated with the earliest stages of GC differentiation and progression,
we classified HGIN as a form of EGC in line with these
Japanese criteria, and we then compared gene expression between EGC and LGIN in a publically available dataset in an effort to detect differentially expressed genes (DEGs) linked to GC patient outcomes.
For this study, we utilized the available GSE5569612
dataset uploaded in the Gene Expression Omnibus (GEO,
https://www.ncbi.nlm.nih.gov/) database. This dataset incor-porated gene expression results from endoscopic biopsy tis-sue samples from patients diagnosed with LGIN, HGIN, or EGC. After pooling HGIN and EGC data, we used the limma package as a means identifying DEGs between the EGC and LGIN groups. The resultant DEGs were then subjected to gene ontology (GO) and pathway enrichment analyses to better explore their biological roles. We further generated a protein-protein interaction (PPI) network for these genes to highlight central hub genes. We then used the
Kaplan-Meier Plotter (http://kmplot.com/analysis/) database to
assess how these hub genes were linked to GC patient out-comes. We additionally classified the clinical relevance of these hub genes based upon an online database in an effort to
identify potentially novel biomarkers of EGC that may per-mit earlier patient diagnosis and prognostic planning.
Materials and Methods
Microarray Data
GSE55696 data were downloaded from GEO, which com-piles large amounts of publically-available gene expression data, including high-throughput microarray data.13The cho-sen study had employed the GPL6480 Agilent-014850 Whole Human Genome Microarray 4x44K G4112F for their analyses, and included a total of 19 LGIN, 20 HGIN, 19 EGC, and 19 chronic gastritis tissue samples.
DEG Identi
fi
cation
After downloading the GSE55696 series matrix file, we
omitted chronic gastritis samples from further analyses
owing to their unclear definition, and we combined EGC
and HGIN samples prior to comparing this aggregate EGC group to the LGIN group using the limma, impute, and heat map R packages derived from bioconductor (http://bioconductor.org/biocLite.R). In cases where there were multiple probes for a single gene, mean values were used. DEGs were those with P < 0.05 in at-test and a [logFC] > 1.
Functional and Pathway Enrichment
Analyses
GO analyses allow for exploration of the functional roles
of sets of genes,14 while KEGG analyses allow for
exploration of the pathways in which such genes may
function.15We conducted these two forms of analyses on
our identified DEGs using the DAVID (https://david.
ncifcrf.gov/) tool, which allowed for comprehensive
functional annotation.16 Significant enrichment was said
to be evident when P < 0.05.
Hub Gene Identi
fi
cation
The PPI network was constructed based on predicted
interactions in the online STRING database (https://
string-db.org/).17 We uploaded all 482 DEGs in the pre-sent study to yield an initial PPI, and then visualized this network using Cytoscape Version 3.7.1. Next, cytoHubba was used to rate the network, with the top 10 genes rated according to their Degree, Closeness, and Betweenness scores being the candidate hub genes.
Cancer Management and Research downloaded from https://www.dovepress.com/ by 118.70.13.36 on 24-Aug-2020
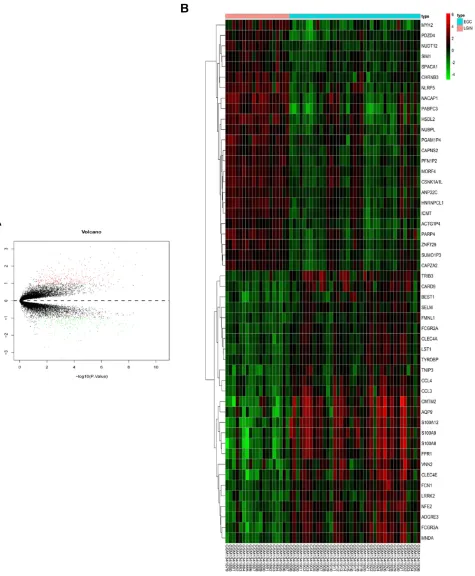
Figure 1DEG selection and hierarchical clustering analysis. (A) DEGs are arranged in a volcano plot, with the vertical and horizontal axes corresponding to logFC (fold change) and -log10 (p value). Green and red dots correspond to DEGs, whereas genes that were not DEGs are represented by black dots. (B) The top 50 DEGs were arranged in a heat map, with genes on the horizontal axis and samples along the vertical axis. DEGs could be divided into cancer and non-cancer groups. Up- and down-regulated DEGs are shown in red and green, respectively.
Cancer Management and Research downloaded from https://www.dovepress.com/ by 118.70.13.36 on 24-Aug-2020
Hub Gene Survival Analyses
To analyze the relevance of identified hub genes to GC
patient survival, we separated patients into hub gene-high
and–low groups based on median expression levels, and
then used the online Kaplan-Meier Plotter database to
compare GC patient outcomes.18 Differences in survival
based on hub gene expression were assessed via Log rank test, with P<0.05 as the significance threshold. Using this
approach we were able to identify those genes associated with a poorer GC prognosis.
ICAM1 Hub Gene Validation in GC Using
UALCAN
To confirm the relevance of the identified hub gene ICAM1
in GC, we employed the online UALCAN (http://ualcan.
path.uab.edu/) tool that allows for comparisons of gene
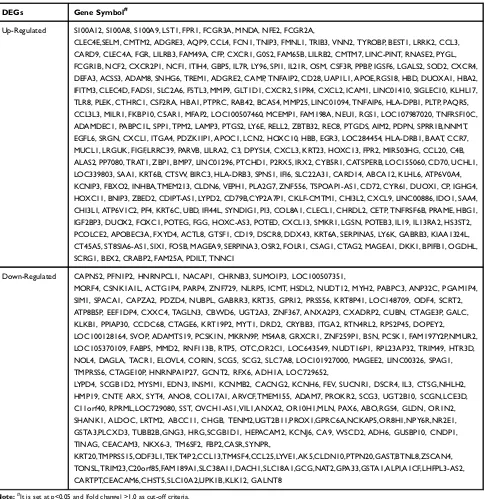
Table 1 A Total of 482 DEGs Were Identified from the GSE55696 Dataset, Including 270 Up-Regulated DEGs and 212
Down-Regulated DEGs in EGC Tissues, Compared to LGIN Tissues
DEGs Gene Symbol#
Up-Regulated S100A12, S100A8, S100A9, LST1, FPR1, FCGR3A, MNDA, NFE2, FCGR2A,
CLEC4E,SELM, CMTM2, ADGRE3, AQP9, CCL4, FCN1, TNIP3, FMNL1, TRIB3, VNN2, TYROBP, BEST1, LRRK2, CCL3, CARD9, CLEC4A, FGR, LILRB3, FAM49A, CFP, CXCR1, G0S2, FAM65B, LILRB2, CMTM7, LINC-PINT, RNASE2, PYGL, FCGR1B, NCF2, CXCR2P1, NCF1, ITIH4, GBP5, IL7R, LY96, SPI1, IL21R, OSM, CSF3R, PPBP, IGSF6, LGALS2, SOD2, CXCR4, DEFA3, ACSS3, ADAM8, SNHG6, TREM1, ADGRE2, CAMP, TNFAIP2, CD28, UAP1L1, APOE,RGS18, HBD, DUOXA1, HBA2, IFITM3, CLEC4D, FADS1, SLC2A6, FSTL3, MMP9, GLT1D1, CXCR2, S1PR4, CXCL2, ICAM1, LINC01410, SIGLEC10, KLHL17, TLR8, PLEK, CTHRC1, CSF2RA, HBA1, PTPRC, RAB42, BCAS4, MMP25, LINC01094, TNFAIP6, HLA-DPB1, PLTP, PAQR5, CCL3L3, MILR1, FKBP10, C5AR1, MFAP2, LOC100507460, MCEMP1, FAM198A, NEU1, RGS1, LOC107987020, TNFRSF10C, ADAMDEC1, PABPC1L, SPP1, TPM2, LAMP3, PTGS2, LY6E, RELL2, ZBTB32, REC8, PTGDS, AIM2, PDPN, SPRR1B,NNMT, EGFL6, SRGN, CXCL1, ITGA4, PDZK1IP1, APOC1, LCN2, HOXC10, HBB, EGR3, LOC284454, HLA-DRB1, BAAT, CCR7, MUCL1, LRGUK, FIGF,LRRC39, PARVB, LILRA2, C3, DPYSL4, CXCL3, KRT23, HOXC13, FPR2, MIR503HG, CCL20, C4B, ALAS2, PP7080, TRAT1, ZBP1, BMP7, LINC01296, PTCHD1, P2RX5, IRX2, CYB5R1, CATSPERB, LOC155060, CD70, UCHL1, LOC339803, SAA1, KRT6B, CTSW, BIRC3, HLA-DRB3, SPNS1, IFI6, SLC22A31, CARD14, ABCA12, KLHL6, ATP6V0A4, KCNIP3, FBXO2, INHBA,TMEM213, CLDN6, VEPH1, PLA2G7, ZNF556, TSPOAP1-AS1, CD72, CYR61, DUOX1, CP, IGHG4, HOXC11, BNIP3, ZBED2, CDIPT-AS1, LYPD2, CD79B,CYP2A7P1, CKLF-CMTM1, CHI3L2, CXCL9, LINC00886, IDO1, SAA4, CHI3L1, ATP6V1C2, PF4, KRT6C, UBD, IFI44L, SYNDIG1, PI3, COL8A1, CLECL1, CHRDL2, CETP, TNFRSF6B, PRAME, HBG1, IGF2BP3, DUOX2, FOXC1, POTEG, FGG, HOXC-AS3, POTED, CXCL13, SMKR1, LGSN, POTEB3, IL19, IL13RA2, HS3ST2, PCOLCE2, APOBEC3A, FXYD4, ACTL8, GTSF1, CD19, DSCR8, DDX43, KRT6A, SERPINA5, LY6K, GABRB3, KIAA1324L, CT45A5, ST8SIA6-AS1, SIX1, FOSB, MAGEA9, SERPINA3, OSR2, FOLR1, CSAG1, CTAG2, MAGEA1, DKK1, BPIFB1, OGDHL, SCRG1, BEX2, CRABP2, FAM25A, PDILT, TNNC1
Down-Regulated CAPNS2, PFN1P2, HNRNPCL1, NACAP1, CHRNB3, SUMO1P3, LOC100507351,
MORF4, CSNK1A1L, ACTG1P4, PARP4, ZNF729, NLRP5, ICMT, HSDL2, NUDT12, MYH2, PABPC3, ANP32C, PGAM1P4, SIM1, SPACA1, CAPZA2, PDZD4, NUBPL, GABRR3, KRT35, GPR12, PRSS56, KRT8P41, LOC148709, ODF4, SCRT2, ATP8B5P, EEF1DP4, CXXC4, TAGLN3, CBWD6, UGT2A3, ZNF367, ANXA2P3, CXADRP2, CUBN, CTAGE3P, GALC, KLKB1, PPIAP30, CCDC68, CTAGE6, KRT19P2, MYT1, DRD2, CRYBB3, ITGA2, RTN4RL2, RPS2P45, DOPEY2, LOC100128164, SVOP, ADAMTS19, PCSK1N, MKRN9P, MS4A8, GRXCR1, ZNF259P1, BSN, PCSK1, FAM197Y2P,NMUR2, LOC105370109, FABP5, MMD2, RNF113B, RTP5, OTC,OR2C1, LOC643549, NUDT16P1, RPL23AP32, TRIM49, HTR3D, NOL4, DAGLA, TACR1, ELOVL4, CORIN, SCG5, SCG2, SLC7A8, LOC101927000, MAGEE2, LINC00326, SPAG1, TMPRSS6, CTAGE10P, HNRNPA1P27, GCNT2, RFX6, ADH1A, LOC729652,
LYPD4, SCGB1D2, MYSM1, EDN3, INSM1, KCNMB2, CACNG2, KCNH6, FEV, SUCNR1, DSCR4, IL3, CTSG,NHLH2, HMP19, CNTF, ARX, SYT4, ANO8, COL17A1, ARVCF,TMEM155, ADAM7, PROKR2, SCG3, UGT2B10, SCGN,LCE3D, C11orf40, RPRML,LOC729080, SST, OVCH1-AS1,VIL1,ANXA2, OR10H1,MLN, PAX6, ABO,RGS4, GLDN, OR1N2, SHANK1, ALDOC, LRTM2, ABCC11, CHGB, TENM2,UGT2B11,PROX1,GPRC6A,NCKAP5,OR8H1,NPY6R,NR2E1, GSTA3,PLCXD3, TUBB2B,GNG3, HRG,SCGB1D1, HEPACAM2, KCNJ6, CA9, WSCD2, ADH6, GUSBP10, CNDP1, TINAG, CEACAM3, NKX6-3, TM6SF2, FBP2,CASR,SYNPR,
KRT20,TMPRSS15,ODF3L1,TEKT4P2,CCL13,TM4SF4,CCL25,LYVE1,AK5,CLDN10,PTPN20,GAST,BTNL8,ZSCAN4, TONSL,TRIM23,C20orf85,FAM189A1,SLC38A11,DACH1,SLC18A1,GCG,NAT2,GPA33,GSTA1,ALPI,A1CF,LHFPL3-AS2, CARTPT,CEACAM6,CHST5,SLC10A2,UPK1B,KLK12, GALNT8
Note:#
It is set at p<0.05 and |fold change| >1.0 as cut-off criteria.
Cancer Management and Research downloaded from https://www.dovepress.com/ by 118.70.13.36 on 24-Aug-2020
expression data and clinical data across 31 forms of cancer.19 Differences in gene expression were compared between groups via t-tests, with P<0.05 as the significance threshold, and we explored how ICAM1 expression related to GC patient clinicalfindings.
qRT-PCR
For qRT-PCR, 30 paired GC and adjacent normal tissue
samples surgically collected from 2013–2014 at Guangxi
Medical University Cancer Hospital were used. RNAiso plus (9108, TaKaRa, USA was used for RNA extraction, followed by use of a cDNA reverse transcription kit (RRO47A; TaKaRa, USA). Primers used were: ICAM1
forward, 5ʹ-CAGGAGCAACTTCTCCTGC-3ʹ; ICAM1
reverse, 5ʹ-ACCGGAATGACAATGTCCAGGATA-3ʹ.20
A SYBR Green kit (RR820; TaKaRa, USA) was used for qRT-PCR on an ABI7500 device. Cycle settings were: 30s at 95°C, then 40 cycles of 15 s at 95°C, and 34 s at 60°C. Triplicate samples were used and averaged, with β-actin as a reference control.
Western Blotting
Tissue samples were homogenized in RIPA buffer (p00136, Beyotime Biotechnology, China) containing PMSF (ST506, Beyotime Biotechnology). Samples were then boiled in load-ing buffer (5×) (P0015L, Beyotime Biotechnology), after which samples were electrophoretically separated on
SDS-PAGE 4–10% Bis-Tris gels prior to transfer to PVDF
mem-branes (IPVH00011, Solarbio, China). Next, 5% skim milk powder was used to block membranes, followed by overnight incubation with rabbit monoclonal anti-ICAM1 (1:1000,
ab53013; Abcam, Cambridge, UK) or anti-β-actin (1:1000,
Sigma, China). Then, a goat anti-rabbit IgG (H + L) antibody (1:1000, A0208, Beyotime Biotechnology) was used to detect primary antibodies, with a ChemiDoc MP system (Bio Rad Laboratories, Inc.) used for chemiluminescent pro-tein visualization.
Immunohistochemistry
Tissue samples from chronic superficial gastritis, LGIN,
HGIN, EGC, and GC patients collected between 2018 and 2019 and held in the Guangxi Medical University Cancer Hospital specimen library were used for IHC experiments. The same ICAM1 antibody used for Western blotting was used for IHC at a 1:50 dilution, with a biotin donkey-anti-rabbit antibody (AP182B) (1:500; Millipore, Billerica, MA, USA) used for secondary detection. The IHC staining pro-cedure was as follows: samples were warmed at 60°C for 4h,
dewaxed with xylene, rehydrated using an ethanol gradient, treated EDTA (50x) for antigen repair, subjected to an endo-genous peroxidase blocker (PV-6000, BAOXIN BIO, China), and then warmed for 10 min to 37°C prior to rinsing using PBS. Samples were then probed overnight with pri-mary antibodies at 4°C, warmed for 15 min to 37°C, rinsed in PBS, stained with secondary antibody for 20 min at 37°C. DAB was used for development of staining, and samples were then counterstained with hematoxylin, differentiated with hydrochloric acid alcohol, dehydrated, dried, and sealed before analysis.
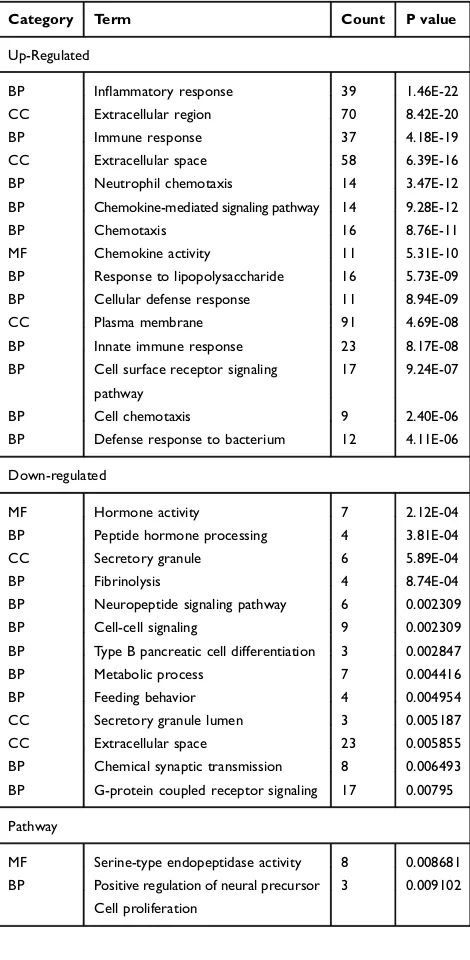
Table 2 The Top 15 Significant Enriched GO Terms of Up/
Down-Regulated DEGs
Category Term Count P value
Up-Regulated
BP Inflammatory response 39 1.46E-22
CC Extracellular region 70 8.42E-20
BP Immune response 37 4.18E-19
CC Extracellular space 58 6.39E-16
BP Neutrophil chemotaxis 14 3.47E-12
BP Chemokine-mediated signaling pathway 14 9.28E-12
BP Chemotaxis 16 8.76E-11
MF Chemokine activity 11 5.31E-10
BP Response to lipopolysaccharide 16 5.73E-09
BP Cellular defense response 11 8.94E-09
CC Plasma membrane 91 4.69E-08
BP Innate immune response 23 8.17E-08
BP Cell surface receptor signaling
pathway
17 9.24E-07
BP Cell chemotaxis 9 2.40E-06
BP Defense response to bacterium 12 4.11E-06
Down-regulated
MF Hormone activity 7 2.12E-04
BP Peptide hormone processing 4 3.81E-04
CC Secretory granule 6 5.89E-04
BP Fibrinolysis 4 8.74E-04
BP Neuropeptide signaling pathway 6 0.002309
BP Cell-cell signaling 9 0.002309
BP Type B pancreatic cell differentiation 3 0.002847
BP Metabolic process 7 0.004416
BP Feeding behavior 4 0.004954
CC Secretory granule lumen 3 0.005187
CC Extracellular space 23 0.005855
BP Chemical synaptic transmission 8 0.006493
BP G-protein coupled receptor signaling 17 0.00795
Pathway
MF Serine-type endopeptidase activity 8 0.008681
BP Positive regulation of neural precursor 3 0.009102
Cell proliferation
Cancer Management and Research downloaded from https://www.dovepress.com/ by 118.70.13.36 on 24-Aug-2020
Results
DEG Identi
fi
cation
In order to screen for meaningful biomarkers in EGC, using the R limma package and the p < 0.05 and [logFC] > 1 cut-off criteria, we detected a total of 482 DEGs when comparing the
EGC and LGIN datasets (Figure 1A). Of these genes, 270
were upregulated and 212 were downregulated (Table 1). We
further generated a heat map of the top 50 DEGs using an appropriate R package (Figure 1B).
GO and KEGG Analyses
In order to clarify the role of these DEGs in the progression of GC, we needed to immediately predict the functional role of these genes. We next conducted GO and KEGG pathway
Figure 2KEGG pathways enriched for DEGs. P-values are represented by the coloration of individual points in the scatterplot, with point size corresponding to the number of counts. (A) KEGG pathways associated with up-regulated DEGs. (B) KEGG pathways associated with down-regulated DEGs. Scatterplots were constructed using the online website (http://www.ehbio.com/ImageGP/index.php/Home/Index/index.html.
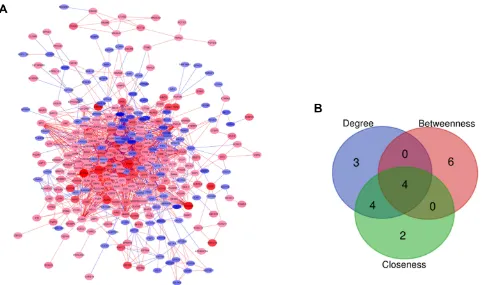
Figure 3PPI network and candidate hub genes. (A) PPI network of identified DEGs. Up- and down-regulated DEGs are represented by red and blue nodes, respectively, with node size corresponding to logFC. Red and blue lines correspond to positive and negative correlations, respectively. (B) Venn diagram of four candidate hub genes from the top ten as determined according to Degree, Betweenness, and Closeness parameters. An online tool was used for Venn diagram construction (http://bioinformatics.psb. ugent.be/cgi-bin/Liste/Venn/calculate_venn.htpl).
Cancer Management and Research downloaded from https://www.dovepress.com/ by 118.70.13.36 on 24-Aug-2020
analyses on these 482 DEGs. GO analyses revealed upregulated DEGs to be enriched for terms including
“inflammatory response”, “extracellular region”, “immune response”, “extracellular space”, and “neutrophil chemo-taxis” (P < 0.05) (Table 2). In contrast, downregulated
DEGs were enriched for terms including “hormone
activ-ity”, “peptide hormone processing”, “secretory granule”,
“fibrinolysis” and “neuropeptide signaling pathway”
(P < 0.05) (Table 2). In the pathway enrichment analyses, upregulated DEGs were shown to be enriched for pathway terms including “cytokine−cytokine receptor interaction”,
“chemokine signaling pathway”, and “staphylococcus
aur-eus infection”(P < 0.05) (Figure 2A), whereas downregu-lated DEGs were enriched for pathway terms including
“chemical carcinogenesis”,“metabolism of xenobiotics by
cytochrome P450”, and “drug metabolism − cytochrome
P450”(P < 0.05) (Figure 2B).
PPI Network Analysis
It is well known that a gene can directly or indirectly affect another gene to exert a biological role. After clarifying the functions of these genes, we were more concerned about genes that play a pivotal role. We next used the STRING and Cytoscape tools to construct and visualize a PPI network for
these DEGs. Thefinal network was made up of 316 nodes and
1816 edges following irrelevant node deletion (Figure 3A), with 166 DEGs not falling within this network. The cytoHubba plugin was next used to rate the entire network, with the top 10 genes based on Degree, Closeness and
Betweenness identified as potential hub genes (Table 3).
Based on the overlap between these three profiles
(Figure 3B), we identified 4 overlapping potential hub genes:
MMP9 (matrix metallopeptidase 9), ICAM1 (intercellular adhesion molecule 1), TLR8 (toll-like receptor 8), and PTPRC (protein tyrosine phosphatase receptor type C).
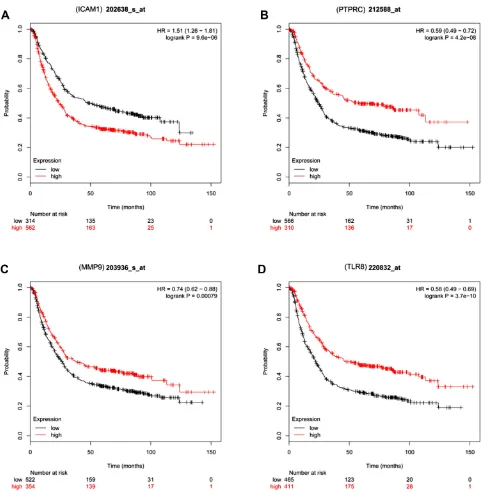
Hub Gene Survival Analyses
However, based on the practicality of clinical guidance, we
needed tofind genes in these hub genes that could promote
gastric cancer and could be used for survival prediction. We next used the Kaplan-Meier Plotter database to explore how these hub genes related to GC patient survival. Of these
genes, we found all 4 to be significantly differentially
expressed (p<0.05), but only elevated ICAM1 expression was linked to a poorer GC patient prognosis (HR=1.51, 95%CI:1.26–1.81, P=9.6e-06) (Figure 4).
The Association Between Elevated
ICAM1 and GC Patient
Clinicopathological Features
Although the application of bioinformatics has given us
directions, we still needed to combine sample verification
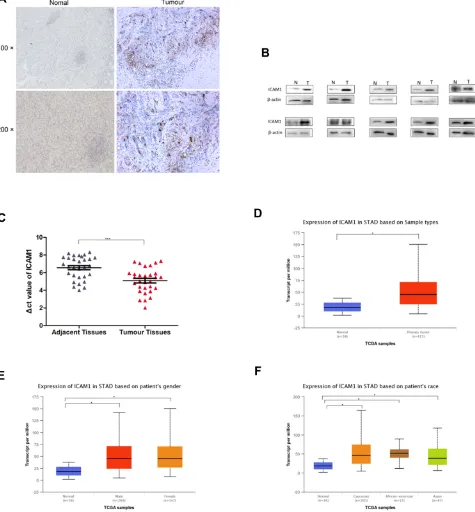
to provide guidance for clinical research. Using IHC, we found ICAM1 expression in GC tissues to be primarily
localized to cell membranes (Figure 5AandB). We further
found ICAM1 to be highly expressed in GC tissue samples (Figure 5BandC), consistent with TCGAfindings (p<0.05;
Figure 5D). To confirm that ICAM1 expression was linked to the clinical features of GC, we next explored this relationship in the online UACLAN database. We found ICAM1 expres-sion to be unrelated to gender (p=7.740800E-1;Figure 5E) or race (p=6.050600E-01, p=4.357800E-01, p=9.113600E-01) (Figure 5F).
Discussion
GC remains one of the most common types of cancer in
China,21and yet owing to its lack of early-stage symptoms
patients are often not diagnosed until the disease is already
significantly advanced, leading to a poor prognosis.22 In
a retrospective analysis of GC patients in Japan, a 5-year survival rate of 71.1% was detected among 118,367 GC patients following surgical resection, with respective 5-year survival rates for those with pathological IA, IB, II, IIIA, IIIB, and IV GC of 91.5%, 83.6%, 70.6%, 53.6%, 34.8%, and 16.4%.23This suggests that the best means of improving GC patient outcomes is by detecting GC while it is in its early stages. By better exploring the molecular mechanisms gov-erning the development of GC, it will be possible to better detect and diagnose EGC. Previous research has highlighted
Table 3The Top Ten Genes in Each of the Three Main Scores
Degree Closness Betweenness
Node Name Score Node Name Score Node Name Score
TLR8 62 TLR8 162 SPP1 9024.657
PTPRC 55 CXCR4 159.36667 SST 7393.812
CXCR4 53 CXCL1 159.11667 DRD2 6805.501
C3 52 MMP9 158.95 PTPRC 6554.313
MMP9 52 PTPRC 158.63333 MMP9 6510.665
CCL4 51 C3 157.35 ICAM1 6220.507
CXCL1 50 CCL4 157.08333 TLR8 5657.862
FPR2 48 ICAM1 156.2 IL13RA2 4956.119
SAA1 47 PPBP 153.31667 APOE 4947.338
ICAM1 46 CCL20 153.30952 MAGEA1 4312.797
Cancer Management and Research downloaded from https://www.dovepress.com/ by 118.70.13.36 on 24-Aug-2020
a number of genes associated with GC.24–26 The specific molecular mechanisms governing this disease, however, are complex, and as such further data mining efforts are needed to identify relevant candidate biomarkers for GC diagnosis.
In this study, we used the GSE55696 dataset to explore gene expression in EGC, comparing differences between EGC (pooled with HGIN) and LGIN and thereby identifying 270 and 212 up- and down-regulated genes, respectively.
We conducted GO analyses to gain better functional insights into the roles of the DEGs detected through this approach. This strategy revealed upregulated DEGs to be enriched for GO terms including“inflammatory response”,
“extracellular region”, “immune response”, “extracellular
space”, and “neutrophil chemotaxis”. Inflammation is
a very important factor linked with GC progression and
prognosis.27,28 The immune response is also associated
with GC to some degree.29We further found downregulated
Figure 4GC patient survival analyses for the four candidate hub genes. Red and black lines represent patients with high and low expression levels of the indicated hub gene, respectively. (A) ICAM1 survival analysis in patients with GC (B) PTPRC survival analysis in patients with GC. (C) MMP9 survival analysis in patients with GC. (D) TLR8 survival analysis in patients with GC.
Cancer Management and Research downloaded from https://www.dovepress.com/ by 118.70.13.36 on 24-Aug-2020
DEGs to be enriched for GO terms such as “hormone activity”, “peptide hormone processing”, “secretory gran-ule”,“fibrinolysis”, and“neuropeptide signaling pathway”. Neuropeptides are known to drive oncogenesis in response to inflammation through enhanced proliferation of epithelial
cells.30Fibrinolysis is associated with D-dimer production, with Lan et al having observed higher D-dimer levels in the plasma of GC patients relative to healthy controls in a manner correlated with depth of invasion, tumor size,
lymph node metastasis, and TNM stage.31
Figure 5ICAM1 expression in GC patients. (A) Immunohistochemical localization of ICAM1 in GC. (B) Verification of protein levels expression in GC by Western blot. (C) ICAM1 levels were detected in 30 pairs of GC tissues by qRT-PCR, revealing significantly higher ICAM1 expression in GC tissues relative to paracancerous tissues.ΔCt values were determined by subtracting theβ-actin Ct value from the ICAM1 Ct value. A smallerΔCt value indicates higher expression. (D) ICAM1 expression in primary gastric tumor tissue compared to normal tissues; (E) ICAM1 expression in male and female GC patients; (F) ICAM1 expression in different races. STAD: stomach adenocarcinoma. *means p<0.05. ***means p<0.0001.
Cancer Management and Research downloaded from https://www.dovepress.com/ by 118.70.13.36 on 24-Aug-2020
In our pathway enrichment analysis, we found upregulated DEGs to be involved in“cytokine−cytokine receptor interac-tion”,“chemokine signaling pathway” and “staphylococcus
aureus infection”. Chemokines are known to control cell
migration in the context of inflammation, and prolonged
inflammation can create a microenvironment conducing to
the growth of tumors.32,33DEGs downregulated in this study were linked to “chemical carcinogenesis”, “metabolism of
xenobiotics by cytochrome P450”, and“drug metabolism −
cytochrome P450”. This is consistent with previous
research.34–36
These functional enrichment analyses gave us a clear understanding of the potential functions of these DEGs in the development of GC, which also suggested the
impor-tance offinding hub genes among these genes.
Using a PPI network, we identified 4 candidate hub genes
among these DEGs–MMP9, ICAM1, TLR8, and PTRC.
These genes were highly expressed in EGC tissue samples but not in LGIN samples. Of these found genes, only ICAM1
was significantly associated with a poor GC patient
prog-nosis, suggesting it may serve an oncogenic role. The dis-covery of this result gave us the enlightenment: ICAM1 regulates the occurrence of GC directly or indirectly, and may be used as a biomarker for the diagnosis of EGC. Of course, we need a larger sample for verification.
Since ICAM1 has a biological role in regulating the occurrence of gastric cancer, we were also interested in whether ICAM1 could be used as a marker for evaluating the prognosis of patients with EGC.
ICAM1, also known as CD54,37 is an immunoglobulin
superfamily (IGSF) member containing immunoglobulin-like domains of 90–100 amino acids in length.38ICAM1 is a key adhesion molecule that can vary substantially in size according to its glycosylation status.39,40It is also a key regulator of tumor progression, and it has been found to be upregulated in many tumor types including breast, kidney, and pancreatic cancers.41–43 Our findings are in line with previous work exhibiting significantly increased ICAM1 levels in EGC
rela-tive to LGIN. ICAM1 plays tissue type-specific roles, with
positive ICAM1 expression in breast cancer being negatively correlated with tumor size, lymph node metastasis, and tumor invasion.44In contrast, Huang et al found IL-35 to drive PDAC
metastasis via promoting ICAM1 overexpression,45 and Di
et al determined that inhibiting ICAM1 significantly impaired breast cancer cell metastatic activity.42,43 In this study, we found that high ICAM1 expression was evident in GC patient tissues, and was linked with a poorer GC patient prognosis. This expression was not associated with patient gender or
ethnicity. This suggests ICAM1 has the potential to be used as an independent prognostic biomarker of EGC, in addition to playing a role in disease progression. But this also required a large number of samples for diagnostic tests.
In this report, we identified 482 genes differentially
expressed between EGC and LGIN tumor samples, among which ICAM1 was prominent. Enrichment analyses revealed the identified DEGs to be associated with pathways known to
be relevant in cancer. Using a PPI network, we identified
ICAM1 as a gene associated with GC patient prognosis and survival, with elevated expression of ICAM1 being present in GC patients regardless of race or gender. This suggests that ICAM1 may play a role in GC progression, and may be a valuable early biomarker with diagnostic and prognostic relevance.
Study Limitations
This study has many limitations, including its limited number of samples analyzed and the lack of detail regard-ing the mechanisms by which ICAM1 is expressed in GC. Future studies focused on these underlying mechanisms in a larger cohort of samples are thus needed.
Abbreviations
GC, gastric cancer; EGC, early gastric cancer; DEGs, differ-entially expressed genes; LGIN, low-grade intraepithelial neoplasia; HGIN, high-grade intraepithelial neoplasia; GO, gene ontology; KEGG, Kyoto Encyclopedia of Genes and Genomes; PPI, protein-protein interaction; STRING, Search Tool for the Retrieval of Interacting Genes.
Ethics Approval and Consent to
Participate
The study was approved by Guangxi Medical University
Cancer Hospital Institutional Ethics Committee (No.
LW2019057) and all participants gave written informed con-sent. This study strictly followed all regulations of the Declaration of Helsinki, and all data were maintained with confidentiality.
Data Sharing Statement
The datasets analyzed during the current study are available
in the GSE55696 repository (www.ncbi.nlm.nih.gov/geo).
Acknowledgment
This project was supported by Guangxi Medical High-level Backbone Talent "139" Plan (No. G20190315),
Cancer Management and Research downloaded from https://www.dovepress.com/ by 118.70.13.36 on 24-Aug-2020
Guangxi Natural Science Foundation (No. 2017G
XNSFAA980650), Guangxi Key R & D Plan
(AB18221084), and Funding for the development and promotion of suitable medical and health technologies in Guangxi (S2018059).
Disclosure
The authors report no conflicts of interest in this work.
References
1. Bray F, Ferlay J, Soerjomataram I, Siegel RL, Torre LA, Jemal A. Global cancer statistics 2018: GLOBOCAN estimates of incidence and mortality worldwide for 36 cancers in 185 countries.CA Cancer J Clin.2018;68(6):394–424. doi:10.3322/caac.21492
2. Feng R-M, Zong Y-N, Cao S-M, Xu R-H. Current cancer situation in China: good or bad news from the 2018 global cancer statistics?
Cancer Commun.2019;39:1. doi:10.1186/s40880-019-0368-6 3. Feng F, Tian Y, Xu G, et al. Diagnostic and prognostic value of CEA,
CA19–9, AFP and CA125 for early gastric cancer. BMC Cancer.
2017;17:1. doi:10.1186/s12885-017-3738-y
4. Liu Y, Zheng D, Liu -J-J, et al. Comparing PET/MRI with PET/CT for pretreatment staging of gastric cancer. Gastroenterol Res Pract.
2019;2019:1–11.
5. Evans JA, Chandrasekhara V, Chathadi KV, et al. The role of endo-scopy in the management of premalignant and malignant conditions of the stomach.Gastrointest Endosc.2015;82(1):1–8. doi:10.1016/j. gie.2015.03.1967
6. Yang L, Zheng R, Wang N, et al. Incidence and mortality of stomach cancer in China, 2014. Chin J Cancer Res. 2018;30(3):291–298. doi:10.21147/j.issn.1000-9604.2018.03.01
7. Bouzbid S, Hamdi-Chérif M, Zaidi Z, et al. Global surveillance of trends in cancer survival 2000–14 (CONCORD-3): analysis of indi-vidual records for 37 513 025 patients diagnosed with one of 18 cancers from 322 population-based registries in 71 countries.
Lancet.2018;S0140673617333263.
8. Li DF, Wang NN, Chang X, et al. Bioinformatics analysis suggests that COL4A1 may play an important role in gastric carcinoma recurrence.
J Dig Dis.2019;20:391–400. doi:10.1111/cdd.2019.20.issue-8 9. Yan P, He Y, Xie K, Kong S, Zhao W. In silico analyses for potential key
genes associated with gastric cancer.Peer J.2018;6:e6092. doi:10.7717/ peerj.6092
10. Bosman FT WHO classification of tumours of the digestive system2010. 11. Shi Y. The new understanding and rational treatment about high-grade gastric intraepithelial neoplasia.Chin J Pract Surg.2011;31(8):659–661. 12. Xu X, Feng L, Liu Y, et al. Differential gene expression profiling of gastric intraepithelial neoplasia and early-stage adenocarcinoma.
World J Gastroenterol.2014;20(47):17883–17893. doi:10.3748/wjg. v20.i47.17883
13. Clough E, Barrett T. The gene expression omnibus database.Methods Mol Biol.2016;1418:93.
14. Consortium TGO. Expansion of the gene ontology knowledgebase and resources.Nucleic Acids Res.2016;45(D1):D331.
15. Minoru K, Susumu G, Yoko S, Miho F, Mao T KEGG for integration and interpretation of large-scale molecular data sets. 2012. doi:10.1094/PDIS-11-11-0999-PDN
16. Da WH, Sherman BT, Lempicki RA. Systematic and integrative analysis of large gene lists using DAVID bioinformatics resources.
Nat Protoc.2009;4:1513–1521. doi:10.1038/nprot.2009.154 17. Szklarczyk D, Morris JH, Cook H, et al. The STRING database in
2017: quality-controlled protein–protein association networks, made broadly accessible. Nucleic Acids Res. 2017;45(Database issue): D362–D368. doi:10.1093/nar/gkw937
18. Szász AM, Lánczky A, Nagy Á, et al. Cross-validation of survival associated biomarkers in gastric cancer using transcriptomic data of 1065 patients.Oncotarget. 2016;7(31):49322–49333. doi:10.18632/ oncotarget.v7i31
19. Chandrashekar DS, Bashel B, Sah B, et al. UALCAN: a portal for facilitating tumor subgroup gene expression and survival analyses.
Neoplasia.2017;19(8):649–658. doi:10.1016/j.neo.2017.05.002 20. Liu K, Liu H, Zhang Z, Ye W, Xu X. The role of N-glycosylation in
high glucose-induced upregulation of intercellular adhesion molecule-1 on bovine retinal endothelial cells. Acta Ophthalmol (Copenh).2016;94(4):353–357. doi:10.1111/aos.2016.94.issue-4 21. Chen W, Zheng R, Baade PD, et al. Cancer statistics in China, 2015.
CA Cancer J Clin.2016;66(2):115–132. doi:10.3322/caac.21338 22. Zou WB, Yang F, Zhao-Shen LI; Gastroenterology DO. How to
improve the diagnosis rate of early gastric cancer in China.
J Zhejiang Univ.2015;44(1):9–14.
23. Katai H, Ishikawa T, Akazawa K, et al. Five-year survival analysis of surgically resected gastric cancer cases in Japan: a retrospective analysis of more than 100,000 patients from the nationwide registry of the Japanese Gastric Cancer Association (2001–2007). Gastric Cancer.2017;21(1):1–11.
24. Wu Q, Zhang B, Wang Z, et al. Integrated bioinformatics analysis reveals novel key biomarkers and potential candidate small molecule drugs in gastric cancer.Pathol Res Pract.2019;215(5):1038–1048. doi:10.1016/j.prp.2019.02.012
25. Hao S, Lv J, Yang Q, et al. Identification of key genes and circular RNAs in human gastric cancer. Med Sci Monitor. 2019;25:2488–2504. doi:10.12659/MSM.915382
26. Jiang K, Liu H, Xie D, Xiao Q. Differentially expressed genes ASPN, COL1A1, FN1, VCAN and MUC5AC are potential prognostic bio-markers for gastric cancer.Oncol Lett.2019.
27. Oshima H, Oshima M. The role of PGE-associated inflammatory responses in gastric cancer development. Semin Immunopathol.
2013;35(2):139–150. doi:10.1007/s00281-012-0353-5
28. Deng Q, He B, Liu X, et al. Prognostic value of pre-operative inflammatory response biomarkers in gastric cancer patients and the construction of a predictive model.J Transl Med.2015;13(1):1–16. doi:10.1186/s12967-015-0409-0
29. Yolanda LV, Sergio PDL, Hugo ES, et al. Gastric cancer progression associated with local humoral immune responses. BMC Cancer.
2015;15(1):924. doi:10.1186/s12885-015-1858-9
30. Jeppsson S, Srinivasan S, Chandrasekharan B. Neuropeptide Y (NPY) promotes inflammation-induced tumorigenesis by enhan-cing epithelial cell proliferation. Am J Physiol Gastrointest Liver Physiol.2016;312(2):ajpgi.00410.2015.
31. Long L, Xi Z, Bing Y, et al. Elevated plasma D-dimer levels correlate with long term survival of gastric cancer patients.PLoS One.2014;9 (3):e90547. doi:10.1371/journal.pone.0090547
32. Hannelien V, Karel G, Jo VD, Sofie S. The role of CXC chemokines in the transition of chronic inflammation to esophageal and gastric cancer.BBA Rev Cancer.2012;1825(1):117–129. doi:10.1016/j.bbcan.2011.10.008 33. Vandercappellen J, Damme JV, Struyf S. The role of CXC
chemo-kines and their receptors in cancer. Cancer Lett. 2008;267 (2):226–244. doi:10.1016/j.canlet.2008.04.050
34. Ding J, Zhang Y. Analysis of key GO terms and KEGG pathways associated with carcinogenic chemicals. Comb Chem High Throughput Screen. 2018;20(10):861–871. doi:10.2174/13862073 21666171218120133
35. Demetriou CA, Degli Esposti D, Pullen Fedinick K, Russo F, Robinson O, Vineis P. Filling the gap between chemical carcinogen-esis and the hallmarks of cancer: a temporal perspective.Eur J Clin Invest.2018;48(6):e12933. doi:10.1111/eci.2018.48.issue-6 36. Sik Kim H, Jun Kwack S, Mu Lee B. Alteration of cytochrome P-450
and glutathioneS-transferase activity in normal and malignant human stomach.J Toxicol Environ Health Part A.2005;68(19):1611–1620. doi:10.1080/15287390500182867
Cancer Management and Research downloaded from https://www.dovepress.com/ by 118.70.13.36 on 24-Aug-2020
37. Stefan K, Roth RB, Richard R, et al. Large-scale association study identifies ICAM gene region as breast and prostate cancer suscept-ibility locus.Cancer Res.2004;64(24):8906–8910. doi:10.1158/0008-5472.CAN-04-1788
38. Smith CW, Marlin SD, Rothlein R, Toman C, DC A. Cooperative interactions of LFA-1 and Mac-1 with intercellular adhesion molecule-1 in facilitating adherence and transendothelial migration of human neutrophils in vitro. J Clin Invest. 1989;83(6):2008. doi:10.1172/JCI114111
39. Staunton DE, Dustin ML, Erickson HP, Springer TA. The arrange-ment of the immunoglobulin-like domains of ICAM-1 and the bind-ing sites for LFA-1 and rhinovirus. Cell. 1990;61(2):243–254. doi:10.1016/0092-8674(90)90805-O
40. Kotteas EA, Panagiotis B, Ioannis G, Sofia T, George T, Syrigos KN. The intercellular cell adhesion molecule-1 (icam-1) in lung cancer: implications for disease progression and prognosis.Anticancer Res.
2014;34(9):4665–4672.
41. Shi X, Jiang J, Ye X, Liu Y, Wu Q, Wang L. Prognostic prediction and diagnostic role of intercellular adhesion molecule-1 (ICAM1) expression in clear cell renal cell carcinoma.J Mol Histol.2014;45 (4):427–434. doi:10.1007/s10735-014-9568-1
42. Jenkinson C, Elliott V, Menon U, et al. Evaluation in pre-diagnosis samples discounts ICAM-1 and TIMP-1 as biomarkers for earlier diagnosis of pancreatic cancer. J Proteomics. 2015;113:400–402. doi:10.1016/j.jprot.2014.10.001
43. Di D, Chen LEI, Wang L, et al. Downregulation of human intercellular adhesion molecule-1 attenuates the metastatic ability in human breast cancer cell lines. Oncol Rep. 2016;35(3):1541–1548. doi:10.3892/ or.2016.4543
44. Ogawa Y, Hirakawa K, Nakata B, et al. Expression of intercellular adhesion molecule-1 in invasive breast cancer reflects low growth potential, negative lymph node involvement, and good prognosis.
Clin Cancer Res.1998;4(1):31–36.
45. Huang C, Li N, Li Z, et al. Tumour-derived Interleukin 35 promotes pancreatic ductal adenocarcinoma cell extravasation and metastasis by inducing ICAM1 expression. Nat Commun. 2017;8:14035. doi:10.1038/ncomms14035
Cancer Management and Research
Dove
press
Publish your work in this journal
Cancer Management and Research is an international, peer-reviewed open access journal focusing on cancer research and the optimal use of preventative and integrated treatment interventions to achieve improved outcomes, enhanced survival and quality of life for the cancer patient.
The manuscript management system is completely online and includes a very quick and fair peer-review system, which is all easy to use. Visit http://www.dovepress.com/testimonials.php to read real quotes from published authors.
Submit your manuscript here:https://www.dovepress.com/cancer-management-and-research-journal
Cancer Management and Research downloaded from https://www.dovepress.com/ by 118.70.13.36 on 24-Aug-2020