1
Increased Doubling Time with Significant Recovery and Low
Mortality from COVID-19 following Extended Lockdown:
Implication for Development of Protective Immunity against
SARS-CoV-2 In a Population
PRABIR CHAKRAVARTY, Ph.D
Former Scientist, Albert Einstein College of Medicine, 1300, Morris Park Avenue, Bronx, New York-10461
2
ABSTRACT
COVID-19 is fast spreading around the globe in a highly contagious manner.
The results from our study showed that after intervention with successive
Lockdowns, there was marked decrease in the rate of COVID-19 cases,
though there was sporadic volatility in number of COVID-19 cases due to
some extrinsic factors. Concomitant with reduction in rate of COVID-19
there was gradual increase in doubling time of COVID-19, steady increase in
number of discharged/recovered patients from COVID-19 reaching to ≥ 58%
taking the entire Indian population into consideration. Another important
aspect was consistent low mortality rate was accompanied by gradual
increase in recovery rate of COVID-19 in the population. The possible
implication of these results in the development of protective immunity in the
population has been discussed.
Key words: COVID-19 – interventions- growth curve- recovery – mortality
3
I. INTRODUCTION
The novel coronavirus (SARS- COV-2) originated in Wuhan in Hubei
province of China during December 2019, and has now spread across the
world making it a pandemic. Until date there are no therapeutic
agents/vaccines developed which could be of promise to control this highly
infectious virus from spreading among human population. At this juncture,
therefore, controlling the spread of this highly contagious disease is a
priority.
SARS virus belongs to the family Coronaviridae, which is known to cause
respiratory illnesses in humans and animals. coronavirus (CoV) is a novel
member of this family that causes acute respiratory distress syndrome
(ARDS), which is associated with high mortality rate. Its characteristic
feature is long latency period before a typical flu-like fever, cough, and
shortness of breath manifests. The people infected with this virus may not
show any early symptoms allowing them to pass it on to others
unknowingly.
Due to alarming nature of this disaster world-wide and to contain its spread
at an early stage, a short curfew followed by ‘National Lockdown’ for 21 days
starting from 23rd March, 2020 Midnight until Midnight of 14 April, 2020
was implemented by Indian Authorities. Following which the Lockdown was
extended twice until 31 May 2020. We have described earlier a method to
monitor the spread of COVID-19 among the population during Lockdown-1
and showed that during this period number of COVID-19 cases abruptly
4
However, there was some volatility due to spurt in the number of cases on
1st April, 2020 onwards due to some extrinsic factors (1, 2). At this stage,
Lockdown was further extended for two weeks from 14th April until 30 April,
2020 (Lockdown-2), until 17 May 2020 (Lockdown-3) and until 31 May,
2020 (Lockdown-4) respectively.
In this article, we have endeavoured to further elucidate the role of
successive Lockdowns (1 to 4) on the spread and control of COVID-19 and
possible significance of the changes on development of protective immunity
within the population.
II. METHOD AND RESULTS: The present study was carried out on the data
collected from Indian Government sources and other National News outlets
which were confirmed as COVID-19 positive cases, starting from March 15,
2020 until date as described previously (1,2).
The Figure 1 reflects the total number of reported cases of COVID-19/day
until the end of Lockdown-4, that is 31 May, 2020. The graph reflects that
there was a gradual increase in the number of COVID-19 cases since 15
March, 2020 until 31 May, 2020. However, the trend line shows that the
actual number of COVID-19 cases could have been much lower than the
reported number which plausibly was due to sudden spurt in number of
cases, once immediately after lockdown-1 from single source and the second
spurt in the number of COVID-19 cases was due to unprecedented
movement of ~ 6.3 million migrant labourers across the country during
Lockdown-3 & 4 (R2 = 0.829). These changes in the rate of COVID-19 are
5
25th March 2020, there was marked decrease in the rate of COVID-19 cases
in the population, which was stably maintained until 31 March 2020.
However, on the 1st of April, 2020 a spurt was noted in the COVID-19 cases
and there was 2.5 folds increase in COVID-19 cases compared to 31 March,
2020. This abrupt change in number of COVID-19 cases was due to
contribution of cases from a ‘single source’ (2). Later contribution from a
‘second source’ representing migrant labourers caused abrupt increase in
number of COVID-19 cases. All such spurts appeared as small peaks in the
percent graph. As reflected in the graph, around 14th May, 2020, the rate of
COVID-19 cases stabilised at ≤ 4% which was maintained until the end of
Lock-down 4. However, the trend line suggests that by the end of
Lockdown-4, the rate of COVID-19 case should have been much lower than the actual
value recorded in the graph ( R 2 = 0.320). The trend line also confirmed that
the ‘spurts’ had a negative impact in the rate of spread of COVID-19 cases
among the population. The Figure-3 gives a comparative rate of COVID-19
during Lockdown-3 and Lockdown-4 respectively. The comparative study
shows that the volatility in rate of COVID-19 cases had decreased during the
period of Lockdown-4 with R 2 value being = 0.674, and the value of R 2
being = 0.266 during Lockdown-3. It is also clear from the graph that the
actual rate of growth of COVID-19 came down from 5% to ≤ 4.5 % by the
end of Lockdown-4 on 31 May, 2020. Interestingly, with noticeable stability
achieved in rate of COVID-19 cases by the end of Lockdown-4, the number
of patients recovering from COVID-19 also increased steadily. The Figure: 4
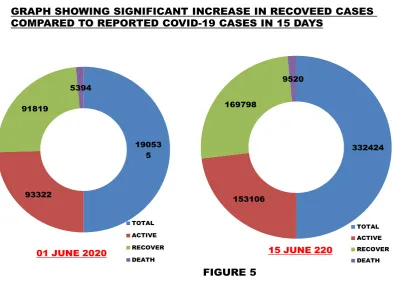
6
compared to reported cases, at the end of Lockdown-4 and subsequently the
percentage gradually increased which is demonstrated in Doughnut chart
(Figure 5). A Doughnut chart meant to express a "part-to-whole"
relationship, where all pieces together represent 100%, shows the recovery
rate on 01 June, 2020 (immediately after lockdown-4) and later on 15 June
2020. It is clear from the chart that the recovery rate was 48% on 01 June,
2020 and 54% on 15 June, 2020 as compared to total confirmed cases.
Interestingly, the number of recovered individuals was approximately equal
to the number of active cases of COVID-19 after lockdown-4. Due to
significant recovery from COVID-19 cases, it was of interest to see if any
correlation existed between rate of recovery and rate of COVID-19 cases. The
Figure-6 reflects that there was a weak negative correlation between the two
variables with R 2 = 0.296. Another noteworthy aspect of the study was that
with gradual increase in recovery rate, the mortality rate was consistently
very low as shown in Figure-7. The mortality rate has been consistently
maintained at ~2.8% from the beginning, whereas the recovery rate
continues to rise and presently it is ~60%. When a correlation was drawn
between the mortality rate and the rate of COVID-19 cases a weak negative
correlation between the two variables with R 2 = 0.21 was observed as shown
in Figure-8. With gradual decrease in the rate of COVID-19 cases to below
~4% at the end of lockdown-4, the doubling time of the COVID-19 cases also
increased to 15 days as on 5 June 2020. When the two variables were
plotted on correlation coefficient graph, a weak negative correlation was
7
suggests that gradual increase in the number of Recovered/disease free
individuals with time to above 50% along with a negative correlation
between the doubling time and the rate of reported COVID-19 cases implies
that the Indian population could be steadily moving towards developing
protective immunity against COVID-19. The Figure-10 shows the
distribution of COVID-19 cases in some states of India with high number of
COVID-19 cases compared to rest of India. The figure emphasizes that a few
states have the bulk of COVID-19 cases compared to rest of the country.
III. DISCUSSION:
The disaster caused all over the world by COVID-19 pandemic has prompted
a massive global effort to control spread of this disease in their respective
population. At present due to lack of any specific treatment regimen for
COVID-19, the importance of implementing Lockdown/social distancing at
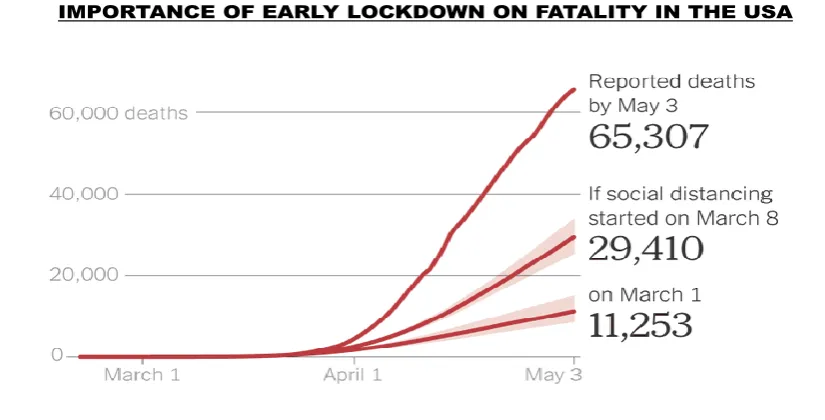
the appropriate time cannot be ignored at all. Delaying implementation of
intervention/social distancing in the USA even by few weeks resulted in
heavy loss of human lives as depicted in the model shown in Figure-11.
India however, by introducing physical intervention with social distancing
rather early on March 23, 2020, when number of COVID-19 positive cases
was negligible, achieved rapid arrest of COVID-19 cases among Indian
population as reported earlier by us (1). Though there was substantial
volatility in the rate of COVID-19 during Lockdown-1, it gradually subsided
by the end of Lockdown-4. Such alteration in volatility during successive
Lockdowns was reflected from the improved R2 value at the end of
8
rate of COVID-19 at the end of Lockdown-4 along with increased doubling
time of COVID-19 to 15 days on 5 June, 2020, conclusively demonstrated
that spread of COVID-19 was gradually slowing down in the population.
Additionally, steady increase in number of discharged/recovered patients
from COVID-19 with sustained lower rate of mortality also points to the
gradual waning of the SARS-CoV-2 virus.
Immunity and COVID-19: It has been observed that the recovered patients
across the world showed presence of antibodies against the novel
coronavirus, SARS-CoV-2, and transfer of ‘Plasma’ taken from such
recovered patients were able to cure patients suffering from COVID-19.
Studies from South Korea and other countries have confirmed that an
immune response develops in recovered patients. In a study in the USA, it
was demonstrated that specific T cells could have played a role in fighting
the disease at late stage of infection with SARS-CoV-2. A recent preprint has
corroborated that divergent SARS-CoV-2-specific T and B cell responses
were seen in severe but not mild COVID-19 (4). All such studies have
repeatedly demonstrated that a long term memory T-cell mediated response
is vital for eradicating the viral infection. Therefore, it is reasonable to
speculate that an earlier presence/induction of specific T cell response
against the SARS-CoV-2 may become a game changer for the treatment of
COVID-19.
A case of protective Immunity: Given the importance of immunity in natural
control of any viral disease including COVID-19, it is worthwhile to develop
9
important point of recognition in the present study, towards that direction,
is that there was a negative correlation among the vital parameters of
recovery, doubling time and rate of COVID-19 cases; such detection would
plausibly suggest that there is a gradual development of protective immunity
within the population.
Protective immunity/Herd immunity, also called herd protection, is the
resistance to the spread of a contagious disease within a population that
results if a sufficiently high proportion of individuals become immune to the
disease. It basically serves as an indirect protection to those who are not
immune to the disease. This type of protection could also be achieved either
through vaccination or from previous infections. Analysis of the data
available from different parts of the world suggested that when the
SARS-CoV-2 did not meet any substantial resistance (immune response) in a
population, it was able to spread quickly and subsequently caused havoc in
a population. In India however, the picture appears to be different for
various reasons. Firstly, the novel coronavirus met with stringent resistance
by way of physical intervention & social distancing at an early stage, which
not only disallowed its spread far and wide but also broke its chain of
movement locally. This abrupt slow down in the mobility of the virus, as
reflected in the lower rate of COVID-19 (Figure: 2), resulted in gradual
weakening (attenuation) of the virus and aided in development of ‘natural
immunization’. Secondly, abrupt spurt in the number of COVID-19 cases
on two occasions; once on 1st April, 2020 from a ‘single source’ as described
10
of migrant labourers (6.3 million) returning to their home state in trains and
buses from across India during Lockdown-3/Lockdown-4 without
maintenance of ‘social distancing’, should have derailed the effect of
Lockdown on rate of COVID-19 cases. However, the silver lining is that such
disaster did not take place. This outcome points to the fact that majority of
such individuals may have had prior immunization with related virus that
protected them against the infection of SARS-CoV-2. Immunologically, this
could be due to presence of cross reacting T cells already present in most
individuals as a result of prior infection or passive immunization to a related
virus. The Table-1 lists the different vaccines used in India since 1893 (5),
which could have aided in developing this type of immune response. A
recent article published in the journal Cell has precisely demonstrated that
blood samples collected from a group of 20 people in 2015, who were never
exposed to the novel coronavirus, SARS-CoV-2, had cross-reactive Th cells
that were capable of recognizing & responding faster to the novel
coronavirus (Figure-12; Reference: 6). In Indian context, a large number of
people in the population have been previously immunized against many of
the deadly microbe borne diseases like TB, small pox, diphtheria etc either
by vaccination during childhood or by getting cured from the disease itself
(5). In a recent study in the USA, BCG vaccine which is used for vaccinating
against TB, when used to vaccinate a large number of individuals in
American Indian population has shown to reduce the risk for developing
lung cancer in a clinical trial conducted in American–Indian and Alaska
11
Though in classical scenario of herd protection, it requires significant
percentage of people to be immune against the virus in a population,
however, in case of Indian population cross reacting memory T-cells may
already be present to respond actively against the SARS-CoV-2 virus and
attenuation of the virus due to successful and prolonged Lockdown may,
additionally, facilitated passive immunization who were not previously
immunized with a related virus. We have earlier shown that it was possible
to generate a long term T cell response by attenuating tumour cells in vivo
by irradiation (8). Results do reflect that there are early signs of
development of protective immunity against the novel coronavirus in the
population.
Though it is presently believed that as long as there are susceptible and
infected people in the population, the virus could spread, data accumulated
during the last three months reflect that first wave of the epidemic has been
controlled as a result of prolonged Lockdown and for presence of immunity
to fight the virus in the population and initiate protective immunity in the
population to fight the subsequent infection by SARS-CoV-2. Another aspect
to be considered seriously is that for the success of development of immune
protection in the population, sustained Lockdown and maintaining social
distancing norms enabling attenuation of the virus. One encouraging result
worth mentioning at this point, is that in a random survey of the presence of
SARS-CoV-2 antibody in a metropolitan city of India, 14.2% had the viral
antibody whereas only 10,000 cases of COVID-19 was reported.
12
IV. Acknowledgement:
1. Government of India for providing the data
2. Different News channels of India for information regarding COVID-19.
3. Thanks to Dr. Prabal Chakravarty for providing assistance in preparation of
Manuscript and for providing encouragement.
V. References:
1. Chakravarty, P. A Simple Method for Detecting Early Signal in Nature of
Progression of Covid-19 in Indian Population. Preprints 2020, 2020040041
(doi: 10.20944/preprints202004.0041.v1).
2. Chakravarty, P. A Simple Method for Detecting Early Signal in Nature of
Progression of Covid-19 in Indian Population (Accepted for publication in S.
Journal of Biotechnology, 2020).
3. Chakravarty, P. COVID-19 Follows a Flattened Growth Curve Subsequent to
Prolonged Intervention in A Population; Its Implication on Rate Of Doubling
Time & Plausible Suppression of SARS-CoV-2 Infection. Preprints 2020,
2020050110 (doi: 10.20944/preprints202005.0110.v1).
4. Anna E. Oja, Anno Saris, Cherien A. Ghandour, Natasja A.M. Kragten, Boris
M. Hogema, Esther J Nossent, Leo M.A. Heunks, Susan Cuvalay, Ed Slot,
Francis H. Swaneveld, Hans Vrielink, Theo Rispens, Ellen van der Schoot,
Rene A.W. van Lier, Anja Ten Brinke, Pleun Hombrink. Divergent
SARS-CoV-2-specific T and B cell responses in severe but not mild COVID-19 doi:
https://doi.org/10.1101/2020.06.18.159202
5. Chandrakant Lahariya A brief history of vaccines & vaccination in
13
6. Alba Grifoni, Daniela Weiskopf, Sydney I. Ramirez, ...Davey M. Smith, Shane
Crotty, Alessandro Sette. Targets of T Cell Responses to SARS-CoV-2
Coronavirus in Humans with COVID-19 Disease and Unexposed Individuals.
Cell 181, 1–13 June 25, 2020
7. BCG vaccination linked to reduced incidence of lung cancer Med wire news,
21 October, 2019.
8. Chakravarty, P. et al.; Flt3L therapy following localized tumor irradiation
generates long-term protective immune response in metastatic lung cancer:
its implication in designing a vaccination strategy. Oncology, 70(4):245-54.
2006.
VI. LEGEND TO FIGURES
Figure1: The graph depicts the total number of COVID-19 positive
individuals in Indian Population at different time points between 15 March,
2020 and 31 May, 2020 (end of Lockdown-4). As evident from the graph,
there is an increase in number of positive cases in the population before and
after four Lockdowns spanning 68 days.
FIGURE 2: The graph shows the percent change in COVID-19 cases from15
March, 2020 until 31 May, 2020 (end of Lockdown-4). The graph reflects
that following implementation of four ‘Lockdowns’, a flattened growth curve
was maintained from around 15 May, 2020. However, the trend line shows
that the number should have been much lower at the end of lockdown-4.
FIGURE 3: The figure shows a comparative representation of the rate of
14
graph reflects that the volatility seen during earlier Lockdowns was reduced
and stabilised during lockdown-4 and the rate of reported cases of
COVID-19 was ≤ 4.6%.
FIGURE 4: The graph shows that the number of recovered cases of
COVID-19 compared to reported cases during lockdown-4. The number of recovered
individuals gradually increased to more than 30% in the graph. Later, as of
29 June 2020, nearly 60% patients suffering from COVID-19 recovered.
FIGURE 5: The doughnut charts show the distribution of Total, active,
recovered and deceased individuals with COVID-19 on 1 June, 2020 and 15
June, 2020.
FIGURE 6: The Figure shows the correlation between percent of recovered
individuals from COVID 19 and the rate of COVID-19 cases. As reflected in
the graph weak negative correlation existed between the two variables.
FIGURE 7: The figure shows the number of recovered individuals and
mortality from COVID-19 between 1 June, 2020 and 14 June, 2020. It is
clear from the figure that while the mortality was consistently same, the
number of recovered individuals steadily increased during the same period.
Figure 8: The figure shows correlation between mortality rate and rate of
COVID-19 cases. A weak negative correlation between the two variables with
15
Figure 9: The figure shows the correlation between the doubling time of
COVID-19 cases and rate of COVID-19. A weak negative correlation was
noted between the two variables with R2 = .082.
Figure10: The graph shows the distribution of COVID-19 cases in some
states of Indian union as compared to rest of India. The point to note in the
graph is that the state of Maharastra alone has more cases of COVID-19
than the rest of India (excluding Tamil Nadu, Delhi & Gujarat).
Figure 11: The figure is to show the positive effect of intervention by
lockdown/social distancing. It is clear from the graph that there was six
times increase in fatalities for delayed implementation of social distancing in
the USA (The graph has been taken from NY times, USA).
Figure 12: The figure is an illustration which reflects that the persons who
were never exposed to the novel coronavirus, SARS-CoV-2, had
cross-reactive Th cells that were capable of recognizing & responding faster to the
novel coronavirus, SARS-CoV-2 (Reference: 5).
Table 1: The table lists the different vaccines used in India since 1893. The
population immunized/cured from any of the vaccines/disease have a
plausible chance to respond to the novel coronavirus, SARS-CoV-2
16
FIGURES
R² = 0.829
-100000 -50000 0 50000 100000 150000 200000
FIGURE-1
R
EP
O
R
TE
D
C
A
SE
S
17
R² = 0.320
0 10 20 30 40 50 60 70 80 15 -M ar 17 -M ar 19 -M ar 21 -M ar 23 -M ar 25 -M ar 27 -M ar 29 -M ar 31 -M ar 02 -Apr 04 -Apr 06 -Apr 08 -Apr 10 -Apr 12 -Apr 14 -Apr 16 -Apr 18 -Apr 20 -Apr 22 -Apr 24 -Apr 26 -Apr 28 -Apr 30 -Apr 02 -M ay 04 -M ay 06 -M ay 08 -M ay 10 -M ay 12 -M ay 14 -M ay 16 -M ay 18 -M ay 20 -M ay 22 -M ay 24 -M ay 26 -M ay 28 -M ay 30 -M ay FIGURE-2 PE R C EN T C H A N G E
18
R² = 0.674
0 1 2 3 4 5 6
R² = 0.266
0 1 2 3 4 5 6 7 8 9
FIGURE-3
A COMPARATIVE STUDY OF THE RATE OF COVID-19 CASES BETWEEN LOCKDOWN-3 AND LOCKDOWN-4
LOCKDOWN-3
19
0% 10% 20% 30% 40%
50% 60%
70% 80% 90% 100%
RECOVERED
REPORTED
FIGURE-4
20
19053 5
93322 91819
5394
TOTAL ACTIVE RECOVER
DEATH 01 JUNE 2020
332424
153106 169798
9520
TOTAL ACTIVE RECOVER DEATH 15 JUNE 220
GRAPH SHOWING SIGNIFICANT INCREASE IN RECOVEED CASES COMPARED TO REPORTED COVID-19 CASES IN 15 DAYS
21
y = -4.188x + 64.63 R² = 0.296
2 12 22 32 42 52 62
0 1 2 3 4 5 6
PE
R
CEN
T
RECO
VER
Y
PERCENT CHANGE IN COVID-19 CASES
FIGURE-6
22
0 20000 40000 60000 80000 100000 120000 140000 160000 180000
REPO
R
TE
D
N
U
M
BER
DATE
RECOVERY MORTALITY
FIGURE-7
23
y = -0.040x + 2.973 R² = 0.21
2.76 2.78 2.8 2.82 2.84 2.86 2.88 2.9
0 0.5 1 1.5 2 2.5 3 3.5 4 4.5 5
P
E
R
CE
NT
M
OR
T
AL
IT
Y
PERCENT CHANGE IN COVID-19 CASES
FIGURE-8
24
y = -0.072x + 7.480 R² = 0.082
0 2 4 6 8 10 12 14 16
0 10 20 30 40 50 60 70 80
RA
TE
O
F
CH
AN
G
E
IN
CO
VI
D
-1
9
CA
SE
S
DOUBLING TIME
FIGURE-9
25 FIGURE-10
70013
23495 20834
17217
58976
R² = 0.001
70013
23495 20834 17217
190535 R² = 0.404
26
Source: NY Times FIGURE -11
27
FIGURE-12
UNEXPOSED INDIVIDUALS RESPOND TO CRONAVIRUS SARS-CoV-2
28