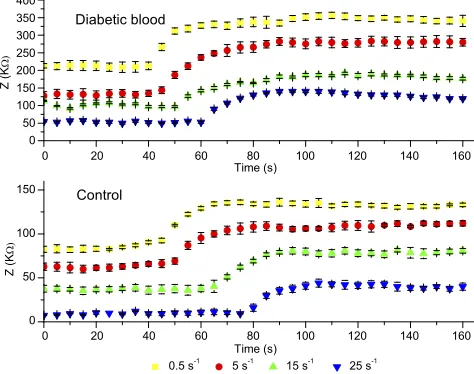
<p>Electrical Analysis Of Normal And Diabetic Blood For Evaluation Of Aggregation And Coagulation Under Different Rheological Conditions</p>
Full text
Figure


Related documents
The tabulation of ARL s of EWMA charts viz, the parametric X - EWMA and the nonparametric GSR-EWMA for various degrees of shift in the underlying process average,
In this section we develop monotone method for Riemann-liouville fractional differential equations with initial conditions for all types of coupled lower and upper solutions defined
Keywords: Rainfall-Runoff Models, GR4J, GR2M, Validation, Calibration, Nash criterion, Koulountou River Subbasin, Gambia River
Talakona is known for wide variety of Medicinal Plants that have been in existence, identified and utilized since hundreds of years by local tribes.The present
VGS system targets the increasing population of online users, enabling user to provide location based services.. In existing system allows users to register as
[6].Provincial data for Hypomagnesemia (Hypomagnesemia and “Laidunhalvaus” together) and Parturient hypocalcaemia (HCa), “Poikimahalvaus” are from monthly reports
Lastly an interpretation of the measured di ff erential cross sections in the H → γγ channel, using an e ff ective Lagrangian to probe anomalous Higgs boson couplings, is
Logistic regression test for the relationship between dependent and independent variables revealed that, y = (α) 0.700 + effects of cultural factors (-0.229).Based on the study