Comprehensive Analysis for Shifting MIMO SAR System
Sang Ho Lim*
Abstract—Synthetic aperture radar (SAR) system has inherent constraints between high azimuth resolution and wide swath width. Achieving more phase center samples is one of the key solutions to resolve this limitation. By multiple N transmitting and N receiving channel concept, an increased resolution or a widened swath width could be obtained. In this paper, comprehensive analysis for shifting multiple-input multiple-output (MIMO) SAR system is presented. System resolution enhancement has been demonstrated based on the distributed target simulation by a factor of N compared to conventional displaced phase center antenna (DPCA) system.
1. INTRODUCTION
Conventional synthetic aperture radar (SAR) systems which use a single antenna aperture for transmitting (Tx) and receiving (Rx), have inherent limit for achieving a wide swath widthWg and a
good azimuth resolutionρa together. This limitation can be expressed about pulse repetition frequency
(PRF) as follows:
vp
ρa ≈
Δfd<PRF<
c 2·Wg·sin(θi)
(1)
wherevp is airborne or spaceborne platform velocity, Δfd the Doppler bandwidth,c the speed of light
and θi the incident angle. From this inequity, PRF boundary could be determined with considering an
appropriate azimuth resolution and a suitable swath width.
Airborne SAR system has a large boundary about the PRF because of the slower velocity and smaller swath width than spaceborne SAR system. For those reasons, a high PRF for obtaining both wide swath width and high resolution can be simply selected [1]. For spaceborne SAR system, which has a faster platform velocity and a wider required swath width, several novel studies based on the displaced phase center antenna (DPCA) technique have been introduced for overcoming the constrains [2–6].
Using the conventional DPCA system, we can obtain additional samples in the azimuth direction by a factor of N, which is the number of Rx channels, during each pulse repetition interval (PRI). By increasing the number of samples, an improved azimuth resolution or a decreased PRF can be achieved by a factor of N. When considering the Tx and Rx channels for the systems, DPCA SAR system can be explained as a single-input multiple-output (SIMO) system. For getting more samples, novel multiple-input multiple-output (MIMO) SAR system concept design based on a multiple Tx antenna shift method has been introduced [7], and various types of MIMO SAR systems have received much attention due to their attractive application potentials [10–13]. The shifting MIMO SAR system has N2 samples during one PRI, and it results in an increased azimuth resolution or the decreased operating PRF by a factor of N, number of Tx channels, compared to the DPCA-based SAR systems.
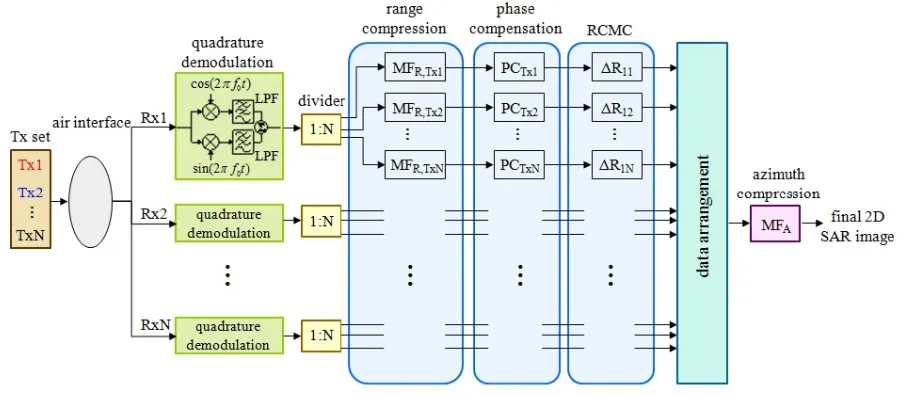
In this paper, comprehensive analysis for the proposed shifting MIMO SAR system is presented. Figure 1 shows the total block diagram of the suggested shifting MIMO SAR system which includes a Tx pulse generation set, an air interface, Rx demodulation, dividers, range compression, phase
Received 4 January 2016, Accepted 4 March 2016, Scheduled 20 March 2016
* Corresponding author: Sang Ho Lim ([email protected]).
Figure 1. Total block diagram of proposed shifting MIMO SAR system.
compensation, range cell migration correction (RCMC), data arrangement, and azimuth compression blocks. Through the phase compensation blocks, we can consider the phase errors caused by the discrete distribution of element antennas of a large array. Based on the detailed total system analysis, it would be straightforwardly possible to apply this suggested method to real spaceborne SAR system. This paper is organized as follows. In Section 2, I briefly explain the suggested shifting MIMO SAR system compared to the conventional DPCA-based SAR system. In Section 3, a detailed analytical description of the proposed shifting MIMO SAR system is presented. The performance analysis based on a distributed target simulation is presented in Section 4. I conclude the paper with a brief summary in Section 5.
2. SHIFTING MIMO SAR SYSTEM AND CONSTRAINTS
Figure 2 shows a comparison between a DPCA-based SAR system, which has a single fixed Tx and three Rx antennas, and the suggested shifting MIMO SAR system with three Tx and Rx antennas. The timing diagrams of both systems are illustrated in Figure 2(a). In contrast to the DPCA-based SAR system, a Tx set which has multiple Tx pulses is used for the suggested system. Each Tx pulse is emitted at each shifted Tx antenna with a pulse durationτ and pulse interval Δτ.
As we can observe in Figure 2(b), the number of sample positions in one PRI in the DPCA-based SAR system is equal to that of the receiving channels, 3; on the other hand, the shifting MIMO SAR system can obtain 32 sample positions in the same PRI with the help of shifting strategy.
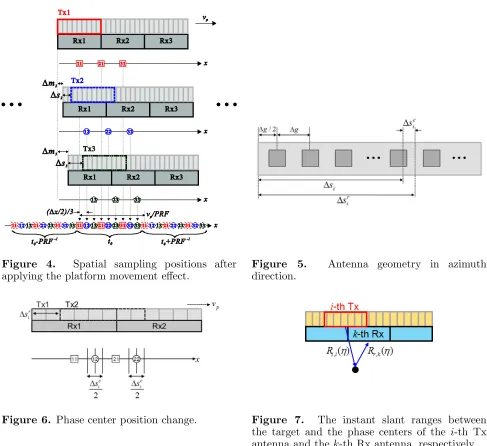
To obtain the same distance between samples, the movement of the platform during the previous pulse transmissions has to be considered. If not, the delayed samples are obtained and cause significant error as shown in Figure 3.
The platform movement for the previous pulse transmission can be represented as follows:
Δmi = (i−1)·(τi+ Δτ)·vp (2)
where Δmi is the distance of the movement of the platform when the i-th pulse is emitted. In order to
compensate the movement of the platform, the space desired to be shifted for the Tx antenna at each pulse can be derived as follows:
Δsi=
(i−1)·Δx
N −2·Δmi (3)
where Δsi is the shifted space of the i-th Tx antenna, and the first term of this equation represents
(a)
(b)
Figure 2. Comparison between a DPCA-based SAR and proposed shifting MIMO SAR. (a) Timing diagrams of DPCA-based SAR (left) and proposed shifting MIMO SAR (right). (b) Spatial sampling points of DPCA-based SAR (left) and proposed shifting MIMO SAR (right).
Figure 3. Necessity of a platform movement consideration.
The shifted space Δsi should be greater than or equal to zero to guarantee the system operation.
Therefore, the maximum number of Tx and Rx antennas of the shifting MIMO SAR system can be derived as following equations.
Δsi ≥0 (4)
N ≤ Δx
2·(τi+ Δτ)·vp
(5)
Another important issue when designing the shifting MIMO SAR system is the Tx antenna shift error because of the discrete distribution of element antennas of a large array antenna. So the shifted space Δsi given from Eq. (3) cannot be adjusted arbitrarily in a real array antenna system.
Figure 5 shows the antenna geometry in azimuth direction. The desired shifted space, Δsi, can be
Figure 4. Spatial sampling positions after applying the platform movement effect.
Figure 5. Antenna geometry in azimuth direction.
Figure 6. Phase center position change. Figure 7. The instant slant ranges between the target and the phase centers of the i-th Tx antenna and thek-th Rx antenna, respectively.
in Eq. (6).
Δsi= round
Δsi
Δg
·Δg+ frac
Δsi
Δg
= Δsri + Δsci (6)
−Δg
2 ≤Δs
c i ≤
Δg
2 (7)
where Δg is the gap between the element antennas. Since the phase center positions are placed at the middle point between the Tx antenna and Rx antenna, the phase center position change due to the Tx antenna shift error is half of the space to be compensated as shown in Figure 6.
−0.175λ≤ Δs
c i
2 ≤0.175λ (8)
3. COMPREHENSIVE ANALYSIS FOR PROPOSED SYSTEM
In this section, a more detailed analytical description of the shifting MIMO SAR system is given. The whole block diagram of the suggested shifting MIMO SAR system is expressed in Figure 1. Tx pulses with slope-varying chirp signals can be used to achieve low cross-correlation [8]. Thei-th Tx signal can be expressed as follows:
stx,i(t) = Ai·wr,i(t)·cos
2πf0t+πKr,it2
(9)
wr,i(t) = rect
t
τi
(10)
where fo is the operating frequency, and Ai, wr,i(t), Kr,i, and τi are the amplitude, range window
function, range linear frequency modulation (LFM) rate, and pulse duration of the i-th Tx signal, respectively. rect(x) is the rectangular function defined by
rect(x) =
1, if |x| ≤0.5
0, otherwise (11)
The Tx pulse set stx(t) can be expressed with the time delay of each pulse as in Eq. (9), below.
stx(t) = N i=1 stx,i t−
Δmi
vp
(12)
The total Tx pulses are emitted and then reflected from a ground through the air interface. Each receiver is turned on to obtain the reflected signals, and the signal arrived at the k-th Rx antenna can be represented as follows:
srx,k(t, η) = N
i=1
Bki·wa(η)·stx,i
t−
Δmi
vp
−Rt,i(η) +Rr,k(η)
c (13)
where
R(η) =
R2
0+v2pη2 ≈R0+ v2
pη2
2R0
(14)
Rt,i(η) = R
η−
Δsr i
vp
(15)
Rr,k(η) = R
η−(k−1)v ·Δx p
(16)
Rt,1(η) = Rr,1(η) =R(η) (17)
η is the azimuth time;Bki is the complex radar cross section (RCS);wa(η) is the azimuth beam pattern
that can be extended using the method [1];Rt,i(η) andRr,k(η) are the instant slant ranges between the
target and the phase centers of the i-th Tx antenna and the k-th Rx antenna, respectively as shown in Figure 7; R(η) is the standard slant range which is the distance between the target and the phase center of the first Tx antenna; R0 is the slant range of closet approach.
Substituting Eq. (9) into Eq. (13) gives
srx,k(t, η) = N
i=1
Bki·wa(η)·Aiwr,i
t−
Δmi
vp
−Rki(η)
c
·cos
2πf0
t−
Δmi
vp
−Rki(η)
c +πKr,i
t−
Δmi
vp
−Rki(η)
c 2
(18)
where
The received signal is down-converted using the quadrature demodulation, and the k-th baseband signal can be expressed as follows:
srxb,k(t, η) = N
i=1
Bki·Aiwr,i
t−
Δmi
vp
−Rki(η)
c ·wa(η)
·exp
−j2πf0
Δmi
vp ·
exp
−j4π λ0
R0
·exp
j−π
Δs−ki2 2λ0R0
·exp
−jπKa
η−
Δs+ki 2vp
2 ·exp jπKr,i t−
Δmi
vp
−Rki(η)
c 2
(20)
where
Ka = 2v2p/(λ0R0) (21)
Δs−ki = Δsri −(k−1)·Δx (22)
Δs+ki = Δsri + (k−1)·Δx (23)
The exponential terms of Eq. (20) express phase variations due to Tx pulse delay, slant range R0, different azimuth displacements between Tx and Rx antennas, azimuth and range modulations. Each baseband signal is now equally divided into N paths and compressed in the range direction by independently using N matched filter. The range compressed signal of the k-th Rx antenna withl-th Tx matched filter as in Eq. (24) can be represented using the principle of stationary phase (POSP) [9] as in Eq. (25).
hr,l(t, η) = exp
−jπKr,lt2
(24)
skl
rc(t, η) =
1 N
BklAl·plr
t−
Δml
vp
−Rkl(η)
c ·APkl(η)
+1 N N i=1 i=l
BkiAi·qilr
t−
Δmi
vp
−Rki(η)
c ·APki(η) (25)
where
pl r(t) =
exp (sgnl·jπ/4)
|Kr,l| |Kr,l|τl·sinc (|Kr,l|τlt) (26)
qil r =
|Kr,l| |Kr,i−Kr,l|·
exp
(sgni+ sgnil)·jπ 4
·rect
|Kr,l|t
|Kr,i−Kr,l|τi
·exp
−jπ·Kr,iKr,l
(Kr,i−Kr,l)τi
t2
(27)
sgnl =
1, Kr,l>0
−1, Kr,l<0 (28)
sgnil =
1, KKr,i−Kr,l r,iKr,l >0 −1, KKr,i−Kr,l
r,iKr,l <0
(29)
APki(η) = wa(η)·exp
−j2πf0
Δmi
vp ·
exp
−j4π λ0
R0
·exp
j−π
Δs−ki2 2λ0R0
·exp
−jπKa
η−
Δs+ki 2vp
2
The first part of Eq. (25) is the autocorrelation, and the second part represents the cross-correlations. The power difference level between them can be expressed in log scale as follows:
20·log10
|Kr,i−Kr,l| ·τi
(31)
We can select the range LFM rates and pulse durations to make power difference level less than
−30 dB. From this process, we can omit the term related with cross-correlations in Eq. (25) and obtain N2 independent signals after applying range compression using N matched filters.
To correctly recover the N2compressed signals, the phase variations due to the Tx pulse delay of Eq. (2) and different azimuth displacements between the Tx and Rx antennas of the third exponential term in Eq. (20) have to be compensated by adding the following term:
P Cki = exp
j2π
Δmi
vp
f0+
Δs−ki2 4λ0R0
(32)
In order to compensate the Tx antenna shift error mentioned in the previous section, I added the following term in the range Doppler domain.
P Cki(fη) = exp
j
2π vp
Δsci
fη (33)
The phase compensated signal can be expressed in the range Doppler domain as follows:
Skl
pc(t, fη) =
BklAl
N ·plr
t−
Δml
vp
−Rkl(fη)
c ·APklpc(fη) (34)
where
Rkl(fη) = 2R0+ v2 p R0 f η Ka
+Δs +
kl
2vp
2
+
Δs−kl2 4v2
p
(35)
APpc
kl(fη) = Wa(fη)·exp
−j4π λ0 R0 ·exp jπ Ka f2 η ·exp j 2π vp
−((k−1)N+l−1)·Δx
2N + Δml fη
(36)
fη is the azimuth frequency andWa(fη) the envelope of Doppler spectrum of the antenna azimuth beam
pattern. The position of the phase center between thel-th Tx antenna andk-th Rx antenna is given in the first term in the square brackets in Eq. (36). The second term demonstrates the compensation for the movement of the platform when thel-th pulse is emitted.
The total phase centers from the suggested MIMO SAR system have N2 positions in one PRI as shown in Eq. (37), below. Each row is obtained from the corresponding Rx antenna, and each column is related with the corresponding Tx antenna.
−Δx
2N ⎡ ⎢ ⎢ ⎢ ⎢ ⎢ ⎣
0 . . . l−1 . . . N −1
..
. . .. ... . .. ...
(k−1)N . . . (k−1)N +l−1 . . . kN−1 ..
. . .. ... . .. ...
(N −1)N . . . (N−1)N +l−1 . . . N2−1
⎤ ⎥ ⎥ ⎥ ⎥ ⎥ ⎦ (37)
N2 phase compensated signals move to the next step of the RCMC, and the quantity to be corrected is as follows:
RCMkl(fη) =−
Δml·c
vp − v 2 p R0 f η Ka
+Δs +
kl
2vp
2
+
Δs−kl2 4v2
p
(38)
After applying the RCMC, the corrected signal can be expressed as follows:
Skl
rcmc(t, fη) =
BklAl
N ·plr
t−2R0 c ·AP
pc
N2 corrected signals, as arranged in Equation (40), below, fill in the gaps of the target’s azimuth phase history.
Sda(t, fη) =
⎡ ⎢ ⎢ ⎢ ⎢ ⎢ ⎢ ⎢ ⎢ ⎢ ⎢ ⎢ ⎢ ⎢ ⎢ ⎣ S11
rcmc(t, fη)
S12
rcmc(t, fη)
.. . S1N
rcmc(t, fη)
.. . SN1
rcmc(t, fη)
SN2
rcmc(t, fη)
.. . SN N
rcmc(t, fη)
⎤ ⎥ ⎥ ⎥ ⎥ ⎥ ⎥ ⎥ ⎥ ⎥ ⎥ ⎥ ⎥ ⎥ ⎥ ⎦ (40)
Ha(fη) = exp
−jπf2
η/(Ka)
(41)
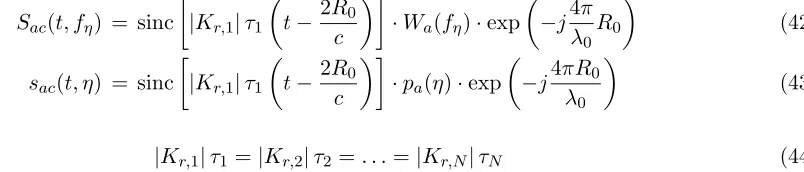
After applying the azimuth matched filter in Eq. (41) to the data set of Eq. (40), we can, finally, obtain a 2-dimensional SAR image in the range Doppler domain as Eq. (42) and the range azimuth time domain as Eq. (43) when normalization criteria is used.
Sac(t, fη) = sinc
|Kr,1|τ1
t− 2R0
c ·Wa(fη)·exp
−j4π λ0
R0
(42)
sac(t, η) = sinc
|Kr,1|τ1
t− 2R0
c ·pa(η)·exp
−j4πR0 λ0
(43)
where
|Kr,1|τ1=|Kr,2|τ2=. . .=|Kr,N|τN (44)
pa(η) is the amplitude of the azimuth impulse response based on the antenna azimuth beam pattern.
Using the azimuth beam pattern extension [1] and the shifting MIMO SAR system concept, a high resolution image can be obtained without ambiguity.
Table 1. System parameters and simulation cases.
General parameters Value
Carrier frequency 9.7 (GHz)
Platform height 580 (km)
Platform velocity 7560 (m/s)
Chirp signal bandwidth 300 (MHz)
Interval between pulses 5 (µs)
Incident angle 20◦–55◦
Element antenna (EA) gap 0.7λ0
DPCA-based SAR system
Δx (m) No. of EA Beam width (deg) No. of Tx No. of Rx TAL (m)
Case 1 4 180 0.4 1 3 12
Case 2 3 135 0.52 1 4 12
Proposed MIMO SAR system
Δx (m) No. of EA Beam width (deg) No. of Tx No. of Rx TAL (m)
Case 3 4 180 1.2 3 3 12
Case 4 3 135 2.1 4 4 12
4. PERFORMANCE ANALYSIS USING DISTRIBUTED TARGET
In order to generalize the proposed shifting MIMO SAR system, the distributed target simulations are carried out using the parameters summarized in Table 1. The beamwidth of each Tx and Rx antenna is extended by a factor of N following the method suggested in [1]. Figure 8 shows a comparison between antenna azimuth beam patterns for each case.
Figure 9 shows the map of KAIST in Dae-jeon in Korea, and some area is selected to be used for
Figure 8. Antenna azimuth beam pattern comparison between DPCA-based SAR systems and proposed shifting MIMO SAR systems.
Figure 9. Original image for distributed target simulation.
(a) (b) (c)
(d) (e)
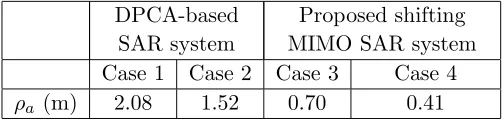
Table 2. Azimuth resolution comparison.
DPCA-based SAR system
Proposed shifting MIMO SAR system
Case 1 Case 2 Case 3 Case 4
ρa (m) 2.08 1.52 0.70 0.41
simulation. The gray-scaled bitmap image can be considered as the reflectivity map of the area. Regions of zero RCS are indicated by black color, while regions of high RCS are indicated by white color. The minimum cell resolution of the area is 0.25·0.25 m2. Since the area of the chosen region is 50·50 m2, the number of total targets in the area is 40,000.
Figure 10 represents the results of the distributed target simulations for the DPCA-based SAR system and the proposed shifting MIMO SAR system. To mitigate the image distortion between range and azimuth directions, various chirp pulse bandwidths are used. As shown in this figure, the azimuth resolution of the shifting MIMO SAR system was improved by a factor of 3 for Case 3 and 4 for Case 4 as compared to the conventional DPCA-based SAR system, as summarized in Table 2.
5. CONCLUSION
In this paper, detailed analysis for a shifting MIMO SAR system has been introduced. From the Tx pulse generation blocks to azimuth compression blocks, we can see the radar signal’s comprehensive logical expressions. Especially, during the phase compensation step, we can compensate the phase errors caused by the discrete distribution of element antennas of a large array. The shifting MIMO SAR system can obtain N2 samples during one PRI, and it can result in increased azimuth resolution by a factor of N, the number of Tx channels, compared to the DPCA-based SAR system. This is confirmed by the distributed target simulations. Based on the suggested comprehensive analysis for this shifting MIMO SAR system, it can be possible to effectively enhance the system performance of future spaceborne SAR systems.
REFERENCES
1. Lim, S., J.-H. Han, S.-Y. Kim, and N.-H. Myung, “Azimuth beam pattern synthesis for airborne SAR system optimization,” Progress In Electromagnetics Research, Vol. 106, 295–309, 2010. 2. Gebert, N. and G. Krieger, “Azimuth phase center adaptation on transmit for high-resolution
wide-swath SAR imaging,” IEEE Geosci. Remote Sens. Lett., Vol. 6, 782–786, 2009.
3. Krieger, G., N. Gebert, and A. Moreira, “Unambiguous SAR signal reconstruction from nonuniform displaced phase center sampling,”IEEE Geosci. Remote Sens. Lett., Vol. 1, 260–264, 2004. 4. Suess, M., B. Grafm¨uller, and R. Zahn, “A novel high resolution, wide swath SAR system,”Proc.
IGARSS, 1013–1015, 2001.
5. Callaghan, G. D. and I. D. Longstaff, “Wide swath spaceborne SAR using a quad element array,”
Proc. Inst. Elect. Eng. — Radar, Sonar, Navigat., Vol. 146, 159–165, 1999.
6. Currie, A. and M. A. Brown, “Wide-swath SAR,”Proc. Inst. Elect. Eng. — Radar, Sonar, Navigat., Vol. 139, 122–135, 1992.
7. Lim, S. H., C. G. Hwang, S. Y. Kim, and N. H. Myung, “Shifting MIMO SAR system for high-resolution wide-swath imaging,” Journal of Electromagnetic Waves and Applications, Vol. 25, Nos. 8–9, 1168–1178, 2011.
8. Soumekh, M., “SAR-ECCM using phase-perturbed LFM chirp signals and DRFM repeat jammer penalization,” IEEE Trans. Aero. Elect. Sys., Vol. 42, 191–205, 2006.
10. Krieger, G., “MIMO-SAR: Opportunities and pitfalls,” IEEE Transactions on Geoscience and Remote Sensing, Vol. 52, 2628–2645, 2014.
11. Hossain, M. A., A. Elshafiey, and M. A. S. Alkanhal, “High-resolution and wide-swath UWB OFDM MIMO synthetic aperture radar system using image fusion,”Journal of the Indian Society of Remote Sensing, Vol. 43, 225–242, 2015.
12. Huang, Y., G. Liao, J. Xu, and D. Yang, “MIMO SAR OFDM chirp waveform design and GMTI with RPCA based method,” Digital Signal Processing, Vol. 51, 184–195, 2016.