International Journal of General Medicine
Dove
press
O r I G I n A L r e s e A r c h
open access to scientific and medical research
Open Access Full Text Article
The effects of diet-induced obesity on hepatocyte
insulin signaling pathways and induction
of non-alcoholic liver damage
sameer Fatani1 Imose Itua2
Paul clark3
christopher Wong3
ebrahim K naderali2
1Obesity Biology Unit, school
of clinical sciences, University of Liverpool, Liverpool, UK;
2Department of health and Applied
social sciences, Liverpool hope University, hope Park, Liverpool UK;
3Aintree University hospital
nhs Foundation Trust, Longmoor Lane, Liverpool, UK
correspondence: eK naderali Department of health and Applied social sciences, Liverpool hope University, hope Park, Liverpool, L16 9JD, UK Tel +44 151 291 3439 Fax +44 151 291 3414 email naderae@hope.ac.uk
Abstract: The prevalence of diet-induced obesity is increasing amongst adults and children worldwide, predisposing millions of people to an array of health problems that include metabolic syndrome, non-alcoholic fatty liver disease and non-alcoholic steatohepatitis. In this study we used experimental animals to investigate the effects of dietary obesity on markers of hepatic insulin signaling as well as structural changes in hepatocytes. Adult male Wistar rats were randomized and assigned to either a control group or a test group. Controls were fed standard laboratory pelleted diet (chow-fed), while the test group had free access to a highly-palatable diet (HPD). After eight weeks, the HPD-fed animals were subdivided into three subgroups and their diets altered as follows: HPD-to-chow, HPD with the addition of fenofibrate given by oral gavage for a further seven weeks, or HPD with vehicle (1% carboxymethylcellulose at 1 mL/kg body weight) given by oral gavage for a further seven weeks, respectively. Untreated diet-fed animals had significantly higher body weight, liver weight, and all measured metabolic profiles compared with chow-fed and treated diet-fed groups. Expression of kinases IRβ, IRS-1, AKt, eNOS, Shc and ERK1/2 were unaffected by obesity, while IRS-2 and P I3 kinase levels were significantly reduced in untreated HPD animals. Compared with chow-fed animals, steatosis and steatohepatitis were almost doubled in animals from untreated HPD, while removal of HPD and fenofibrate-treatment reduced steatosis by 40% and 80% respectively. These data suggest that diet-induced obesity affects intracellular insulin signaling mechanisms, namely IRS-2 and PI 3-kinase, leading to hepatic insulin resistance. Moreover, diet-induced obesity induces fatty liver, an effect which can be reversed by either removal of the source of obesity or treatment with fenofibrate, a peroxisome proliferator-activated receptor alpha agonist.
Keywords: obesity, non-alcoholic steatohepatitis, hepatocyte insulin signaling, fenofibrate
Introduction
Obesity has been associated with glucose intolerance, insulin resistance, dyslipidemia and cardiovascular disease.1 The liver has specifically been implicated as a primary site of insulin resistance observed with visceral obesity. The mechanism(s) relating visceral fat accumulation to hepatic insulin resistance are not well understood, but several possible factors have been implicated. For example, increased release of adipokines such as TNF-α, resistin and adiponectin has been implicated in the development of hepatic resistance.2,3 Alternatively, the “portal hypothesis” posits a high rate of lipolysis of visceral adipose tissue leading to increased delivery of free fatty acids (FFA) to the liver via the portal vein, thus contributing to increased hepatic fat accumulation and insulin resistance.4,5
International Journal of General Medicine downloaded from https://www.dovepress.com/ by 118.70.13.36 on 22-Aug-2020
For personal use only.
Number of times this article has been viewed
This article was published in the following Dove Press journal: International Journal of General Medicine
Dovepress
Fatani et al
Chronic exposure of the liver to elevated FFA can promote liver gluconeogenesis,6 deplete enzymes involved in FFA oxidation and increase hepatic lipogenesis.7 In addition, elevated FFA is known to increase liver triglyceride (TG) content,8 and decrease insulin clearance,9 both of which are associated with insulin resistance. Thus, insulin signaling in the liver is critical in regulating glucose homeostasis and maintaining normal hepatic function. Furthermore, insulin resistance in hepatocytes leads to severe systemic insulin resistance and progressive hepatic dysfunction.10 It is therefore plausible to assume that reduced levels of expression of insulin signaling components in the liver and/or inhibition of their activation may precipitate insulin resistance.
Patients with metabolic syndrome X (a combination of insulin resistance, deranged lipid profile and vascular dysfunction) develop non-alcoholic fatty liver disease (NAFLD). As obesity is closely associated with NAFLD,11,12 it is expected that its incidence and prevalence will increase. Therefore, this study aims to investigate the effects of physiologic and pharmacologic weight reduction on liver morphology in diet-induced obese rats.
Methods
experimental protocol
Adult male Wistar rats (n = 40, weight 190 ± 3 g) were randomized and assigned to a control group (n = 10) and a test group (n = 30). Controls were fed standard laboratory pelleted diet (chow-fed), while the test group had free access to a highly-palatable diet (HPD). The standard chow diet provided 1310 KJ/100g total energy as carbohydrate 60%, fat 10%, and protein 30%. The HPD provided 1010 KJ/100g which consisted of 33% powdered chow, 33% condensed milk (Nestlé UK Ltd, York, UK) and 7% sucrose (Tate & Lyle, London, UK) by weight with the reminder being tap water. This provided 65% energy as carbohydrate, 19% as protein and 16% as fat. Chow-fed controls remained on their diet for 15 weeks, while after 8 weeks the HPD-fed animals were subdivided into three subgroups (each group contain-ing 10 animals). In the first subgroup, the HPD was removed and the standard chow diet was reintroduced (diet-to-chow), while the second subgroup remained on the HPD and were given fenofibrate (fenofibrate-treated, 50 mg/kg/day) by oral gavage for a further seven weeks. The third subgroup (HPD-fed) was given vehicle (1% carboxymethylcellulose at 1 mL/kg body weight; Sigma, Gillingham, UK) by oral gavage daily for seven weeks.
After 15 weeks the rats were weighed and then killed by CO2 inhalation after two hours of fasting. The total body fat mass was measured immediately by a bioimpedance method using TOBEC® equipment (Biotec Instruments Ltd, Kimpton, UK). The gonadal and perirenal fat pads and the gastrocnemius muscle were dissected and weighed. The liver was dissected and snap-frozen in liquid nitrogen for later molecular and histologic analysis. Plasma was immediately separated by centrifugation before being frozen for later measurement of nonesterified free fatty acids (NEFA) and triglycerides (TG) and tumor necrosis factor alpha (TNFα), using commercially available diagnostic kits (Roche, Welwyn, UK, and Sigma Diagnostics, Gillingham, UK). All procedures were carried out according to institutional ethical guidelines.
experimental procedures
Western-immunoblotting technique
Western-immunoblotting technique was carried out on the four experimental groups (chow-fed, diet-to-chow, fenofibrate and vehicle treated groups) to measure protein expression levels of kinases such as IR-β, IRS-1, IRS-2, Pl 3-kinase, Akt, eNOS, Shc and ERK1/2, which are involved in hepatic insulin signaling pathways.
Nonspecific binding proteins were discriminated by incubating the blot with a blocking buffer (5% milk powder, 1x phosphate buffer saline [PBS]) at room temperature for one hour, followed by immunoblotting with appropriate pri-mary antibody (1:500 dilution) made up in blocking buffer, left overnight at 4°C. The following morning, blots were washed in 1 × PBS with 1% Tween and incubated with sec-ondary antibody (1:1000), a horse-radish peroxidase (HRP)-linked anti-rabbit (or anti-goat, depending on the source of the species used for primary antibody) for one hour at room temperature. Proteins were detected using an enhanced chemiluminescence method. Positive controls were incubated for standardization of samples between blots, while molecular weight markers (Bio-Rad Laboratories Inc, Hercules, CA) were used for sizing of bands. Densitometry was used to quantify the bands obtained.
Liver triglyceride content
Triglyceride content was assessed in liver samples from all experimental groups: chow-fed, diet-fed with vehicle, diet- to-chow, and fenofibrate treated. Briefly, 80–100 mg liver tissue samples were homogenized in 500 µL dis-tilled water using a Poltroon homogenizer (Kinematical,
International Journal of General Medicine downloaded from https://www.dovepress.com/ by 118.70.13.36 on 22-Aug-2020
Dovepress hepatic insulin signaling in obesity
Lausanne, Switzerland). The homogenates were centrifuged for five minutes at 13,000 × g, and the supernatants were trans-ferred to Eppendorf tubes. The TG assay was performed on the supernatant to detect the concentration of TG in liver tissue.
Liver histology
Tissue samples of liver were prepared for histologic examinations using ordinary tissue processing, and stained using a hematoxylin and eosin staining protocol. Ten liver specimens (ten animals) from each experimental group were interpreted by a single pathologist who was blinded to all data concerning the liver samples and the experimental groups under investigation. The liver samples were analyzed microscopically for the presence or absence of the following histologic features: steatosis, steatohepatitis, fibrosis and hepatocellular carcinoma. Histologic features were interpreted according to the schema outlined by Brunt et al.13 Steatosis was graded on a 3-point scale: grade 1 = steatosis involving ,33% of hepatocytes; grade 2 = 33%–66%; grade 3 =.66%. Inflammation (steatohepatitis) was graded on a 4-point scale: grade 0 = no or negligible inflammation; grade 1 = mild; grade 2 = moderate; grade 3 = severe. Fibrosis was graded on a 5-point scale: stage 0 = no fibrosis; stage 1 = zone 3 perisinusoidal/perivenular fibrosis; stage 2 = zone 3 and periportal fibrosis; stage 3 = septal/ bridging fibrosis; stage 4 = cirrhosis.
Data interpretation and statistical analysis
For Western blotting, the data from chow-fed (control) animals were expressed as 100% response, and the
results from the other three groups were normalized and subsequently expressed as the percentage of their respective controls. Data are expressed as mean ± SEM. Data have a normal distribution (Shapiro Wilk W test). Statistical significance was tested using Student’s t-test or repeated measures (ANOVA; Bonferroni t-test) or the Mann –Whitney test, as appropriate. Results were considered statistically significant at P , 0.05. The histologic data are presented as percentages, each sample representing 10%.
Results
Body weight and metabolic changes
Animals given the HPD progressively gained more weight than their chow-fed counterparts. At the end of the study, untreated diet-fed (vehicle) animals were significantly heavier than chow-fed, diet-to-chow and fenofibrate-treated animals, while body weights of diet-to-chow and fenofibrate-treated animals were significantly (P , 0.01) lower than untreated diet-fed but not control chow-fed animals (Table 1). Compared with the chow-fed control group, the untreated diet-fed group had significantly (P , 0.001) higher percentage total fat levels, and epididymal perirenal fat masses. Similarly, plasma levels of insulin, TG, NEFA and TNFα were significantly (P , 0.001) higher in the untreated diet-fed group compared with the chow-fed group (Table 1). Removal of the palatable diet or fenofibrate treatment significantly reversed palatable diet-induced changes in fat masses and metabolic parameters (Table 1). There were no significant differences between plasma glucose levels and gastrocnemius muscle mass between the four experimental groups (Table 1).
Table 1 Physiological and metabolic characteristics of the four experimental groups
Chow-fed Untreated Fenofibrate treated
Diet-to-chow
Body weight (g)
• Initial 195 ± 3 196 ± 3 – –
• Mid study 500 ± 7 570 ± 12a 568 ± 12a 569 ± 14a
• Terminal 569 ± 7 699 ± 22a 589 ± 14bc 606 ± 16bc
% total fat mass 16.5 ± 1.1 23.6 ± 1.3a 19.9 ± 1.2bc 18.7 ± 1.2bc
% total lean mass 83.5 ± 1.0 76.4 ± 1.4a 80.1 ± 1.3bc 81.3 ± 1.5b
epididymal fat-pad mass (g) 5.9 ± 0.4 11.9 ± 1.1a 6.4 ± 0.7b 6.8 ± 0.6b
Perirenal fat-pad mass (g) 5.5 ± 0.2 11.3 ± 1.2a 6.3 ± 0.5b 6.7 ± 0.5b
Gastrocnemius muscle mass (g) 3.1 ± 0.1 3.2 ± 0.1 3.1 ± 0.1 3.2 ± 0.1
Plasma glucose (mM) 11.7 ± 0.5 13.8 ± 0.3 10.5 ± 0.3 12.7 ± 0.4
Plasma insulin (µg/L) 1.4 ± 0.1 3.7 ± 0.6a 1.2 ± 0.1b 1.4 ± 0.1b
Plasma triglyceride (mM) 0.76 ± 0.03 1.57 ± 0.16a 0.60 ± 0.03b 0.88 ± 0.04b
Plasma neFA (mM) 0.40 ± 0.02 0.51 ± 0.02a 0.31 ± 0.02b 0.45 ± 0.03b
Plasma TnFα (pg/mL) 608 ± 56 1047 ± 167a 532 ± 91b 660 ± 102b
Notes: Data are mean ± seM for n = 10 in each group. aP, 0.001 vs lean control; bP, 0.001 vs untreated; cP, 0.05 vs lean control.
Abbrevoations: neFA, ; TnFα, .
International Journal of General Medicine downloaded from https://www.dovepress.com/ by 118.70.13.36 on 22-Aug-2020
Dovepress
Fatani et al
Liver weight
Liver weight in untreated obese animals (vehicle) was significantly elevated compared with the chow-fed group (control) (P , 0.01, 1.22-fold). Replacing the palatable diet with standard laboratory chow (diet-to-chow group) completely restored the liver weight to the normal range with no significant difference in comparison to the chow-fed group. However, compared with chow-fed and vehicle groups, fenofibrate treatment produced a marked increase in liver weight of up to 2.13-fold (P , 0.01) (Figure 1).
Triglyceride content of liver
Compared with the chow-fed group, untreated obese animals (vehicle) had significantly (P , 0.05) higher TG levels. Diet-to-chow animals had liver TG levels similar to those of chow-fed, while TG levels in the fenofibrate-treated group were significantly reduced (P , 0.01) compared with the chow-fed group (Figure 2).
Expression of protein kinases
of insulin signaling pathways
in hepatocytes
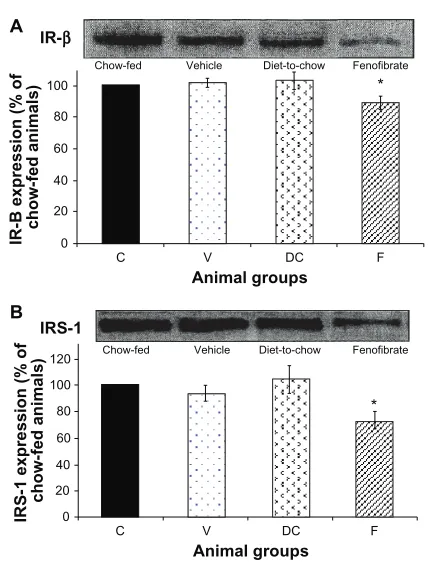
• IR-β and IRS-1: Diet had no significant effect on hepatocyte IR-β or IRS-1 levels while fenofibrate treatment resulted in significant (P , 0.001) reduction in the concentration of IR-β and IRS-1 in hepatocytes (Figure 3).
• IRS-2 and PI 3-kinase: Compared with chow-fed controls, diet-fed obese vehicle-treated animals had significantly lower levels of IRS-2 and PI 3-kinase
expression (P , 0.05). Fenofibrate treatment further increased reduction in IRS-2 and PI 3-kinase levels (P , 0.0001) (Figure 4).
• AKt: Although diet-induced obesity did not affect AKt levels, chronic withdrawal of the HPD caused a marked decrease in AKt protein (P , 0.05). Furthermore,
** *
14
12
10
8
6
4
2
0
C V DC F
Animal groups
Triglyceride (mg/100 mg tissue)
Figure 2 content of hepatic triglycerides (TG) in four experimental groups:
chow-fed (C), vehicle (V), diet-to-chow (DC), and fenofibrate treated (F).
Notes: Data represents means ± SEM for each group. There was a significant
increase in the vehicle group’s liver triglyceride levels which was reversed by
fenofibrate treatment. *P, 0.01, **P, 0.000.
*
0 100
80
60
40
20
C V DC F
Animal groups
IR-B expression (% of chow-fed animals)
IR-β
Chow-fed Vehicle Diet-to-chow Fenofibrate
* 120
100
80
60
40
20
0
C V DC F
Animal groups
IRS-1 expression (% of chow-fed animals)
IRS-1
Chow-fed Vehicle Diet-to-chow Fenofibrate A
B
Figure 3 Protein expression of A) Ir-β, and B) Irs-1 in rat liver. equal amounts (50 µg/well) of protein were separated by sDs-PAGe and immunoblotted with Ir-β or Irs-1 antibodies, respectively. The animal groups are: c) chow-fed lean control, V) vehicle group (untreated dietary obese), Dc (diet-to-chow group), and
F) fenofibrate treated group.
Notes: Data(mean ± seM) are normalized to that of the control group and
expressed as a percentage of chow fed (control) rats. *P, 0.001 versus chow-fed.
**
* 45
40 35 30 25 20 15
10 5 0
C V DC F
Animal groups
Liver weight (g)
Figure 1 Liver weight of the animals at the end of the experiment in four groups:
chow-fed (C), vehicle (V), diet-to-chow (DC), and fenofibrate treated (F).
Notes: Data represents means ± SEM for each group. There were significant increases in both vehicle and fenofibrate treated liver weights compared with chow-fed groups. *P, 0.01, **P, 0.0001.
International Journal of General Medicine downloaded from https://www.dovepress.com/ by 118.70.13.36 on 22-Aug-2020
Dovepress hepatic insulin signaling in obesity
fenofibrate treatment induced a significant reduction (P , 0.000005) in AKt levels (Figure 5).
• eNOS: Expression of eNOS protein was not affected in the three experimental groups: vehicle, diet-to-chow and fenofibrate groups. In fact, eNOS levels were similar in all groups with no significant difference between the groups (Figure 6).
• Shc and ERK 1/2: Shc and ERK1/2 expressions were similar in chow-fed, diet-induced obese (vehicle) and diet-to-chow animals. However, compared with chow-fed animals, the levels of both Shc and ERK1/2 were significantly (P , 0.005) reduced in fenofibrate-treated animals (Figure 7).
histologic features of liver tissue
(non-alcoholic fatty liver disease)
The histologic slides of liver tissue of each animal were examined for the presence or absence of histologic features of the different stages of non-alcoholic fatty liver
disease (Figure 8). Ten liver samples (ten animals) in each experimental group were analyzed microscopically.
steatosis (accumulation of fat in the liver)
Steatosis was found in 50% (grade 1steatosis) of the chow-fed control group, while untreated obese animals (vehicle group) had steatosis in 80% of the total samples (40% grade 1, 30% grade 2 and 10% grade 3). Steatosis was present in 50% of the samples of the diet-to-chow group (40% grade 1 and 10% grade 2). Fenofibrate-treated group had steatosis in only 10% of the total samples for this group (grade 2) (Table 2).
** *
120
100
80
60
40
20
0
C V DC F
Animal groups
C V DC F
Animal groups
IRS-2 expression (% of chow-fed animals
)
IRS-2
PI 3-kinase
Chow-fed Vehicle Diet-to-chow Fenofibrate
0 20 40 60 80 100 120
PI
3
-K
in
as
e
ex
pr
es
si
on
(%
of
c
ho
w
-fe
d
a
ni
m
al
s)
*
**
A
B
Figure 4 Protein expression of A) Irs-2 and B) PI 3-kinase in rat liver. equal amounts (50 µg/well) of protein were separated by sDs-PAGe and immunoblotted with Irs-2 and PI 3-kinase antibodies, respectively. The animal groups are: c) chow-fed lean control, V) vehicle group (untreated dietary obese), Dc) diet-to-chow group, of the control group and expressed as a percentage of chow fed (control) rats.
Notes: *P,0.05;**P, 0.0005 versus chow-fed.
0 20 40 60 80 100 120
F
Animal groups
Akt expression (% of chow-fed animals)
*
**
C V DC
Chow-fed
AKt
Vehicle Diet-to-chow Fenofibrate
Figure 5 Protein expression of AKt in rat liver. equal amounts (50 µg/well) of protein were separated by sDs-PAGe and immunoblotted with AKt antibody. The animal groups are: c) chow-fed lean control, V) vehicle group (untreated dietary
obese), DC) diet-to-chow group, and F) fenofibrate treated group.
Notes: Data (mean ± seM) are normalized to that of the control group and
expressed as a percentage of chow fed (control) rats. *P , 0.05, **P , 0.000005 versus chow-fed.
0 20 40 60 80 100 120 140
C
Animal groups
eNOS exression (% of chow-fed animals)
F DC
V
Chow-fed Vehicle Diet-to-chow Fenofibrate
eNOS
Figure 6 Protein expression of enOs in rat liver. equal amounts (50 µg/well) of protein were separated by sDs-PAGe and immunoblotted with enOs antibody. The animal groups are: c) chow-fed lean control, V) vehicle group (untreated
dietary obese), DC) diet-to-chow group, and F) fenofibrate treated group.
Notes: Data (mean ± seM) are normalized to that of the control group and
expressed as a percentage of chow fed (control) rats. No significant differences
were seen between the four groups.
International Journal of General Medicine downloaded from https://www.dovepress.com/ by 118.70.13.36 on 22-Aug-2020
Dovepress
Fatani et al
lipoprotein secretion in the fed state,14,15 as well as having a role in hepatocyte regeneration and growth.16 Therefore, the integrity of hepatic insulin signaling is important for the action of insulin in hepatocytes. Deficiency in protein expression of any components of insulin transduction may induce hepatic insulin resistance and subsequently may pre-cipitate induction of systemic insulin resistance and Type II diabetes, while local hepatic insulin resistance may cause non-alcoholic fatty liver disease.
In general, protein kinase phosphorylation and activation levels depend on the concentration of the expressed pro-tein.17 Therefore, in hepatocytes, defective protein kinase expression may cause insulin resistance with subsequent induction of hepatic insulin resistance-related clinical dis-orders, namely NAFLD. In the present study, diet-induced obesity did not affect the expression of insulin receptor β (IR-β) and insulin receptor substrate-1 (IRS-1), indicat-ing that the detrimental effects of diet-induced obesity on hepatic insulin signaling is at postreceptor levels. This is in contrast with findings on genetically obese animals where reduced IR-β autophosphorylation secondary to its inhib-ited expression in hepatocytes is a characteristic feature of the genetically obese hypertensive strain.18 In fact another study has revealed that in genetically obese ob/ob mice, levels and activation of IRS-1 are reduced significantly.19 Taken together, these reports indicate that the molecular mechanism of hepatic insulin resistance in genetic obesity may involve modification in the early steps (IR-β and IRS-1 proteins) of insulin signaling, and that the amount of protein expression may correlate directly with the levels of phosphorylation and activation of the protein. However, 0
20 40 60 80 100 120 140 160 Shc
C
Animal groups
Sh
c
ex
pr
es
si
on
(%
o
f
ch
ow
-fe
d
an
im
al
s)
*
F DC
V
C
Animal groups
F DC
V
Chow-fed Vehicle Diet-to-chow Fenofibrate
ERK 1/2 expression (% of
chow-fed animals
)
*
0 20 40 60 80 100
120 Chow-fed Vehicle Diet-to-chow Fenofibrate
ERK1/2
A
B
Figure 7 Protein expression of A) shc and B) erK1/2 in rat liver. equal amounts (50 µg/well) of protein were separated by sDs-PAGe and immunoblotted with shc or erK 1/2 antibodies, respectively. The animal groups are: c) chow-fed lean control, V) vehicle group (untreated dietary obese), Dc) diet-to-chow group, and
F) fenofibrate treated group.
Notes: Data (mean ± seM) are normalized to that of the control group and
expressed as a percentage of the chow-fed (control) rats. *P, 0.01 versus chow-fed.
A B
C D
Figure 8 histologic sectioning for the liver: A) normal liver, B) steatosis fatty liver grade one, C) steatosis fatty liver grade two and D) steatohepatitis grade one.
Note: The arrows indicate the presence of adipocytes in each section.
steatohepatitis
All four groups of animals had some degree of steatohepatitis. The highest level was in diet-induced obese (vehicle) animals (70%, Grade 1) whilst fenofibrate-treated animals had the lowest levels of steatohepatitis (10%, Grade 1) (Table 3).
Fibrosis and hepatocellular carcinoma
The histologic examination of samples in all experimental groups showed no signs of the presence of advanced fea-tures of NAFLD: fibrosis and hepatocellular carcinoma. All samples were negative for fibrosis and hepatocellular carcinoma.
Discussion
In the liver, insulin has a crucial role in mediating carbo-hydrate and lipid homeostasis by stimulating glycogen synthesis, lipogenesis, lipoprotein synthesis, suppression of gluconeogenesis/glycogenolysis and very low density
International Journal of General Medicine downloaded from https://www.dovepress.com/ by 118.70.13.36 on 22-Aug-2020
Dovepress hepatic insulin signaling in obesity
unlike studies in genetically obese animals, our study does not show any role for IR-β and IRS-1 involvements in genesis of hepatic insulin resistance.
In the liver, IRS-2 appears to have a major role in regulating hepatic insulin action, whereas IRS-1 appears to have important functions in skeletal muscle.20,21 IRS-2 has a major role in the growth-promoting actions of insulin, in suppressing gluconeogenesis and apoptosis in hepatocytes,22 and in acting as a regulatory point for the Pl 3-kinase-AKt cascade in hepatocytes.22,23 In the present study, levels of expression of both proteins (IRS-2 and Pl 3-kinase) were significantly decreased in diet-induced obese animals, suggesting that diet-induced obesity has similar detrimental effects to those of genetic obesity on IRS-2 and Pl 3-kinase proteins in hepatocytes. The normal concentration of AKt protein in the hepatocytes of diet-induced obese animals in our study is consistent with other studies,24 which found unchanged levels of protein expression and slightly elevated phosphorylation of AKt in genetic obesity. Therefore, both types of obesity may have similar effects on AKt protein expression.
In this study, fenofibrate had a significant effect on the reduction of IRβ, IRS-1, IRS-2, and PI 3-kinase, which may suggest deterioration of insulin signaling pathways, ulti-mately leading to worsening of insulin resistance. However, similar to previous reports, in this study, fenofibrate treatment improved insulin resistance as measured by plasma insulin and glucose levels. Therefore, a question arises as to what is the role/mechanism of fenofibrate in reducing hepatic IRβ, IRS-1, IRS-2, and PI 3-kinase protein expressions. To answer this important question, further investigations are required.
There is little information about hepatocyte eNOS expression in normal or diseased states. In hepatocytes,
eNOS may regulate hepatic vasculature, regulating blood flow and blood cell interaction.25 In the present study, expression of eNOS in the liver was not affected by the different dietary manipulations, or by disease states (normal, steatosis or steatohepatitis). This finding is in agreement with others, demonstrating that the expression of eNOS protein and its activity in hepatocytes is not changed in chronic liver disorders such as alcoholic cirrhosis, viral hepatitis, cholestasis, and fulminant liver failure.26 The normal expression of the MAP-kinase pathway is a crucial factor in mediating the mitogenic response of insulin. A defect in Pl 3-kinase may overactivate the MAP-kinase pathway, altering insulin response. In the present study, diet-induced obesity did not alter the expression of two important protein kinases (Shc and ERK 1/2) in the MAP-kinase pathway, despite significant protein deficiencies in the Pl 3-kinase pathway in hepatocytes. Interestingly, in the present study, the effect of palatable-diet removal on expression of AKt protein in hepatocytes was similar to its affect on AKt in the aorta reported previously.27 Moreover, this reduction in AKt expression in hepatocytes may be related to the sharp decrease in calorie intake. A similar study demonstrated that moderate calorie restriction for 20 days induced a decrease in AKt levels,28 suggesting that caloric intake may affect AKt protein levels which in turn may alter insulin response in vasculature and hepatocytes.
Fatty liver (steatosis), the first stage of NAFLD, was appar-ent in all experimappar-ental groups in our study. Histologic section-ing of liver samples of diet-induced obese animals showed a considerable amount of fat droplets, which was further confirmed by a significant elevation of triglyceride content of liver samples. Steatohepatitis (inflammation of the liver), the second stage of NAFLD, in untreated obese animals
Table 2 Total percentage of hepatic change (steatosis) in stage 1 of non-alcoholic fatty liver disease in the four experimental groups
Grade Chow-fed Vehicle Diet-to-chow Fenofibrate
steatosis (fatty change in the liver) 0 (negative samples) 50% 20% 50% 90%
1 50% 40% 40% –
2 – 30% 10% 10%
3 – 10% – –
Total % of fatty change in each group 50% 80% 50% 10%
Table 3 Percentage of hepatic inflammation in stage II of non-alcoholic fatty liver disease in the four experimental groups
Grade Chow-fed Vehicle Diet-to-chow Fenofibrate
Hepatic inflammation 0 (negative samples) 60% 30% 70% 90%
1 40% 70% 30% 10%
2 – – – –
3 – – – –
Total % of inflammation in each group 40% 70% 30% 10%
International Journal of General Medicine downloaded from https://www.dovepress.com/ by 118.70.13.36 on 22-Aug-2020
Dovepress
Fatani et al
was also confirmed by the histologic sectioning of the liver, indicating that steatosis was induced as a result of increasing influx of lipid into the liver29 in obese animals. Simple ste-atosis might have also progressed into steatohepatitis due to increased secretion of inflammatory markers from adipose tissue, which include TNF-α30 and CRP31. In the presence of hepatic insulin resistance, where the Pl 3-kinase pathway is inhibited and MAP-kinase (ERK1/2) is overactivated, liver disease may progress further. Previous studies have shown that regenerative response to liver injury is impaired in ob/ob obese mice with fatty livers,32 providing further support for the concept that inhibited regeneration contributes to disease progression in NAFLD. A study by Yang et al33 indicated that fatty hepatocytes in ob/ob mice become trapped in G1, the prereplicative phase of the cell cycle. However, the coordinated activation of the oxidant-sensitive, stress-, and mitogen-activated protein kinase cascades, which normally occurs early in G134 does not occur in fatty hepatocytes, which have adapted to a state of chronic oxidant stress.33 In fact, in fatty liver, the activation of the mitogen-activated kinase, ERK1/2, is enhanced, with abolishment of the induction of the stress-activated kinase JNK. Therefore, fatty ob/ob hepatocytes fail to proliferate despite robust ERK activation when JNK induction is abolished.35
A key feature in the molecular pathogenesis of liver fibrosis is the maintenance of the activated hepatic stellate cell phenotype by both proliferation and inhibition of apoptosis. Another study has demonstrated that leptin is a potent hepatic stellate cell mitogen and dramatically inhibits stellate cell apoptosis via ERK1/2 and AKt kinases.36 We and others have previously reported elevated plasma leptin concentration in diet-induced obese animals,37 a finding which suggests the implication of leptin and ERK1/2 in NAFLD progression.
Lifestyle modification of diet-induced obesity, repre-sented in the present study by chronic withdrawal of HPD (diet-to-chow group) retarded the progression of NAFLD and improved the histologic features of this disease to levels similar to those of chow-fed animals. The positive impact of physiologic weight loss on liver pathophysiology has been suggested since the early 1990s. Studies in human subjects have shown that weight loss and maintenance of weight loss in overweight patients with liver disease would result in improvement of liver function and serum insulin levels.38,39 Indeed our study provides clear evidence that both physiologic and pharmacologic weight loss would improve liver histology and function. Moreover, the pharmacologic intervention (fenofibrate therapy) further improved histologic features to levels better than that of the chow-fed group.
Interestingly, improvements in histologic features were paralleled with similar improvement in three detrimental factors associated with diet-induced obesity: TG content of the liver; plasma concentration of TNF-α; and total body weight, suggesting these have a role in initiating and inducing the different histologic features of NAFLD. Similar studies using a mouse model of non-alcoholic steatohepatitis have reported that peroxisome proliferator-activated receptor alpha (PPARα) agonists significantly improve hepatic steatosis, while PPARα (-/-) mice fed with methionine and choline deficient diet developed more severe steatohepatitis than the wild type mice,39,40 indicating a central role for PPARα receptors in hepatic pathophysiology.
Overall, this study indicates that diet-induced obesity results in hepatic insulin resistance, possibly by affecting expression and activation of insulin signaling proteins. Moreover, dietary obesity affects liver histology, leading to the development of NAFLD. Development of NAFLD may be associated with accumulation of triglycerides in the liver and/or changes in the hepatic insulin signaling pathway. These diet-induced detrimental effects on the liver can be attenuated and perhaps improved by both physiologic and pharmacologic weight reduction using PPARα agonists. However, it is important to conduct further research to deter-mine if other weight-reducing pharmacologic agents would have beneficial effects on liver physiology.
Disclosure
The authors have reported no conflict of interest in this work.
References
1. DeFronzo RA, Ferrannini E. Insulin resistance. A multifaceted syndrome responsible for NIDDM, obesity, hypertension, dyslipidemia, and atherosclerotic cardiovascular disease. Diabetes Care. 1991;14: 173–194.
2. Hotamisligil GS. Mechanisms of TNF-alpha-induced insulin resistance. Exp Clin Endocrinol Diabetes. 1999;107:119–125.
3. Steppan CM, Bailey ST, Bhat S, et al. The hormone resistin links obesity to diabetes. Nature. 2001;409:307–312.
4. Bjorntorp P. “Portal” adipose tissue as a generator of risk factors for cardiovascular disease and diabetes. Arteriosclerosis. 1990;10: 493–496.
5. Boden G. Role of fatty acids in the pathogenesis of insulin resistance and NIDDM. Diabetes. 1997;46:3–10.
6. Williamson JR. Mechanism for the stimulation in vivo of hepatic gluconeogenesis by glucagon. Biochem J. 1966;101:11C–14C 7. Xu J, Nakamura MT, Cho HP, Clarke SD. Sterol regulatory element
binding protein-1 expression is suppressed by dietary polyunsaturated fatty acids. A mechanism for the coordinate suppression of lipogenic genes by polyunsaturated fats. J Biol Chem. 1999;274:23577–23583. 8. Oakes ND, Bell KS, Furler SM, et al. Diet-induced muscle insulin
resistance in rats is ameliorated by acute dietary lipid withdrawal or a single bout of exercise: parallel relationship between insulin stimulation of glucose uptake and suppression of long-chain fatty acyl-CoA. Diabetes. 1997;46:2022–2028.
International Journal of General Medicine downloaded from https://www.dovepress.com/ by 118.70.13.36 on 22-Aug-2020
International Journal of General Medicine
Publish your work in this journal
Submit your manuscript here: http://www.dovepress.com/international-journal-of-general-medicine-journal
The International Journal of General Medicine is an international, peer-reviewed open-access journal that focuses on general and internal medicine, pathogenesis, epidemiology, diagnosis, monitoring and treat-ment protocols. The journal is characterized by the rapid reporting of reviews, original research and clinical studies across all disease areas.
A key focus is the elucidation of disease processes and management protocols resulting in improved outcomes for the patient.The manu-script management system is completely online and includes a very quick and fair peer-review system. Visit http://www.dovepress.com/ testimonials.php to read real quotes from published authors. Dovepress
Dove
press
hepatic insulin signaling in obesity
9. Mittleman SD, Van Citters GW, Kim SP, et al. Longitudinal compensation for fat-induced insulin resistance includes reduced insulin clearance and enhanced beta-cell response. Diabetes. 2000;49: 2116–2125. 10. Michael MD, Kulkarni RN, Postic C, et al. Loss of insulin signaling in
hepatocytes leads to severe insulin resistance and progressive hepatic dysfunction. Mol Cell. 2000;6:87–97.
11. Marchesini G, Babini M. Non-alcoholic fatty liver disease and metabolic syndrome. Minerva Cardioangiol. 2006;54:229–239.
12. Imhof A, Kratzer W, Boehm B, et al. Prevalence of non-alcoholic fatty liver and characteristics in overweight adolescents in the general population. Eur J Epidemiol. 2007;22:889–897.
13. Brunt EM, Janney CG, Di Bisceglie AM, Neuschwander-Tetri BA, Bacon BR. Nonalcoholic steatohepatitis: a proposal for grading and staging the histological lesions. Am J Gastroenterol. 1999;94: 2467–2474.
14. Sparks JD, Sparks CE. Insulin regulation of triacylglycerol-rich lipoprotein synthesis and secretion. Biochim Biophys Acta. 1994; 1215:9–32.
15. Zammit VA. Use of in vivo and in vitro techniques for the study of the effects of insulin on hepatic triacylglycerol secretion in different insulinaemic states. Biochem Soc Trans. 2000;28:103–109.
16. Starzl TE, Watanabe K, Porter KA, Putnam CW. Effects of insulin, glucagon, and insulin/glucagon infusions on liver morphology and cell division after complete portacaval shunt in dogs. Lancet. 1976; 1:821–825.
17. Anai M, Funaki M, Ogihara T, et al. Altered expression levels and impaired steps in the pathway to phosphatidylinositol 3-kinase activation via insulin receptor substrates 1 and 2 in Zucker fatty rats. Diabetes. 1998;47:13–23.
18. Friedman JE, Ishizuka T, Liu S, et al. Reduced insulin receptor signaling in the obese spontaneously hypertensive Koletsky rat. Am J Physiol. 1997;273:E1014–E1023.
19. Saad MJ, Araki E, Miralpeix M, Rothenberg Pl, White MF, Kahn CR. Regulation of insulin receptor substrate-1 in liver and muscle of animal models of insulin resistance. J Clin Invest. 1992;90:1839–1849. 20. Sesti G, Federici M, Hribal ML, Lauro D, Sbraccia P, Lauro R. Defects
of the insulin receptor substrate (IRS) system in human metabolic disorders. FASEB J. 2001;15:2099–2111.
21. Rother KI, Imai Y, Caruso M, Beguinot F, Formisano P, Accili D. Evidence that IRS-2 phosphorylation is required for insulin action in hepatocytes. J Biol Chem. 1998;273:17491–17497.
22. Valverde AM, Burks DJ, Fabregat I, et al. Molecular mechanisms of insulin resistance in IRS-2-deficient hepatocytes. Diabetes. 2003; 52:2239–2248.
23. Kim YB, Peroni OD, Franke TF, Kahn BB. Divergent regulation of Akt1 and Akt2 isoforms in insulin target tissues of obese Zucker rats. Diabetes. 2000;49:847–856.
24. Li J and Billiar TR. Nitric Oxide. IV. Determinants of nitric oxide pro-tection and toxicity in liver. Am J Physiol. 1999;276:G1069–G1073. 25. McNaughton L, Puttagunta L, Martinez-Cuesta MA, et al. Distribution
of nitric oxide synthase in normal and cirrhotic human liver. Proc Natl Acad Sci U S A. 2002;99:17161–17166.
26. Fatani SH, Naderali EK, Panchiani S, Shah S, Wong C. The effects of dietary obesity on protein expressions of insulin signaling pathway in rat aorta. Drug Discov Ther. 2008;2:254–261.
27. McCurdy CE, Davidson RT, Cartee GD. Brief calorie restriction increases AKt2 phosphorylation in insulin-stimulated rat skeletal muscle. Am J Physiol Endocrinol Metab. 2003;285:693–700. 28. Gauthier MS, Favier R, Lavoie JM. Time course of the development
of non-alcoholic hepatic steatosis in response to high-fat diet-induced obesity in rats. Br J Nutr. 2006;95:273–281.
29. Li Z, Yang S, Lin H, et al. Probiotics and antibodies to TNF inhibit inflammatory activity and improve non-alcoholic fatty liver disease. Hepatology. 2003;37:343–350.
30. Uchihara M, Izumi N. High-sensitivity C-reactive protein (hs-CRP): a promising biomarker for the screening of nonalcoholic steatohepatitis (NASH). Nippon Rinsho. 2006;64:1133–1138.
31. Yang SQ, Lin HZ, Mandal AK, Huang J, Diehl AM. Disrupted signaling and inhibited regeneration in obese mice with fatty livers: implications for nonalcoholic fatty liver disease pathophysiology. Hepatology. 2001;34(4 Pt 1):694–706.
32. Yang SQ, Li Y, Lin HZ, Gabrieson K, Trush MA, Diehl AM. Mitochondrial adaptations to obesity-related oxidant stress. Arch Biochem Biophys. 2000;378:259–268.
33. Lee FY, Li Y, Zhu H, et al. Tumor necrosis factor increases mitochondrial oxidant production and induces expression of uncoupling protein-2 in the regenerating rat liver. Hepatology. 1999;29:677–687. 34. Bost F, McKay R, Dean N, Mercola D. The JnK kinase/stress-activated protein kinase pathway is required for epidermal growth factor stimulation of growth of human A549 lung carcinoma cells. J Biol Chem. 1997;272:33422–33429.
35. Saxena NK, Titus MA, Ding X, et al. Leptin as a novel profibrogenic cytokine in hepatic stellate cells: mitogenesis and inhibition of apoptosis mediated by extracellular regulated kinase (Erk and Akt phosphorylation). FASEB J. 2004;18:1612–1614.
36. Naderali EK, Fatani S, Telles M, Hunter L. The effects of physiological and pharmacological weight loss on adiponectin and leptin mRNA levels in the rat epididymal adipose tissue. Eur J Pharmacol. 2008;579:433–438.
37. Palmer M, Schaffner F. Effect of weight reduction on hepatic abnormalities in overweight patients. Gastroenterology. 1990;99: 1408–1413.
38. Hickman IJ, Jonsson JR, Prins JB, et al. Modest weight loss and physical activity in overweight patients with chronic liver disease results in sustained improvements in alanine aminotransferase, fasting insulin, and quality of life. Gut. 2004;53:413–419.
39. Ip E, Farrell GC, Robertson G, Hall P, Kirsch R, Leclercq I. Central role of PPARalpha-dependent hepatic lipid turnover in dietary steatohepatitis in mice. Hepatology. 2003;38:123–132.
40. Nagasawa T, Inada Y, Nakano S, et al. Effects of bezafibrate, PPAR pan-agonist, and GW501516, PPARdelta agonist, on development of steatohepatitis in mice fed a methionine- and choline-deficient diet. Eur J Pharmacol. 2006;536:182–191.
International Journal of General Medicine downloaded from https://www.dovepress.com/ by 118.70.13.36 on 22-Aug-2020