DOI:10.1051/epjconf/20159401037
c
Owned by the authors, published by EDP Sciences, 2015
Effect of strain rate on bake hardening response of BH220 steel
Anindya Das1,a, Soumitro Tarafder1, S. Sivaprasad1, and Debalay Chakrabarti2 1MST Division, CSIR-National Metallurgical Laboratory, Jamshedpur, India
2Metallurgical and Materials Engineering Department, IIT Kharagpur, Kharagpur, India
Abstract. This study aims at understanding the bake hardening ability of ultra low carbon BH220 steel at different strain rates. The as-received material has been pre-strained to four different levels and then deformed in tension under (a) as pre-strained state and (b) after baking at 170◦C for 20 minutes, at three different strain rates of 0.001, 0.1 and 100/s. In both the conditions, yield stress increased with pre-strain and strain rate, but bake hardening ability was found to decrease when strain rate was increased. The strain rate sensitivity of the material was also found to decrease with bake hardening. Generation of dislocation forests and their subsequent immobility during baking treatment enables them to act as long range obstacles during further deformation. At higher strain rates, less amount of dislocations are produced which can interact with themselves and produce hardening, because of which bake hardening ability and the strain rate drops. A dislocation based strengthening model, as proposed by Larour et al. 2011 [7], was used to predict the yield stress values obtained at different conditions. The equation produced excellent co-relation with the experimental data.
1. Introduction
Bake hardenable steels are popular grades in automobile industries due to their high strength to weight ratio and excellent formability. Generally, these steels are used in the outer body panels of the automobiles. The fabrication involves a cold forming process to get the required shape followed by an industrial paint baking cycle (170◦C for 20 minutes). The later process imparts an improved dent resistance of the component [1]. Cold deformation is essentially a pre-straining process during which fresh dislocations are produced. During baking process these dislocations are pinned down by the interstitial atoms by forming Cottrell atmosphere, thus providing an enhancement in strength during subsequent deformation through strain ageing phenomena [2].
This process of bake hardening is greatly influenced by the concentration of solute atoms, pre-strain levels, time and temperature of ageing, grain size of the material etc. The solute concentration helps in forming the Cottrell atmosphere over the generated dislocation cores, and the bake hardening ability increases if the solute concentration is increased up to a critical level where the Cottrell atmosphere tends to saturate [3]. Beyond the saturation limit, bake hardenability drops. Similar trend is also observed in case of pre-strain level, time and temperature of the ageing process [1,4,5]. On further increasing the solute concentration or ageing time and temperature, carbides starts precipitating which again increase the bake hardenability [4].
The bake hardening ability of these ultra low carbon steels is often quantified at quasi-static rates. But the nature of deformation is subjected to change when these components experience dynamic rate of loading, like in events of crash. This particular aspect has not been
aCorresponding author:anindyadvc@gmail.com
studied well and the available literature is scanty. This investigation aims at understanding the effects of strain rate on pre-strained as well as bake hardened ultra low carbon BH220 steel. The selected material, BH220 was obtained as sheets of 0.6 mm thickness and possesses 0.0027 wt.% carbon in the matrix. The steel showed a ferritic structure (Fig. 1), with an average grain size of 33.75+2.3µm.
2. Experimental design
Tensile specimens of 30 mm gauge length (ASTM E8M) were prepared from the as-received material along the rolling direction, to obtain the basic tensile properties as well as to decide the pre-strain levels. Tensile tests were performed at nominal strain rate of 0.001/s. Pre-strain levels of 2, 4, 6 and 8% were selected for the current study, since these levels fall within the hardening region of the plastic deformation portion, as shown in Fig.2.
After pre-straining, one set of specimens (designated: PS) were directly pulled in tension at three different strain rates (0.001, 0.1 and 100/s).
The second pre-strained set of samples were aged at 170◦C for 20 minutes (designated: PS+BAK), and then pulled in tension at the same strain rates (0.001, 0.1 and 100/s). Tensile tests at 0.001 and 0.1/s strain rates were performed in a quasi-static servo-hydraulic test system, whereas the tests at 100/s were performed in a special high speed servo-hydraulic test system. The specimen design for all the tests are shown in Fig.3.
3. Results and discussions
3.1. Tensile and bake hardening properties
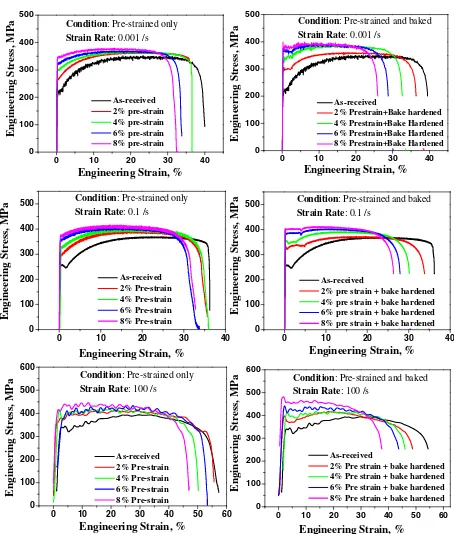
The engineering stress-strain curves corresponding to PS and PS+BAK conditions, at three different strain rates
Figure 1.Microstructure of BH220 steel.
0 4 8 1 2 1 6 2 0 2 4 2 8 3 2 3 6 4 0 0
5 0 1 0 0 1 5 0 2 0 0 2 5 0 3 0 0 3 5 0 4 0 0 4 5 0
Engineering Stress, MPa
E n g in ee r in g S tr a in , %
T en sile P ro p erty o f B H 2 2 0 steel a t 0 .0 0 1 /s
Pre-strain l
evels
Figure 2.Tensile property of BH220 steel and the strain range selected for pre-straining deformation.
(a)
(b)
Figure 3.Specimen dimensions used for tensile deformation at (a) 0.001 and 0.1/s strain rate, and (b) 100/sAll dimensions are in mm.
are shown in Fig. 4. The tensile curves for PS do not show any yield point effect unlike that of PS+BAK. This is because, in as pre-strained condition, the generated dislocations remain free and experience no obstacle as in the case after bake hardening. The solute atoms lock the dislocations during bake hardening of the material after pre-straining, which needs a critical stress to get unlocked while deforming. This process of unlocking produces the enhanced yield point phenomenon. This critical stress required to unlock the pinned dislocations in bake hardened condition is much larger than the stress required to move the mobile dislocations in as pre-strained material. Thus the yield stress for bake hardened condition is higher than that of as pre-strained material. In Fig.5, the variation of yield stress is shown with pre-strain and strain rate for both PS and PS+BAK conditions. Yield stress increases with both pre-strain level and strain rate.
To understand the bake hardening ability of the material, the difference in yield stress has been calculated for bake hardened condition with as-received as well as
0 10 20 30 40
0 100 200 300 400 500
Condition: Pre-strained only
Strain Rate: 0.001 /s
E n gin ee ri ng St re ss , MPa
Engineering Strain, %
As-received 2% pre-strain 4% pre-strain 6% pre-strain 8% pre-strain
0 10 20 30 40
0 100 200 300 400 500 En gi n eer in g Stre ss, MPa
Engineering Strain, %
As-received 2% Prestrain+Bake hardened 4% Prestrain+Bake Hardened 6% Prestrain+Bake Hardened 8% Prestrain+Bake Hardened
Condition: Pre-strained and baked
Strain Rate: 0.001 /s
0 10 20 30 40
0 100 200 300 400
500 Condition: Pre-strained only
Strain Rate: 0.1 /s
E n gineerin g Stres s, MPa
Engineering Strain, %
As-received 2% Pre-strain 4% Pre-strain 6% Pre-strain 8% Pre-strain
0 10 20 30 40
0 100 200 300 400
500 Condition: Pre-strained and baked
Strain Rate: 0.1 /s
Engineeri
ng Stress, MPa
Engineering Strain, %
As-received
2% pre strain + bake hardened 4% pre strain + bake hardened 6% pre strain + bake hardened 8% pre strain + bake hardened
0 10 20 30 40 50 60 0 100 200 300 400 500 600
Condition: Pre-strained only
Strain Rate: 100 /s
E n gi ne er in g Stre ss , MPa
Engineering Strain, %
As-received 2% Pre-strain 4% Pre-strain 6% Pre-strain 8% Pre-strain
0 10 20 30 40 50 60 0 100 200 300 400 500 600
Condition: Pre-strained and baked
Strain Rate: 100 /s
Engin ee rin g S tress, MP a
Engineering Strain, %
As-received
2% Pre strain + bake hardened 4% Pre strain + bake hardened 6% Pre strain + bake hardened 8% Pre strain + bake hardened
Figure 4. Engineering stress-strain curves obtained after pre-straining and pre-strain with baking at 3 different strain rates.
0 2 4 6 8
200 250 300 350 400 450 500 Eng inee ri n g St re ss, M P a Pre-strain, % 0.001 /s 0.1 /s 100 /s Pre-strained
0 2 4 6 8
200 250 300 350 400 450 500 Engineering Str ess, M P a Pre-strain, % 0.001 /s 0.1 /s 100 /s Pre-strained and baked
Figure 5. Yield stress values obtained after tensile deforming BH220 in as-received, PS and PS+BAK condition.
Bake hardening
(BH)
Engineering Stress,
MPa
E ngineering Strain, %
∆ YS (a ft e r ba ki n g ) As-received
Pre-strained follow ed by tensile
P re-strained and baked followed by tensile
Figure 6.Schematic of different parameters.
with pre-strained material (as shown in Fig.6), at each pre-strain level and pre-strain rate.
The difference in yield stress between bake hardened and as-received state is designated as YS and BH for the difference between bake hardened with its only pre-strained condition.
0 2 4 6 8 10 0
50 100 150 200
∆
YS
, MP
a
Pre-strain, %
0.001 /s 0.1 /s 100 /s
Variation of∆YS with pre-strain and strain rate
Figure 7.Variation ofYS with pre-strain and strain rate.
0 2 4 6 8 10
0 10 20 30 40 50 60
Variation ofΒΗ with pre-strain and strain rate
Bake hardening (BH),
MPa
Pre-strain, %
0.001 /s 0.1 /s 100 /s
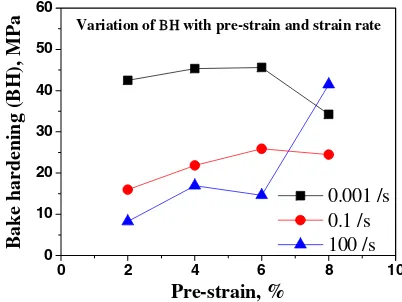
Figure 8.Variation of BH with pre strain and strain rate.
particular strain level. The variation of BH with pre-strain (Fig.8) is also similar to that ofYS except that the BH values tend to drop for pre-strain >6% for the quasi-static strain rates, but increase sharply after 6% pre-strain for high strain rate deformation. Pre-straining beyond 6%, tends to reduce the dislocation density since the dislocation annihilation mechanisms may start beyond that point. Due to the reduced dislocation density, fewer dislocations are getting locked at highest pre-strain levels. In other words, more free solute atoms remain in the matrix when bake hardening is done at the 8% pre-strain level. As strain rate increases, the fresh dislocations produced during deformation also gets locked by the free solute atoms, and the bake hardening ability or BH increases. But overall, the BH value decreases as the strain rate is increased. This is because, with pre-straining, dislocation forests are produced which will increase with the pre-strain magnitude. After bake hardening, the subsequent locking of the dislocations in the forest by solute atoms will restrict the mobility of these dislocation forests produced and ultimately these will act as long range barriers during further deformation. As strain rate increases during further deformation, less amount of fresh dislocations are produced due to less amount of available time for deformation, which can interact with themselves and can produce the hardening.
10-4 10-3 10-2 10-1 100 101 102 103
5 10 15 20 25 30 35
β
valu
e
Strain rate, /s
As-received 2% Pre-strain+baking 4% Pre-strain+baking 6% Pre-strain+baking 8% Pre-strain+baking
Figure 9.Variation of strain rate sensitivity with strain rate for as-received and bake hardened condition.
3.2. Strain rate sensitivity after bake hardening
Along with BH value, bake hardening also reduces the strain rate sensitivity of the material, as shown in Fig.9. Semi-logarithmic strain rate sensitivity (β) was calculated on yield stress at all strain rates for as-received and PS+BAK condition using the following equation:
β = ∂σ
∂(log ˙ε) (1)
where,σ is the yield stress value and ˙εis the strain rate. The strain rate sensitivity increases with strain rate at all conditions but, the magnitude of this increase is more for the as-received condition compared to the bake hardened condition. In case of as-received material, the strength of the material is purely derived due to dislocation generation and its interaction with the interstitials during deformation. When the strain rate is increased, dislocation density increases and more dislocations interact with solute atoms which in turn increase the strength. The higher strain rate sensitivity for as-received material suggests that there is an increase in the contribution of thermally activated dislocation processes to the overall stress required for dislocation movement [6] and thus at high strain rates the properties are dominated by the stress for individual dislocation movement. In case of bake hardening, the solute atoms are tied to the dislocations generated during pre-straining prior to the post baking deformation. The newly formed dislocations during the post baked deformation will have less chance of interacting with the solute atoms and would be available as free mobile dislocations. Thus even if the strain rate is increased, the hardening due to solute or dislocation-dislocation interaction reduces leading to a lower strain rate sensitivity.
3.3. Experimental vs. mathematical form of yield stress during bake hardening
Table 1.Model parameters obtained for different conditions.
As-received Only pre-strain Bake hardened
Pre-strain 2% 4% 6% 8% 2% 4% 6% 8%
σi(MPa) 213.8 303.78 328.95 366.58 378.42 269.584 295.084 323.32 347.12
σ∗
0(MPa) 612.86 336.52 321.55 336.33 336.45 463.54 406.74 273.54 244.73
˙
ε0(s−1) 1.005E8 1.005E8 1.005E8 1.005E8 1.005E8 1.005E8 1.005E8 1.005E8 1.005E8
G0 1.21E-19 1.21E-19 1.21E-19 1.21E-19 1.21E-19 1.21E-19 1.21E-19 1.21E-19 1.21E-19
m’ 2.21597 2.21597 2.21597 2.21597 2.21597 2.21597 2.21597 2.21597 2.21597
due to long range obstacles [7] as given below.
σ =σi +σ∗=σi,0.
G(T)
G(0K) +σ
∗(T,ε˙) (2)
where G(T): temperature dependent shear modulus, T: temperature, ˙ε: strain rate,σi,0: athermal stress component
at zero thermal activation. Since, all the investigations have been made at room temperature (28◦C), the temperature dependency of the athermal flow stress componentσi has
been neglected in Eq. (2). The Eq. (2) reduces to,
σ =σi,0+σ∗(T,ε˙). (3)
According to Larour, [7],
σ∗(T,ε˙)=σ∗
0.
1−
k.T.ln
˙
ε0
˙
ε
G0
m
(4)
where, σ0∗: effective stress at zero thermal activation, ˙ε: critical strain rate or pre-exponential factor, G0: free
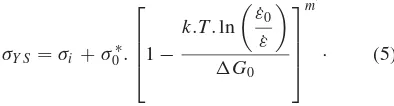
energy required to overcome the obstacle without the help of thermal activation (G=0), m’ is strain rate exponent. Substituting Eq. (4) in Eq. (3), the expression for yield strength can be written as:
σY S =σi +σ0∗.
1−
k.T.ln
˙
ε0
˙
ε
G0
m
· (5)
The equation has been used to model the YS variation observed in this investigation. Initial values of model parameters have been taken from the literature [8], and the parameters have been tuned for the convergence. The critical strain rate (˙ε0), G0 and strain rate exponent
(m’) have been kept constant in all the cases, since these thermal activation parameters are specific to the material, independent of their condition [9]. The fitting procedure produced a goodness of fit of more than 90% in all the cases. The experimentally obtained and modelled yield stress of PS and PS+BAK condition are shown in Figs.10
and11respectively. The experimental and modelled yield strength values match reasonably well in all the conditions. Table 1 lists the model parameters obtained at different conditions. For as-received material the athermal flow stress componentσi is very high for PS when compared
to PS+BAK condition. But it increases with increase in
1E-3 0.01 0.1 1 10 100 1000 10000
200 250 300 350 400 450
As-received 8% Pre-strain 6% Pre-strain 4% Pre-strain
Yield Stress
, M
P
a
Strain Rate, /s Pre-strain
---Experimental
--- Model
2% Pre-strain
Figure 10.Experimental and predicted yield stress values of only pre-strained material at various strain rate.
1E-3 0.01 0.1 1 10 100 1000 10000
200 250 300 350 400 450 500
8% PS+baked
6% PS+baked 4% PS+baked 2% PS+baked
Yiel
d stre
ss, MPa
Strain Rate, /s
Pre-strain + Baked Condition
---Experimental
---Model
As-received
Figure 11.Experimental and predicted yield stress values of bake hardened condition at various pre-strain and strain rate.
pre-strain in both only pre-strained and pre-strain with bake hardened conditions. This stress due to long range obstacle can be attributed to the dislocation forest which is generating during pre-straining process, which also increase as the pre-strain range is increased.
4. Conclusion
References
[1] S. Berbenni, V. Favier, X. Lemoine, M. Berveiller, Scripta Materialia,51(2004)
[2] A. H. Cottrell, B. A. Bilby; Proc. of Phys Society A, 62 (1949)
[3] S. Hanai, N. Takemoto, Y. Tokunaga and Y. Mizuyama; Trans ISIJ, 24 (1984)
[4] P. Elsen and H. P. Hougardy; Steel Research (64) (1993)
[5] A. K. De, S. Vandeputte and B. C. De Cooman; Scripta Materialia,41(1999)
[6] R.S. Kircher, A. K. De, D. K. Matlock, J. G. Speer, MS&T conference proceedings (2004)
[7] P. Larour, K. Dahmen, W. Bleck, Steel research Int.82 (2011)