Article
Variation of the Performance of Machine-Learning
Based Image Classifier in Automated Detection of
Itch-Induced Scratch
Chuan Liu1,2,†, Sheng-Xiang Yan1,†, Xiao-Bo Wu1, Zhi-Jun Zhang3, Wei Li4∗
1 Institute of Special Environmental Medicine, Institute of Pain Medicine, Nantong University, No. 9, Seyuan
Road, Nantong City, Jiangsu Province, P. R. China
2 College of Medicine and Health, Lishui University, No. 1, Xueyuan Road, Lishui City, Zhejiang province, P.
R. China
3 School of Medicine, Nantong University, No. 19, Qixiu Road, Nantong City, Jiangsu Province, P. R. China
4 Institute of Special Environmental Medicine, Institute of Nautical Medicine, Nantong University, No. 9,
Seyuan Road, Nantong City, Jiangsu Province, P. R. China * Correspondence: [email protected];
† These authors contributed equally to this work.
1
2
3
4
5
6
7
8
9
10
11
12
13
14
15
Abstract: A’littlebrother’ofpain,itchisanunpleasantsensationthatcreatesaspecificurgeto scratch.Todate,variousmachine-learningbasedimageclassifiers(MBICs)havebeenproposedfor quantitativeanalysis of itch-induced scratch behaviourof laboratory animals in an automated, non-invasive, inexpensive and real-time manner. In spite of MBICs’ advantages, the overall performances(accuracy,sensitivityandspecificity)ofcurrentMBICapproachesremainsinconsistent, withtheirvaluesvaryingfrom∼50%to∼99%,forwhichthereasonsunderlyinghaveyettobe investigatedfurther,bothcomputationallyandexperimentally. Tolookintothevariationofthe performanceofMBICsinautomateddetectionofitch-inducedscratch,thisarticlefocusesonthe experimentaldatarecordingstep,andreportshereforthefirsttimethatMBICs’overallperformance is inextricably linked to the sharpness of experimentally recorded video of laboratory animal scratchbehaviour.Thisarticlefurthermoredemonstratesforthefirsttimethatalinearlycorrelated relationshipexistsbetweenvideosharpnessandoverallperformance(accuracyandspecificity,but notsensitivity)ofMBICs,andhighlighttheprimaryroleofexperimentaldatarecordinginrapid, accurateandconsistentquantitativeassessmentoflaboratoryanimalitch.
Keywords: Itch;Scratch;Automatedreal-timedetection;Machine-learningbasedimageclassifier; Imagesharpness
16
1. Introduction 17
Itch is a sensation that causes the desire to scratch [1–3]. In laboratory animal studies, scratch
18
has been used as an objective correlate for quantitative assessment of itch [4–7]. Usually, scratch
19
is counted by human annotators by playing the video back and forth, which is a time-consuming
20
and laborious process with inherent subjectivity in quantitative assessment of laboratory animal
21
itch. To this end, several machine-learning base experimental approaches have been developed to
22
address this issue [8–10]. Very recently, Park and his colleagues [11] reported an automated real-time
23
approach using machine learning-based image classifier (MBIC), which can be of practical use for the
24
quantitative analysis of mouse scratching recorded with commercially available video cameras. This
25
MBIC approach is non-invasive, inexpensive and suitable for objective counting of scratching with
26
overall accuracy similar to or better than existing automated counting methods [11–13]. Moreover, it
27
requires neither an attachment nor a surgical implantation of a device to mouse [11].
28
Nonetheless, MBICs’ overall performances to date still remains inconsistent, including accuracy,
29
sensitivity and specificity [11]. On average, the two-step decision tree (2DT) MBIC approach [11]
30
performs with a sensitivity and specificity of 95.19% and 92.96%, respectively. While its sensitivity
31
ranges from 94.8% to 99.1%, its specificity possesses a wider range from 68.6% to 85.1%, as reported
32
by Park and his colleagues [11]. As for other MBIC approaches, such as support vector machine
33
(SVM), k-nearest neighbour (kNN), convolutional neural network (CNN), recurrent neural network
34
(RNN) and long short-term memory (LSTM), their sensitivities and specificities possess a even wider
35
range from 55% to 97% [11]. In addition to the inconsistency of MBICs’ performances, the reasons
36
underlying have yet to be investigated further, both computationally and experimentally. Since various
37
computational MBIC approaches have been reported already [8], and essentially all machine learning
38
methods possesses an inherent trade-off between specificity and sensitivity that is controlled through
39
the classification threshold, this article therefore chooses to focus on the experimental data recording
40
step, i.e., the primary wet-lab step before any step(s) computational, and aims to investigate the
41
relationship(s) between the MBICs’ overall performances and the sharpness of the laboratory animal
42
scratch video (LASV).
43
2. Materials and Methods 44
2.1. Chemicals and laboratory animals 45
Compound 48/80 (C48/80, Sigma, USA) is a polymer that provokes itch histamine-dependently
46
in both human and mice [14]. Prior to use, Compound 48/80 was dissolved in 150 mM saline (Sichuan
47
Kelun Pharmaceutical Co., Ltd, Sichuan Province, China) and stored at 4 °.
48
All animal-related experimental procedures were approved by Animal Ethical Committee of
49
Nantong University (Jiangsu Province, China). Adult male health C57BL/6 mouse (weight: 24±2 g)
50
were purchased from Laboratory Animal Center of Nantong University, Jiangsu Province, China. All
51
mice were housed singly and were maintained on a 12/12 day/night cycle at 22-25 ° with free access
52
to rodent food and water in environmentally controlled specific pathogen-free (SPF) conditions.
53
2.2. Video recording, processing and preliminary analysis 54
Before LASV recording, a C57BL/6 mouse was placed into a box (dimensions 16 cm x 14 cm x 15
55
cm, Figure1) for 15 minutes to ensure their familiarity with the box environment. Afterwards, the box
56
(Figure1) was cleaned with 70% ethanol and distilled deionized water. Of the LASV recording process,
57
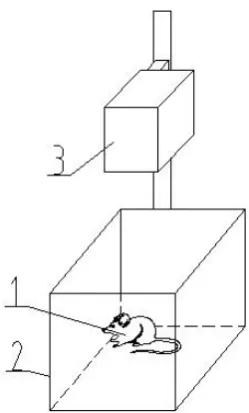
the general experimental setting is illustrated in Figure1briefly as below.
58
1. First, C57BL/6 mice were anesthetized and placed in the box (Figure 1) before an
59
neck-subcutaneous injection of 50µlC48/80 at 2 mg/ml. 60
2. A digital video camera recorder SonyTMHDR-CX405 (Sony Corporation, Japan) was employed
61
to record a set of LASVs (time duration: 40 to 60 minutes) at 25 frames per second (fps) with a
62
1280 x 720 pixel resolution, assuming that the camera is fast enough to capture all scratching
63
behaviors of C57BL/6 mouse [4,15]. By default, the focus is adjusted automatically by the
64
SonyTMHDR-CX405 camera.
65
3. Each C57BL/6 mouse scratch was counted first by human annotators by playing LASVs back
66
and forth, also recorded manually were the time labels (i.e., the beginning point and the ending
67
point) of each set of scratch movements of the C57BL/6 mouse.
68
4. All LASVs were splitted into a series of image sequences with theFFmpegcommand at 10 fps on
69
an in-house Ubuntu machine.
70
5. With a set of in-house python scripts, all LASV images were linked to their respective time
71
labels and manual annotations, i.e.,scratchornon-scratch, for the subsequent training step of the
72
machine-learning image classification processes.
Figure 1.A minimalist sketch of the experimental setting for LASV recording. In this figure, labels 1, 2 and 3 represent the C57BL/6 mouse, the box and the position of the video-recording camera, respectively.
6. The sharpness of every LASV image was quantified as the variance of its Laplacian
74
(supplementary filedetect_blur.py).
75
Given that image sharpness is the focus here, it is necessary to ensure a reasonable scale coverage
76
of the LASV sharpness, representing at least LASVs with high, medium and low degrees of sharpness.
77
Therefore, we manually selected five from all experimentally recorded LASVs, labelled them according
78
to their original file names, namely 305 (high sharpness), 306 (median sharpness), 309 (low sharpness),
79
310 (low sharpness) and 311 (high sharpness), respectively (Table1).
80
2.3. Keras MBIC image classification 81
In total, 135769 LASV images were extracted from the manually selected five videos (Table1). First,
82
the 135769 images were pooled into one directory, and subsequently grouped into two sub-directories
83
according to human annotations (i.e.,scratchornon-scratch), with one sub-directory namedscratch 84
and another namednonscratch, respectively. For the MBIC’s training step, 13650 LASV images
85
(representingscratch) were imported into the open source MBIC software package (implemented
86
in Python with Keras [11]), along with 13650 LASV images (representingnon-scratch) which were
87
randomly selected from the rest of all LASV images. The whole Keras MBIC software package is
88
submitted as a supplementary file, along with its two main python scripts for MBIC image classification
89
(Table2), for which further details of the training and testing steps are included in Tables2and1.
90
Of all 135769 computationally classified LASV images (Table 2), each and every image was
91
subsequently linked to its time label, human annotation (scratchornon-scratch) and automated MBIC
92
annotation (scratchornon-scratch), too. With both manual and computational annotations in place, a
93
set of in-house python scripts were employed to statistically analyze the overall performances of the
94
Keras MBIC approach and their potential relationships with the sharpness of experimentally recorded
95
LASVs.
Video number 305 306 309 310 311 Total Total number of images (X1) 25542 27659 27020 28268 27280 135769
Trained Scratch (X2) 330 2350 3860 5820 1290 13650
Trained Non Scratch (X3) 2786 2834 2644 2526 2860 13650 Trained Total (X4=X2+X3) 3116 5184 6504 8346 4150 27300 Trained Scratch Ratio (X2/X1) 0.0129 0.0849 0.1428 0.2058 0.0472 0.1005 Trained Non-Scratch Ratio (X3/X1) 0.1091 0.1027 0.0978 0.0893 0.1048 0.1005 Trained Total Ratio (X4/X1) 0.1220 0.1876 0.2406 0.2951 0.1520 0.2010
C48/80 injection No Yes Yes Yes Yes Yes
Table 1. Statistics of the LASV images used for the training step of machine-learning based image classification of the five LASVs. For video 305, 150 mM saline was injected subcutaneously to the neck of C57BL/6.
Step Input Python script Output
Training 27300 images train_network.py scratch_not_scratch.model Testing all 135769 images test_network.py scratchornon-scratch
Table 2.Training and testing of the machine-learning based image classification. For the training step, half of the 27300 images were with the manual annotationscratch, the other halfnon-scratch. In this table, all python scripts are submitted as supplementary files.
3. Results 97
3.1. Quantification of the sharpness of LASVs 98
With a preliminary visual inspection of the five LASVs, their sharpness (or blurrinesses) did vary
99
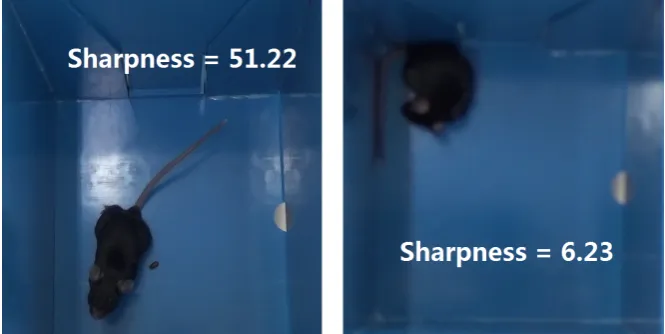
in a manner of both inter- and intra-video, which is briefly illustrated in Figure2with two LASV
100
images.
101
Figure 2.One LASV image with high degree (51.22, left) of sharpness (file name is 311out4381.png) and one LASV image with low degree (6.23, right) of sharpness (file name is 306out11856.png). Here, supplementary filedetect_blur.pywas used to quantify the sharpness of the two LASV images. The original versions of the two cropped and edited LASV images are submitted in supplementary file
supplementary.pdf.
In addition to Figure2, Table3presents a quantitative statistical analysis of the sharpness of the
102
five LASVs, a necessary step for further investigation into its relationship(s) with the Keras MBIC’s
103
overall performances, which are to be described and discussed below in details.
Video name Average Standard deviation Maximum Minimum Sharpness
305 44.38 3.56 67.27 5.27 High
306 34.10 3.13 53.01 6.23 Median
309 29.91 2.67 37.66 6.95 Low
310 28.26 3.08 37.04 8.11 Low
311 41.47 2.16 58.91 12.28 High
Table 3.A statistical analysis of the sharpness of the five LASVs. In this table, the sharpness of each video was quantified as the average and the standard deviation of the sharpness of all 135769 images extracted from the five LASVs, the sharpness of each image was quantified as the variance of its Laplacian.
3.2. Overall performance of the Keras MBIC approach 105
Among all 135769 computationally classified LASV images (Table2), there were a total of 108146
106
(96100 + 12046, Tables 4) images where the computational annotation is the same as its manual
107
counterpart, with an overall accuracy at 79.65%. With a further video-specific analysis (Tables4), it
108
turned out that
109
1. The Keras MBIC approach here performed with accuracies ranging from 57.55% to 97.87%.
110
2. The Keras MBIC approach here performed with sensitivities ranging from 61.52% to 95.58%.
111
3. The Keras MBIC approach here performed with specificities ranging from 48.44% to 98.35%.
112
Overall, these findings align well with the performances of the previously reported MBIC
113
approaches [11], where a range of 55% - 97% was reported for their specificities and the sensitivities of
114
the Keras MBIC approach here.
115
Video number 305 306 309 310 311 Total/Average
Scratch Test True (X5) 203 2100 3587 5394 762 12046
Scratch Test False (X6) 127 250 273 426 528 1604
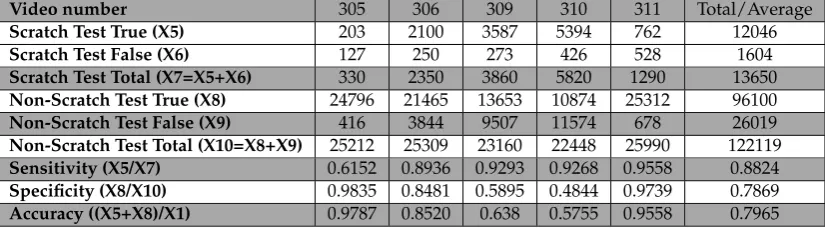
Scratch Test Total (X7=X5+X6) 330 2350 3860 5820 1290 13650 Non-Scratch Test True (X8) 24796 21465 13653 10874 25312 96100 Non-Scratch Test False (X9) 416 3844 9507 11574 678 26019 Non-Scratch Test Total (X10=X8+X9) 25212 25309 23160 22448 25990 122119 Sensitivity (X5/X7) 0.6152 0.8936 0.9293 0.9268 0.9558 0.8824 Specificity (X8/X10) 0.9835 0.8481 0.5895 0.4844 0.9739 0.7869 Accuracy ((X5+X8)/X1) 0.9787 0.8520 0.638 0.5755 0.9558 0.7965 Table 4.Overall performance of the Keras MBIC approach. In this table, X1 is the same as in Tables4. To sum up, this table is combined with Table4as Table 1 in supplementary materialsupplementary.pdf.
With these quantitative video-specific analysis of the Keras MBIC approach’s performances in
116
place, it is now possible to further investigate their potential relationships with LASV sharpness.
117
Here, with a set of in-house python scripts, the overall accuracy, the overall sensitivity and the overall
118
specificity of the five LASVs were plotted against their respective sharpness, as shown in Figures3,4 119
and5.
120
Specifically, Figures3and5demonstrate that the LASV sharpness is a linear correlate of both
121
accuracy and specificity of the Keras MBIC approach here, with two Pearson’s correlation coefficients
122
95.54% and 94.38%, respectively. On the other hand, no linear correlation was detected between LASV
123
sharpness and the sensitivity of the Keras MBIC approach here, as shown in Figure4.
124
To test the importance of specificity in the overall performance of the Keras MBIC approach here,
125
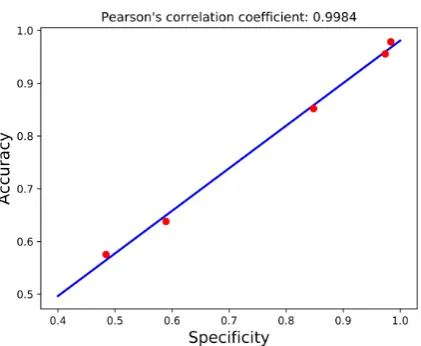
we plotted its accuracy against its specificity and found a strong linear correlation between them with
126
a Pearson’s correlation coefficient of 99.84%, as shown in Figure6.
Figure 3.LASV sharpness influences the accuracy of the Keras MBIC approach in a linearly correlated manner.
Figure 4.LASV sharpness does not influence the sensitivity of the Keras MBIC approach.
Figure 6.A linear correlation of the specificity and the accuracy of the Keras MBIC approach.
4. Variation of the performance of MBICs in automated detection of itch-induced scratch: an 128
experimental perspective 129
While it has been already previously demonstrated that MBIC is a useful tool for automated
130
quantitative assessment of laboratory animal itch [11], and on the fundamental and practical points of
131
view, it also appears true that MBIC accuracy comes with LASV sharpness, no direct experimental
132
study was reported yet as of January 17, 2020 to investigate the relationship between the two factors
133
(i.e., accuracy and LASV sharpness) in a quantitative manner for the use of MBIC in automated
134
detection of itch-induced scratch. Of the Keras MBIC approach here, this article puts forward a set of
135
experimental evidences and reports for the first time that
136
1. LASV sharpness is a linear correlate of its accuracy.
137
2. LASV sharpness is not a linear correlate of its sensitivity.
138
3. LASV sharpness is a linear correlate of its specificity.
139
4. A linear correlation was observed between its specificity and accuracy.
140
5. No linear correlation was observed between its sensitivity and accuracy.
141
In addition to accuracy, sensitivity and specificity of the overall performance of MBICs, this article
142
also highlights the importance of reproducibility and consistency of the overall performance of MBICs,
143
which are just as important in rapid and accurate analysis of scratching for preclinical studies and high
144
throughput drug screening for diseases like atopic dermatitis [16,17].
145
5. LASV blurriness: why and what to do next? 146
As discussed above, this article focuses on the primary wet-lab step, for which the experimental
147
recording of LASVs is the weakest link in the loop. With a close naked-eye inspection of the five
148
LASVs, we ask this questions: what makes the sharpness of all 135769 LASV images different from one
149
another, both intra- and inter-video, as shown in Figure2and Table3? To answer itr, we eyed on the
150
experimental data recording step again, and boiled it down to two things: initial experimental setting
151
and auto-focus of the video recording camera, for the accuracy and the precision of the focus of the
152
video camera on C57BL/6 mouse, respectively.
153
1. The initial experimental setting (Figure1) for LASV recording is fundamentally involved in the
154
image quality of LASVs,
155
(a) because the video camera must be told accurately where to focus first before LASV recording,
156
otherwise it will be difficult for the camera to achieve satisfactory focus on the subject (i.e.,
157
C57BL/6 mouse), and the camera therefore might give up on the automated adjustment
of the focus, resulting in failed auto-focus [18]. That is, the initial experimental setting
159
(Figure1) needs to be as accurate as possible, as it is the first step of LASV recording, hence
160
the primary determinant for LASV sharpness.
161
(b) Therefore, with the statistical analysis and the discussion above, we call for the establishment
162
of a universal standard for the initial experimental setting, including all necessary
163
parameters, such as the size and the color of the box (Figure 1), the position of the
164
camera (Figure1), the manufacturer of the camera, LASV recording frequency, LASV image
165
resolution/size, etc. With this universal standard in place, it becomes possible to compare
166
the results obtained with video sequences of varying (but constant) qualities to clearly
167
determine the minimum level of LASV sharpness to apply MBIC to detect itch-induced
168
scratch.
169
(c) In the long run furthermore, with such a universal standard, the MBIC training step will
170
produce a universally applicablescratch_not_scratch.model(Table2),too, as an input for the
171
MBIC testing step directly, and thereby strengthening the efficiency and the consistency and
172
the reproducibility of MBIC-based automated detection of itch-induced scratch [19,20].
173
2. The focus of SonyTMHDR-CX405 on C57BL/6 mouse is also inextricably linked to the image
174
quality of LASVs, as by default the focus is adjusted automatically by the SonyTMHDR-CX405
175
video camera. In general, there are four factors affecting the auto-focus performance of a camera:
176
light level (level of illumination), subject contrast, camera motion and subject motion. Moreover,
177
these factors are not independent; in other words, one may be able to achieve autofocus even for
178
a dimly lit subject if that same subject also has extreme contrast, or vice versa [18].
179
(a) For LASV recording, we suggest an anti-vibration [7] disturbance-free laboratory area with
180
appropriate light level, where no laboratory member walks by the box and the camera
181
(Figure1) every now and then, to avoid light level variation and enhance the autofocus
182
performance of the video camera. Furthermore, we also suggest the use of appropriate
183
LASV recorders and video acquisition settings in the application of MBIC in automated
184
detection of itch-induced scratch.
185
(b) Supplementary fileanimate.gifincluded a truncated LASV built with three consecutive
186
frames extracted from video 311, namely 311out85.png, 311out86.png and 311out87.png,
187
representing the image of laboratory animal at 8.5, 8.6 and 8.8 seconds, respectively. The
188
0.3-second-longanimate.gifis a clear representation that when a mouse scratches, it stands
189
on one of its hind paws and uses another one of its hind paws to scratch its neck where
190
C48/80 was injected, and that the subject contrast is strong enough for both naked-eye and
191
MBIC to tell whether the mouse is scratching its neck or not at certain time point.
192
(c) As shown in Figure1, the position of the camera is set from the beginning, camera motion
193
is therefore not an issue for the Keras MBIC approach here.
194
(d) Mouse scratching can happen at ten times per second or more [3,6], which is a rather fast
195
movement compared to the time (usually a fraction of a second [18]) necessary for one
196
automated adjustment of the focus by the video camera. While most commonly available
197
30 fps video cameras are equipped with image sensors fast enough to clearly record these
198
scratch behaviour [15,18], chances are that those recorded LASV images blur because the
199
mouse scratches its neck too fast for the video camera to achieve a satisfactory focus on the
200
subject and to clearly record each and every scratch movement of the mouse. To address this
201
subject motion issue, further hardware improvements might be necessary for the autofocus
202
sensor of LASV recording cameras.
203
Acknowledgments: We thank the National Supercomputing Center in Wuxi (Jiangsu Province, China) for both 204
training and testing with the Keras software package for machine-learning based image classifications. 205
Author Contributions: Conceptualization, W.L.; methodology, W.L.; software, W.L.; validation, W.L.; formal 206
analysis, Z.Z., W.L.; investigation, C.L. and S.Y.; resources, W.L.; data curation, W.L.; writing–original draft 207
preparation, W.L.; writing–review and editing, X.W., W.L.; visualization, W.L.; supervision, W.L.; project 208
Funding:This research received no external funding. 210
Conflicts of Interest:The author declares no conflict of interest. 211
212
1. Nie, Y.; Ishii, I.; Yamamoto, K.; Orito, K.; Matsuda, H. Real-time scratching behavior quantification 213
system for laboratory mice using high-speed vision.Journal of Real-Time Image Processing2009,4, 181–190. 214
doi:10.1007/s11554-009-0111-7. 215
2. Namer, B.; Reeh, P. Scratching an itch.Nature Neuroscience2013,16, 117–118. doi:10.1038/nn.3316. 216
3. Elliott, P.; G’Sell, M.; Snyder, L.M.; Ross, S.E.; Ventura, V. Automated acoustic detection of mouse scratching. 217
PLOS ONE2017,12, e0179662. doi:10.1371/journal.pone.0179662. 218
4. Ishii, I.; Kurozumi, S.; Orito, K.; Matsuda, H. Automatic Scratching Pattern Detection for Laboratory Mice 219
Using High-Speed Video Images.IEEE Transactions on Automation Science and Engineering2008,5, 176–182. 220
doi:10.1109/tase.2007.902868. 221
5. Ehling, S.; Butler, A.; Thi, S.; Ghashghaei, H.T.; Bäumer, W. To scratch an itch: Establishing a mouse 222
model to determine active brain areas involved in acute histaminergic itch. IBRO Reports2018,5, 67–73. 223
doi:10.1016/j.ibror.2018.10.002. 224
6. Orito, K.; Chida, Y.; Fujisawa, C.; Arkwright, P.; Matsuda, H. A new analytical system for 225
quantification scratching behaviour in mice. British Journal of Dermatology 2004, 150, 33–38. 226
doi:10.1111/j.1365-2133.2004.05744.x. 227
7. Brash, H.; McQueen, D.; Christie, D.; Bell, J.; Bond, S.; Rees, J. A repetitive movement detector used 228
for automatic monitoring and quantification of scratching in mice. Journal of Neuroscience Methods2005, 229
142, 107–114. doi:10.1016/j.jneumeth.2004.08.001. 230
8. Smith, M.P.; Ly, K.; Thibodeaux, Q.; Weerasinghe, T.; Wu, J.J.; Yosipovitch, G.; Bhutani, T.; Liao, W. 231
Emerging Methods to Objectively Assess Pruritus in Atopic Dermatitis. Dermatology and Therapy2019, 232
9, 407–420. doi:10.1007/s13555-019-0312-3. 233
9. Salem, G.; Krynitsky, J.; Hayes, M.; Pohida, T.; Burgos-Artizzu, X. Three-Dimensional Pose Estimation 234
for Laboratory Mouse From Monocular Images. IEEE Transactions on Image Processing2019,28, 4273–4287. 235
doi:10.1109/tip.2019.2908796. 236
10. Tarrasón, G.; Carcasona, C.; Eichhorn, P.; Pérez, B.; Gavaldà, A.; Godessart, N. Characterization of the 237
chloroquine-induced mouse model of pruritus using an automated behavioural system. Experimental
238
Dermatology2017,26, 1105–1111. doi:10.1111/exd.13392. 239
11. Park, I.; Lee, K.; Bishayee, K.; Jeon, H.J.; Lee, H.; Lee, U. Machine-Learning Based Automatic 240
and Real-time Detection of Mouse Scratching Behaviors. Experimental Neurobiology 2019, 28, 54. 241
doi:10.5607/en.2019.28.1.54. 242
12. Reich, A.; Szepietowski, J.C. Diagnostic Procedures of Itch. InItch - Management in Clinical Practice; S. 243
Karger AG, 2016; pp. 24–28. doi:10.1159/000446013. 244
13. Su, X.Y.; Chen, M.; Yuan, Y.; Li, Y.; Guo, S.S.; Luo, H.Q.; Huang, C.; Sun, W.; Li, Y.; Zhu, M.X.; Liu, M.G.; 245
Hu, J.; Xu, T.L. Central Processing of Itch in the Midbrain Reward Center. Neuron2019,102, 858–872.e5. 246
doi:10.1016/j.neuron.2019.03.030. 247
14. Wahlgren CF, Hägermark O, B.R. Patients’ perception of itch induced by histamine, compound 48/80 and 248
wool fibres in atopic dermatitis. Acta Dermato-Venereologica1991,71, 488–494. 249
15. Lu, Y.; Wong, T.T.W.; Chen, F.; Wang, L. Compressed Ultrafast Spectral-Temporal Photography. Physical
250
Review Letters2019,122. doi:10.1103/physrevlett.122.193904. 251
16. Umeda, K.; Noro, Y.; Murakami, T.; Tokime, K.; Sugisaki, H.; Yamanaka, K.; Kurokawa, I.; Kuno, K.; Tsutsui, 252
H.; Nakanishi, K.; Mizutani, H. A novel acoustic evaluation system of scratching in mouse dermatitis: 253
Rapid and specific detection of invisibly rapid scratch in an atopic dermatitis model mouse. Life Sciences
254
2006,79, 2144–2150. doi:10.1016/j.lfs.2006.07.010. 255
17. Inagaki, N.; Igeta, K.; Shiraishi, N.; Kim, J.; Nagao, M.; Nakamura, N.; Nagai, H. Evaluation and 256
Characterization of Mouse Scratching Behavior by a New Apparatus, MicroAct. Skin Pharmacology and
257
Physiology2003,16, 165–175. doi:10.1159/000069755. 258
18. Cambridge-In-Colour. Understanding Camera Autofocus. https://www.cambridgeincolour.com/ 259
19. Elliott, G.; Vanwersch, R.; Bruijnzeel, P. An automated method for registering and quantifying 261
scratching activity in mice. Journal of Pharmacological and Toxicological Methods 2000, 44, 453–459. 262
doi:10.1016/s1056-8719(01)00111-3. 263
20. Dong, X.; Dong, X. Peripheral and Central Mechanisms of Itch. Neuron 2018, 98, 482–494. 264