THE DEVELOPMENT OF GOAT AND SHEEP hERDING
DURING THE LEVANT1NE NEOLITHIC
Volume 2
Alexander Michael Richard WASSE
Thesis submitted in partial fhlfilment of the requirements for the degree of Doctor of Philosophy at the University of London
January 2000 Institute of Archaeology
University College London
CHAPTER 8: IDENTIFICATION OF 'AIN GHAZAL CAPRINE REMAINS TO SPECIES
8.1: INTRODUCTION:
The identification to species of as large a proportion as possible of the caprine remains from 'Am Ghazal was undertaken with two key objectives in mind: to generate reliable quantitative, diachronic zooarchaeological data for each species, and to identify the individual morphological characteristics on each P0 SAC by which an accurate identification to species could be made. To this end the selected caprine remains were subjected to three different analyses (see below and Chapter 2).
In the First Analysis the caprine remains from 'Am Ghazal were identified to species, where possible, on the basis of traditional methods of comparison with published and unpublished morphological criteria (e.g: Boessneck 1969, Kratochvil 1969, Prummel and Frisch 1986, Helmer and Rocheteau 1994, Wasse n.d.) and modern reference material. The aim was to simply and relatively quickly identify as many P0 SACs to species as possible. The identifications obtained in this analysis form the basis of the zooarchaeological investigation of the 'Am Ghazal caprines undertaken in this study. In addition, the potential effect on interpretation of variation in the proportion of each POSAC identifiable to species by this method was examined.
The Second Analysis used metrical techniques (Payne 1969) to identify caprine distal metacarpals to species. The aim was to independently check at least some of the identifications obtained during the First Analysis by an entirely different method before using them as the basis of this zooarchaeological investigation of the 'Am Ghazal caprmes.
The Third Analysis comprised a principal components analysis of the individual morphological characteristics contributing to variation in goat and sheep bone morphology (based on Buitenhuis 1995). The aims of this analysis were threefold: to identify the particular morphological characteristics of each POSAC on which a reliable identification to species could be made, to check the potentially subjective identifications of the First Analysis under controlled, quantitative conditions, and finally to investigate
803.5 182 78 513 488 7 113.5 64.5 483.5 321 1134 138.5 48 220 153 Phase MPPNB LPPNB LPPNBIPPNC PPNC Yarmoukian 1:0.01 1:0.8 1:1.3 1:2.2 1:2.1 1:0.6 % n i.d.
58.7 58.1 59.1 57.8 49.3 56.5 n 1944.5 434 90.5 1216.5 962 4747.5
whether this type of principal components analysis has the potential to identify a greater proportion of caprine remains to species than traditional methods.
8.2: FIRST ANALYSIS (COMPARISON WITH PUBLISHED AND IJNPUBLISRED MORPHOLOGICAL CRITERIA, AND MODERN REFERENCE MATERIAL):
The sample for this analysis comprised all 4747.5 POSACs (adjusted NISP) from 'Am Ghazal which were examined during the course of this study. As expected, it proved impossible to identify all specimens to species and a substantial proportion remained in the goatlsheep category. The results of this analysis are listed by phase in Table 8 1.
Key: n=adjusted NISP, goat=n identified as goat, sheep=n identified as sheep, gtlsh=n not identified to species, % n i.d.=% n identified to species, gt:sh=ratio of specimens identified as goat to specimens identified as sheep
Table 8.1: Results of First Analysis of 'Am Ghazal Caprine Bone by Phase
8.2.1: Relative Proportion of Goats and Sheep:
The results in Table 8.1 demonstrate that the proportion of sheep in the 'Am Ghazal caprine sample increased during the period of the site's occupation. There was a marked shift in the goat to sheep ratio from 1:0.01 during the MPPNB, when sheep were virtually absent, to over 1:2 during the PPNC and Yarmoukian periods. Sheep appear to have been first exploited in large numbers at 'Am Ghazal from the LPPNB onwards.
8.2.2: Proportion of Ca prine Remains Identifiable to Species:
The results in Table 8.1 also demonstrate that the proportion of identifiable specimens from each phase is relatively consistent at just under 60%. The slightly lower proportion of identified specimens from the Yarmoukian is almost certainly a reflection of the higher levels of calcretion affecting this material
8.2.3: Proportion of Each POSAC Identifiable to Species:
In Table 8.2 the results of the First Analysis are presented for each POSAC in rank order of percentage identified to species.
'I 278 256 175 530 162 54.5 336 542 719 388 414 464 90 322 4747. 94.5 85 58 163 47 13 70 140 95 85 92 39 2 6 Distal Metacarpal Distal Metatarsal Distal Radius Astragalus Pelvis Distal Metapodial Calcaneum Distal Humerus First Phalanx Distal Tibia Distal Scapula Third Phalanx Distal Femur Mandible with teeth
178.5 159.5 89 236 68 25.5 122 154 294 110 84 155 7 11 1693.5 5 11.5 28 131 47 16 144 248 330 193 238 270 81 322 2064.5 % i.d. 98.2 95.5 84.0 75.3 71.0 70.6 57.1 54.2 54.1 50.3 42.5 41.8 10.0 5.0 56.5 :sh 1:0.5 1:0.5 1:0.7 1:0.7 1:0.7 1:0.5 1:0.6 1:0.9 1:0.3 1.0.8 1:1.1 1:0.3 1:0.3 1:0.5 1:0.6
Key: n=adjusted NISP, goat=n identified as goat sheep=n identified as sheep, gtlsirii not identified to species % n id.=% n identified to species. gt:sh=ratio of specimens identified as goat to specimens identified as sheep
Table 8.2: Results of First Analysis of 'Am Ghazal Caprine Bone by POSAC
The results in Table 8.2 demonstrate that some POSACs are more easily identifiable to species using this method than others. Three categories can be distinguished in the proportions of each POSAC identifiable to species.
1) >70% identifiable: distal metacarpal, distal metatarsal, distal radius, astragalus, pelvis and distal metapodial.
2) 40%-60% identifiable: calcaneum, distal humerus, first phalanx, distal tibia, distal scapula and third phalanx
3) <10% identifiable: distal femur and mandible with teeth.
The results in Table 8.2 are broken down by phase in Tables 8.3 to 8.7 to examine whether this pattern is repeated consistently throughout the main phases of occupation at 'Am Ghazal.
POSAC Distal Metacarpal Distal Metatarsal Distal Radius Pelvis Astragalus Distal Metapodial Calcaneum Distal Tibia MPPNB n 116 103 82 13 216 32.5 127 128 % i.d. 97.4 93.7 80.5 75.0 74.1 66.2 62.2 57.0 gt;sh 1:0 1:0.01 1:0 1:0 1:0.01 1:0 1:0.03 1:0.01 53.9 43.5 39.7 11.9 3.8 58.7 First Phalanx Distal Scapula Third Phalanx Distal Femur Mandible with teeth TOTAL 421 92 315 42 52 1944.5 1:0 1:0.03 1:0 1:0 1:0 1:0.01 Key: n-adjusted NISP, % n i.d.=% n identified to species, gt:sh=ratio of
specimens identified as goat to specimens identified as sheep
Table 8.3: Results of First Analysis of MPPNB Caprine Bone by POSAC
POSAC Distal Metacarpal Distal Metatarsal Astragalus Distal Metapodial Distal Radius Calcaneum Distal Tibia Third Phalanx Distal Humerus Pelvis First Phalanx Distal Scapula Distal Femur Mandible with teeth TOTAL LPPNB n 35 29 50 4 18 40 44 29 52 13 39 54 4 22 434 % i.d. 98.6 91.4 82.0 75.0 72.2 57.5 56.8 55.2 48.1 46.2 43.6 37.0 25.0 4.3 58.1 ;sh 1:0.5 1:0.4 1:1.2 1:0.2 1:2.3 1:0.6 1:0.9 1:1 1:1.3 1:1 1:0.3 1:1.5 1:0 0:1 1:0.8
Key: n=adjusted NISP, °ofl id=% n identified to species, gt:sh=ratio of
specimens identified as goat to specimens identified as sheep
Table 8.4: Results of First Analysis of LPPNB Caprine Bone by POSAC
Distal Metacarpal Distal Metatarsal Pelvis Astragalus Distal Radius Distal Humerus First Phalanx Distal Metapodial Distal Scapula Distal Tibia Distal Calcaneum Third Phalanx Mandible with teeth Distal Femur TOTAL LPPNBIPPNC n 14 12 9 21 6 24 23 2.5 11 24 11 12 15 6 90.5 % Id. 100.0 100.0 88.9 85.7 83.3 62.5 60.9 60.0 54.5 45.8 36.4 25.0 6.7 0.0 59.1 g1 1:1.5 1:1.4 1:1.7 1:2 1:1.5 1:1.5 1:0.8 1:2 1:0.5 1:0.8 0:1 1:0.5 0:1 0:1 1:1.3 Key: n=adjusted NISP, 00 n i.d.-°o n identified to species, gt:sh=ratio of
specimens identified as goat to specimens identified as sheep
Table 8.5: Results of First Analysis of LPPNBIPPNC Caprine Bone by POSAC
POSAC Distal Metacarpal Distal Metatarsal Distal Radius Distal Metapodial Pelvis Astragalus Calcaneum First Phalanx Distal Humerus Distal Tibia Third Phalanx Distal Scapula Distal Femur Mandible with teeth TOTAL PPNC n 71 63.5 47 9 48 154 93 130 178 104 80 139 25 75 1216.5 % id. 100.0 97.6 91.5 83.3 72.9 69.5 57.0 53.8 52.8 51.9 50.0 43.9 8.0 5.3 57.8 1:2.2 1:1.9 1:2.3 1:14 1:11 1:2.2 1:1.5 1:1.9 1:4.2 1:3.2 1:1.2 1:3.4 1:1 1:0 1:2.2 Key: n-adjusted NLSP, % n 1.L =°o n identified to species, gt:sh=ralio of
specimens identified as goal to specimens identified as sheep
Table 8.6: Results of First Analysis of PPNC Caprine Bone by POSAC
POSAC Distal Metatarsal Distal Metacarpal Distal Radius Astragalus Distal Metapodial Pelvis First Phalanx Distal Humerus Calcaneum Distal Scapula Distal Tibia Third Phalanx Distal Femur Mandible th teeth TOTAL Yarmoukian n 48.5 42 22 89 6.5 40 106 122 65 118 88 28 13 174 962 % i.d. 97.9 96.4 90.0 82.0 76.9 67.5 57.5 54.1 50.8 41.5 36.4 35.7 7.7 5.2 49.3 1:1.6 1:1.6 1:4 1:2.8 1:9 1:3.5 1:1.8 1:1.5 1:2.3 1:1.6 1:4.3 1:4 0:1 1:0.8 1:2.1
Key: n adjusted NISP, 0 n i.d °on identified to species, gt:sh=ratio of specimens identified as goat to specimens identified as sheep
Table 8.7: Results of First Analysis of Yarmoukian Caprine Bone by POSAC
The results in Tables 8.3 to 8.7 demonstrate firstly that the same POSACs are consistently easier to identify to species, and secondly that the proportion of each P0 SAC identified to species is similar in each phase. This was expected in light of the consistency in the overall proportion of POSACs identified to species from each phase (see 8.2.2 and Table 8.1).
8.2.4: Effect of the Pro portion of Ca prine Specimens Not Identified to S pecies on the Goat to Sheep Ratio:
The results in Tables 8.2 to 8.7 also suggest that a goat to sheep ratio calculated on the basis of less easily identified POSACs is more likely to diverge from that of the sample as a whole than a goat to sheep ratio calculated on the basis of a more easily identified POSAC. This is more clearly demonstrated in Table 8.8 where the mean and standard deviation of the goat to sheep ratios for the six highest ranking POSACs (excluding unassigned distal metapodia) is compared with mean and standard deviation of the goat to sheep ratios for the six lowest ranking POSACs.
POSAC mean miii ma std.dev
6 highest ranking 1:0.617 1:0.5 1:0.7 0.098
6lowestrankin 1:0.550 1:0.3 1:1.1 0.333
Table 8.8: Means, Minima, Maxima and Standard Deviations of Goat to Sheep Ratios of Six Most Identifiable and Six Least Identifiable POSACs (see Table 8.2)
The higher standard deviation of the six lowest ranking POSACs suggests that goat to sheep ratios obtained from caprine samples in which the proportion of specimens unidentified to species is high should be treated with caution. The data in Table 8.8 are presented for each phase in Table 8.9 to examine whether this pattern is repeated consistently throughout the main phases of occupation at 'Am Ghazal (unassigned distal metapodia excluded throughout).
Phase POSAC mean mm max std.dev
MPPNB 6 highest ranking 1:0.008 1:0 1:0.03 0.0116
MPPNB 6 lowest ranking 1:0.007 1:0 1:0.03 0.012 1
LPPNB 6 highest ranking 1:0.983 1:0.4 1:2.3 0.708
LPPNB 6 lowest ranking 1:0.683 1:0 1:1.5 0.668
LPPNB/PPNC 6 highest ranking 1:1.600 1:1.4 1:2 0.219
LPPNBIPPNC 6 lowest ranking 1:0.300 1:0 1:0.8 0.346
PPNC 6 highest ranking 1:1.867 1:1.1 1:2.3 0.476
PPNC 6lowestranking 1:2.167 1:0 1:4.2 1.656
Yannoukian 6 highest ranking 1:2.550 1:1.6 1:4 1.043
Yannoukian 6 lowest ranking 1:2.167 1:0 1:4.3 1.721
Table 8.9: Means, Minima, Maxima and Standard Deviations of Goat to Sheep Ratios of Six Most Identifiable and Six Least Identifiable POSACs by Phase
(see Tables 8.3 to 8.7)
In four out of the five phases in Table 8.9 the goat to sheep ratio of the lowest ranking skeletal elements has a higher standard deviation than the goat to sheep ratio of the highest ranking skeletal elements. This suggests the problems associated with obtaining representative goat to sheep ratios from caprine samples with a high proportion of specimens which are not identified to species are, if not universal, at least a regularly recurring phenomenon. In addition, the results in Table 8.9 draw attention to the fact that this problem is more pronounced in samples which contain large numbers of both species, such the PPNC and Yarmoukian, than in samples which are dominated by one species or the other, such as the MPPNB.
8.2.5: Effect of Variation in the Proportion of Each POSACs Identified to Species or. Construction of A ge Profiles:
The methods used in the First Analysis to separate samples of caprine bone clearly and consistently result in the identification of varying proportions of each POSAC, as demonstrated above. This poses a significant problem with regard to the construction of separate age profiles for goats and sheep.
In small samples, such the LPPNB and LPPNB/PPNC, the number of less easily identified POSACs assigned to one species or the other is tiny, owing to the high number of bones remaining in the unidentified goat/sheep category. Unfortunately epiphyseal fusion data from a number of these POSACs, including the distal humerus, first phalanx, distal tibia and distal femur, are commonly used to generate age profiles. It is therefore clear that if this method is used to separate small samples of goat and sheep bone, it will be extremely difficult to construct detailed age profiles for each species which draw on data from less easily identifiable POSACs. Even if samples are large, the fact that the goat to sheep ratio of these elements may not be representative of the sample as a whole (see 8.2.4) means that any age profiles thus generated should be treated with extreme caution.
8.3: SECOND ANALYSIS (METRICAL SEPARATION OF DISTAL METACARPALS):
The sample for this analysis (Payne 1969) comprised the entire sample of 'Am Ghazal caprine distal metacarpals on which w.cond and w.troch measurements could be taken. It was possible to obtain these measurements on a total of 217 individual metacarpal condyles (see Table 8.10). These included both medial and lateral, and fused and unthsed specimens. As each metacarpal has two condyles this was equivalent to an adjusted NISP count of 108.5, or 39.0% of the total sample of 278 (adjusted NISP) caprine distal metacarpals examined during the course of this study (see Table 8.2). The measured condyles were inevitably amongst the best preserved and as a result all but one had been identified to species during the First Analysis. In Figures 8.1 to 8.6 the measured metacarpal condyles are categorised on the graphs according to their identification as goat, sheep or goat/sheep in the previous analysis.
8.3.1: Independent Check of Caprine POSAC Identifications Obtained in the First Analysis:
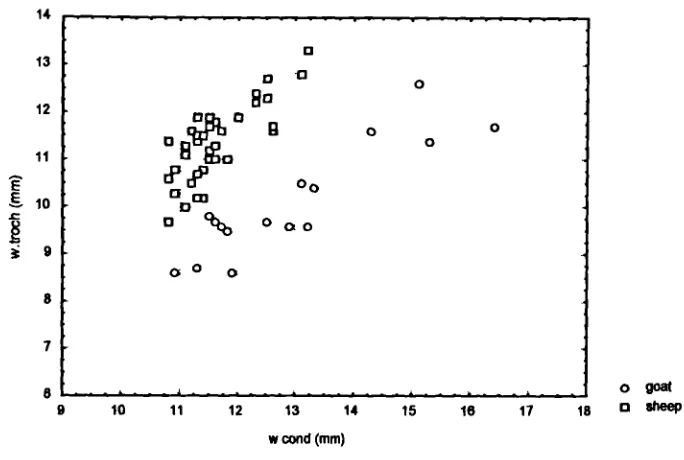
The w.cond and w.troch measurements of the entire sample of caprine metacarpal condyles from 'Am Ghazal measured during the course of this study are plotted in Figure 8.1.
14
13
12
11
E 10
8
7
6 9
.-.D
oY
Q QO 0o go
0b
:00o o% 00
0 0
a o 8
q,rO
El a
a
0 0
10 11 12 13 14 15 16 17 18
w.cond (mm)
0 goat a Sh5) o goal/sheep
Figure 8.1: Metrical Separation of All 'Am Ghazal Caprine Metacarpal Condyles
In Figure 8.1 it is clear that the specimens identified as goat or sheep in the First Analysis
fall into two clear clusters with no intermediate specimens, confirming the initial
identification in each instance. This suggests that Payne's (1969) metrical separation of
goat and sheep metacarpals can correctly identi1 the great majority of distal metacarpal
condyles on which w.cond and w.troch measurements can be taken. In addition, it is
clear from Figure 8.1 that the single previously unidentified metacarpal condyle should
be identified as sheep.
Although the distal metacarpal was one of the easiest POSACs to identifr to species in
the First Analysis (see 8.2.3), these results suggest that the traditional use of
published/unpublished morphological criteria and modern reference material to identifr
caprine remains to species can produce accurate identifications of a large proportion of
specimens. Therefore, as a result of the Second Analysis confidence in the identifications
of other POSACs obtained in the First Analysis is increased.
8.3.2: Independent Check of Goat to Sheep Ratios Obtained in the First Analysis: As it was possible to identi1,' each measured metacarpal condyle to species it was also
possible to calculate exact goat to sheep ratios for this POSAC during each phase of
occupatioit The data in Figure 8.1 are therefore broken down by phase in Figures 8.2 to
8.7 to independently check the goat to sheep ratios for each phase obtained in the First Analysis.
0
9 0
0 0
D 0 o 0 ocb.
J 9 OOQ
oor 0 o0 0
60
o goat
9 10 11 12 13 14 15 16 17 18
wcond (m)
Figure 8.2: Metrical Separation of MPPNB 'Am Ghazal Caprine Metacarpal Condyles
14
13
12
11 E
10
39
8
7
6
14
13
12
11 E -C
8 9
8
7
o goat
6 o sheep
9 10 11 12 13 14 15 16 17 18 w id (neil)
Figure 8.3: Metrical Separation of LPPNB 'Am Ghazal Caprine Metacarpal Condyles
13
12
11
E 10
9
8
7
6 o goat
9 10 11 12 13 14 15 16 17 18 0 w cond (mm)
Figure 8.4: Metrical Separation of LPPNBIPPNC 'Am Ghazal Caprine Metacarpal Condyles
14
13
12
11 E gb
8
7
8 ogoat
9 10 11 12 13 14 15 16 17 18
w.cond (mm)
Figure 8.5: Metrical Separation of PPNC 'Am Ghazal Caprine Metacarpal Condyles
14
13
12
11 E
10
8
7
U
0
8° aQi 0
0 0 0
0
a 00
D% 000
a
8 t... .1 o goat
9 10 11 12 13 14 15 16 11 18 w cond (mm)
Figure 8.6: Metrical Separation of Yarmoukian 'Am Ghazal Caprine Metacarpal Condyles
Goat to sheep ratios of metrically separated distal metacarpals for each phase were calculated on the basis of the results in Figures 8.2 to 8.6 and are listed in Table 8.10, where they are compared with the mean goat to sheep ratios of all POSACs obtained in the First Analysis (see Table 8.1).
2 Analysis 1" Analysis
Phase n goat isheep a total gt:sh gt:sh
MPPNB 37 1 38 1:0.03 1:0.01
LPPNB 14 7 21 1:0.5 1:0.8
LPPNBIPPNC 10 14 24 1:1.4 1:1.3
PPNC 28 52 80 1:1.9 1:2.2
Yarmoukian 16 38 54 1:2.4 1:2.1
TOTAL 105 112 217 1:1.1 1:0.6
Key: n=NISP, n goat=n specimens identified as goat in Second Ana1ysis n sheepn specimens identified as sheep in Second Analysis, gtsh=ratio of specimens identified as goat to specimens identified as sheep
Table 8.10: Goat to Sheep Ratios of Metrically Separated 'Am Ghazal Capnne Metacarpal Condyles (see Figures 8.2 to 8.6), Compared with Mean Goat
to Sheep Ratios of all POSACs Obtained in First Analysis (see Table 8.1)
The results in Table 8.10 demonstrate that the goat to sheep ratios for each phase obtained through metrical analysis of metacarpal condyles, in which the entire sample was identified to species, are broadly comparable with the mean goat to sheep ratios of all POSACs for each phase obtained in the First Analysis, despite the fact that in the First
Analysis not all POSACs were identified to species. Confidence is thus increased in the mean goat to sheep ratios for each phase obtained in the First Analysis.
8.4: THIRD ANALYSIS (PRINCIPAL COMPONENTS ANALYSIS):
It was decided to exclude a number of POSACs from this analysis: the pelvis because of the difficulty of distinguishing inter-sexual from inter-species variation, the distal femur because of the paucity of published species-specific morphological characteristics and generally poor state of preservation, and mandibles with teeth because these were identified to species, in the few cases where it was possible, on the basis of dental morphology (Payne 1985b) which is affected by the stage of dental wear.
Unfortunately it was not possible to subject the entire remaining sample of 'Am Ghazal caprine POSACs owing to the time required to record the requisite data. A sub-sample of 1514, or approximately one third, of the selected POSACs, was therefore drawn from the sample as a whole (see Table 8.11). These were selected on the basis of a subjective assessment of their state of preservation, owing to the need to record as many morphological characteristics as possible on each specimen. It was decided that for a specimen to qualif,r for inclusion at least two morphological characteristics would have to be recorded. The raw data for this analysis, i.e.: the scores for each specimen, are contained in Appendix A.
n noat n n
Distal Scapula 153 50 46 57
Distal Humerus 189 50 82 57
Distal Radius 69 28 38 3
Distal Tibia 141 49 48 44
Distal Metacarpal 124 62 61 1
Distal Metatarsal 122 70 50 2
First Phalanx 274 118 68 88
Third Phalanx 107 43 23 41
Astragalus 220 105 90 25
Calcaneum 115 46 43 26
TOTAL 1514 621 549 349
Key: n—NISP, n goatn specimens identified as goat in First Analysis, nsheepn specimens identified as sheep in First Analysis, n goatlsheep=n specimens identified as goat/sheep in First Analysis
Table 8.11: The Sample of 'Am Ghazal Caprine POSACs Subjected to Principal Components Analysis
In the results presented below the selected specimens are categorised according to their previous identification as goat, sheep or goatlsheep in the First Analysis. It should also
be noted that in the plots of factor scores for each POSAC presented below (Figures 8.7 to 8.16) the number of plotted points is less than the number of analysed specimens owing to the fact that the same combination of character scores were in some instances recorded on more than one specimen. MSP, rather than adjusted NTSP counts, are used throughout.
8.4.1: Princi pal Com ponents Analysis of Ca p rine Distal Scapulae:
Schematic drawings of the various distal scapula morphological characteristics are provided in Figure 8.7.
2ic 21(
1 2 3 4
Veiy Thick Thick Slender Veiy Slender
Characteristic B23: General Form of Neck of Scapula (Boessneck 1969)
Lk U U U
1 2 3 4
Veiy Strong Strong Light Veiy Light
Characteristic B24/.PF5: Curvature of Margo Cervicalis (Boessneck 1969, Prunimel and Frisch 1986)
2k
c1
1 2 3 4
Veiy Strong Strong Light Veiy Light
Characteristic B25: Pecten on Collum (Boessneck 1969)
Figure 8.7: Schematic Drawings of Caprine Distal Scapula
Morphological Characteristics
1 2 3 4
Elongated Round Lightly Angular Rounded with Break Strongly Angular
Characteristic B26/PF6: Supraglenoid Tubercle (Boessneck 1969, Prummel and Frisch 1986)
cè a
1 2 3 4
Strongly Elliptic Elliptic Lightly Elliptic Round
Characteristic B271PF8: Shape of Glenoid Cavity (Boessneck 1969, Prummel and Frisch 1986)
ti
2IUS
I 2 3 4
Short and Clear Long and Clear Long and Unclear Short and Unclear
Characteristic B29: Subscapular Fossa (Boessneck 1969)
Figure 8.7 (cont): Schematic Drawings of Caprine Distal Scapula Morphological Characteristics
1 2 3 4
Very Strong Strong Light Very Light
Characteristic PF7: Distal Extension of Coracoid Process (Prummel and Frisch 1986)
6?
a
1 2 3 4
Unclear/Missing Wide and Deep Narrow and Deep Short and Narrow/Fused
Characteristic BU1: Fossa Synoviatis in Fovea Articularis (Buitenhuis 1995)
1 2 3 4
Very Strong Strong Slight None
Characteristic HR1: BolIov for Muscle Attachment on Supraglenoid Tubercie (Ilelmer and Rocheteau 1994)
Figure 8.7 (cont): Schematic Drawings of Caprine Distal Scapula Morphological Characteristics
The score counts and calculated factor loadings for the various distal scapula
morphological characteristics are listed in Tables 8.12 and 8.13 respectively.
score score score score missing
characteristic species a 1 2 3 4 data
B23 Goat 50 0 4 7 4 35
B23 Sheep 46 0 3 12 3 28
B23 Goat/Sheep 57 0 2 11 15 29
B241PF5 Goat 50 0 3 15 13 19
B241PF5 Sheep 46 5 18 3 0 20
B24,PF5 Goat/Sheep 57 0 16 15 5 21
B25 Goat 50 0 3 13 24 10
B25 Sheep 46 4 14 11 1 16
B25 Goat/Sheep 57 0 8 16 25 8
B26fPF6 Goat 50 1 1 20 15 13
B261PF6 Sheep 46 25 17 0 0 4
B26/PF6 Goat/Sheep 57 1 10 9 2 35
B27/PF8 Goat 50 0 4 22 22 2
B27/PF8 Sheep 46 14 24 6 0 2
B27IPF8 Goat/Sheep 57 2 16 17 5 17
B29 Goat 50 0 3 14 14 19
B29 Sheep 46 11 1 3 2 29
B29 Goat/Sheep 57 11 6 9 14 17
PF7 Goat 50 0 5 25 14 6
PF7 Sheep 46 15 18 11 0 2
PF7 Goat/Sheep 57 4 8 13 2 30
BU1 Goat 50 0 1 12 21 16
BUI Sheep 46 4 22 3 0 17
BU1 Goat/Sheep 57 8 4 6 1 38
HR1 Goat 50 0 1 13 29 7
HRI Sheep 46 12 18 ii 1 4
HRI Goat/Sheep 57 2 6 7 10 32
Key characteris*ic'see Figure &7, ciidentiticaflon oblained in First Analysis n=NISP, score X=n specimens scoring X flu the pailicular characteristic, missing data =n spahnens on which the particular characteristic was not preserved
Table 8.12: Score Counts for Caprine Distal Scapula Characteristics
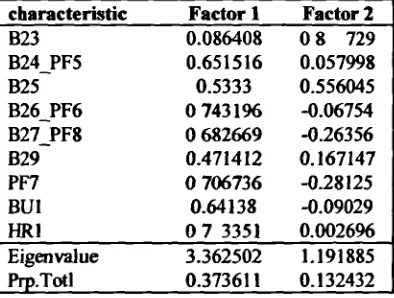
characteristic B23 B24_PF5 B25 B26_PF6 B27_PF8 B29 PF7 BUI FIRI Eigenvalue Pro Toti Factor 1 0.086408 0.65 15 16 0.5333 0743196 0682669 0.4714 12 o 706736 0.64138 07 3351 3.362502 0.373611 Factor 2 08 729 0.057998 0.556045 -0.06754 -0.26356 0.167147 -0.28125 -0.09029 0.002696 1.191885 0.132432
Table 8.13: Factor Loadings for Caprine Distal Scapula Characteristics (Highest Factor Loadings in Red)
The relative contribution of each characteristic to the overall morphological variation
between distal scapulae of goats and sheep is demonstrated by the factor loadings in
4
3
2
I
NO
c.1
U--1
-2
-3
a 0
a
0 0 •000
!_rI• 0
D pP 0
Q
g° 0
ac:
0
0 0
0 
0
0 0
p
-4 _____________________ _____________________ n sheep
0 goat
-.4 -3 -2 -1 0 1 2 3 4
Fl (B26!PFG.B271PF8 PF7.HR1)
Figure 8.8: Factor Scores of Each Analysed Caprine Distal Scapula
Table 8.13. Factor I was affected mainly by B26-PF6, PF7, HR1 and B27-PF8, and
Factor 2 by B23. As the eigenvalue of both factors is greater than one, the morphological
variation incorporated in each factor can be regarded as significant The five
characteristics affecting factors 1 and 2 may thus be regarded as the most reliable criteria
by which to make an identification of caprine distal scapulae to species and are presented
in rank order of reliability in Table 8.14.
Rank Characteristic Description
1 B26-PF6 Shape of supraglenoid tubercie
2 PF7 Distal extension of coracoid process
3 HR1 Hollow for muscle attachment on supraglenoid tubercie
4 B27-PF8 Shape of glenoid cavity
5 B23 General form of neck of scanula
Table 8.14: Most Reliable Capnne Distal Scapula Characteristics in Rank Order
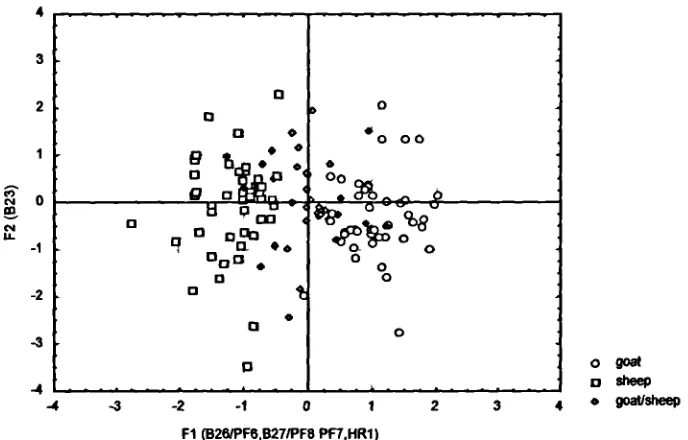
The factor loadings of each analysed distal scapula are plotted in Figure 8.8.
In Figure 8.8 the factor loadings of distal scapulae identified to species in the First Analysis fall into two separate clusters, one consisting of specimens previously identified
as goats and the other consisting of specimens previously identified as sheep. This
confirms that the clusters are a reflection of the morphological variation between the two
species and suggests that all identifications obtained during the First Analysis are correct.
The factor loadings of caprine specimens which could not be identified to species during
the First Analysis fall into an intermediate cluster. 17 of these previously unidentified
specimens, marked solid in Figure 8.8, fall within the range of morphological variation of either goats and sheep as represented by the clusters of previously identified specimens and could therefore be assigned to one species or the other. The remaining 40 unidentified specimens fall in between the goat and sheep clusters and could not be identified to species by this method.
8.4.2: Principal Com ponents Analysis of Ca p rine Distal Humeri:
Schematic drawings of the various distal humerus morphological characteristics are provided in Figure 8.9.
1 2 3 4
Highly Tapered Tapered Almost Parallel Parallel
Characteristic B33: Form of Trochlea Humeri (Bocssneck 1969)
1 2 3 4
Much Thickening Some Thickening Minimal Thickening No Thickening
Characteristic B34: Granular Thickening at Lateral Border of Trochlea Surface (Boessneck 1969)
1 2 3 4
Very Strong Crest/Pit Strong Crest/Pit Some Crest/Pit Minimal Crest/Pit
Characteristic B35: Pit of Lateral Epicondle (Boessneck 1969)
Figure 8.9: Schematic Drawings of Caprine Distal Humerus
Morphological Characteristics
1 2 3 4
Not Cut Back Slightly Cut Back Cut Back Heavily Cut Back Characteristic B36: Form of Distal Part of Medial Epicondyle (Boessneck 1969)
1 2 3 4
Major Drop Drop Slight Drop No Drop
Characteristic U!: Uerpmann's Variation on B36 (Uerpmann pers. comm.)
1 2 3 4
Great Angle Medium Angle Slight Angle Almost Straight
Characteristic PF9: Transition from Shaft to Lateral Epicondyle (Prummel and Frisch 1986)
Figure 8.9 (cont): Schematic Drawings of Caprine Distal Humerus Morphological Characteristics
?c
S I
S
\\4
(h''lv,
__
IfL1
I
1 2 3 4
Veiy Broad Ridge Broad Ridge Sharp Ridge Very Sharp Ridge
Characteristic BIS: Transition from Shaft to Lateral Epicondyle (Boessneck 1969)
1 2 3 4
Halfway Just Over Halfway Just Below Top Almost to Top
Characteristic PF1O: Articulation at Distal End of Medial Epicondyle (Prummel and Frisch 1986)
1 2 3 4
Short and Very Curved Short and Curved Long and Slightly Curved Long and Parallel
Characteristic AWl: Form of Distal End of Lateral Epicondyle (Wasse n.d.)
Figure 8.9 (cont): Schematic Drawings of Caprine Distal Humerus Morphological Characteristics
n 50 82 57 50 82 57 50 82 57 50 82 57 50 82 57 50 82 57 50 82 57 50 82 57 50 82 57 score 1 6 13 10 0 5 0 0 12 4 0 27 3 3 14 3 0 19 4 0 17 3 0 38 2 0 36 I score 2 18 42 20 10 20 3 7 42 10 4 31 7 11 28 6 3 42 24 12 39 12 1 25 4 2 27 15 score 3 18 21 16 10 25 5 17 17 15 18 6 9 17 20 7 22 8 3 16 12 20 7 2 10 20 6 7 score 4 I 0 2 14 9 11 18 5 12 19 0 0 10 3 4 14 1 6 9 0 0 33 0 I 20 0 0
The score counts and calculated factor loadings for the various morphological characteristics of caprine humeri are presented in Tables 8.15 and 8.16 respectively.
characteristic B33 B33 B33 B34 B34 B34 B35 B35 B35 B36 B36 B36 U' U' U' PF9 PF9 PF9 B15 BiS B15 PF 10 PF1 0 PF 10 AWl AWl AWl Goat Sheep GoatiSheep Goat Sheep Goat/Sheep Goat Sheep Goat/Sheep Goat Sheep Goat/Sheep Goat Sheep Goat/Sheep Goat Sheep Goat/Sheep Goat Sheep Goat/Sheep Goat Sheep Goat/Sheep Goat Sheep missing data 7 6 9 16 23 38 8 6 16 9 18 38 9 17 37 11 12 20 13 14 22 9 17 40 8 13 34
Key c acteristic=see Figure 89, species=identificaiion obtained in First Analysis n=NLSP, score Xn specimens scoring X for the particular characteristic, missing daia=n specimens on which the particular characteristic was not preserved
Table 8.15: Score Counts for Caprine Distal Humerus Characteristics
Characteristic B33 B34 B35 B36 UI PF9 B15 PF1O AWl Eigenvalue Prt, Tot! Factor 1 0.125455 0.321674 0.554699 0 710232 0.371667 0 684588 0.599436 082 917 072 3.074049 0.341561
Factor 2 -0 7151 -0.56373 -0.45107 0.295117 0.214533 0.230008 -0.06976 0.175986 -0.04167 1.256213 0.139579
Table 8.16: Factor Loadings for Caprine Distal Hømerus Characteristics (Highest Factor Loadings in Red)
The relative contribution of each characteristic to the overall morphological variation
between distal humeri of goats and sheep is demonstrated by the factor loadings in Table
8.16. Factor I was affected mainly by PFIO, B36, AWl and PF9 and Factor 2 by B33.
As the eigenvalue of both factors is greater than one, the morphological variation
incorporated in each factor can be regarded as significant. The five characteristics
affecting factors 1 and 2 may thus be regarded as the most reliable criteria by which to
make an identification of caprine distal humeri to species and are presented in rank order
of reliability in Table 8.17
Rank Charactenstic Description
I PFIO Length of facet on distal medial epicondyle 2 B36 Form of distal medial icondyle
3 AWl Form of distal lateral epicondyle
4 PF9 Transition from shaft to lateral epicondyle 5 B33 Form of trochlea humeri
Table 8.17: Most Reliable Distal Humerus Characteristics in Rank Order
The factor loadings of each analysed distal humerus are plotted in Figure 8.10.
4
3
2
I
, 0
C.,'
U--1
-2
-3
0 0
0 0
- 0
b oo 00
0 0
; •'
00rJ
o 0 0 00 0
1ff_
-3 -2 -1 0 1 2 3 4Fl (836 PF9,PFIOAWI)
0 gOat
D sheep o goat/sheep
Figure 8.10: Factor Scores of Each Analysed Caprine Distal Humerus
In Figure 8.10 the factor loadings of distal humeri identified to species in the First
Analysis fall into two clusters, one consisting of specimens previously identified as goats
and the other consisting of specimens previously identified as sheep. This confirms that
the clusters are a reflection of the morphological variation between the two species and
suggests that all identifications obtained during the First Analysis are correct. The factor
loadings of caprine specimens which could not be identified to species during the First
Analysis fall into an intermediate cluster. 21 of these previously unidentified specimens, marked solid in Figure 8.10, fall within the range of morphological variation of either goats and sheep as represented by the clusters of previously identified specimens and could therefore be assigned to one species or the other. The remaining 36 caprine specimens fall in between the goat and sheep clusters and could therefore not be identified to species by this method.
8.4.3: Principal Com p onents Analysis of Ca prine Distal Radii:
Schematic drawings of the various distal radius morphological characteristics are provided in Figure 8.11.
1 2 3 4
None Slight Strong Extreme
Characteristic B904: Distal Extension of Dorsal Edge of Intermedium Facet (Boessneck 1969)
1 2 3 4
Minimal Shallow Deep Very Deep
Characteristic B42: Indentation in Intermedium Facet (Boessneck 1969)
1 2 3 4
Vezy Short Short Long Veiy Long
Characteristic B905: Small Facet on Intermedium Facet (Boessneck 1969)
Figure 8.11: Schematic Drawings of Caprine Distal Radius Morphological Characteristics
9 0
I 2 3 4
Long Drop Shape Short Drop Shape Short, Angular Drop Shape Veiy Broad and Angular
Characteristic B43: Shape of Radial Facet (Boessneck 1969)
1 2 3 4
Same as Radial Facet Slightly Above Radial Facet Above Radial Facet Well Above Radial Facet
Characteristic B906: Height of Intermedium Facet (Boessneck 1969)
Figure 8.11 (cont): Schematic Drawings of Caprine Distal Radius Morphological Characteristics
The score counts and calculated factor loadings for the various morphological
characteristics of caprine radii are presented in Tables 8.15 and 8.16 respectively.
score score score score
a I 2 3 4
28 0 13 14
38 22 14 I 0
3 I 0 I 0
28 0 3 16 9
38 23 14 0
3 0 0 0 0
28 0 0 13 15
38 27 11 0 0
3 0 0 0 0
28 0 3 14 8
38 12 20 5 0
3 0 1 2 0
28 18 5 3 0
38 36 0 0
3 0 0 0 0
characteristic B904 8904 B904 842 842 842 B905 B905 B905 843 843 843 B906 B906 B906 Goat Sheep Goat/Sheep Goat Sheep Goat/Sheep Goat Sheep Goat/Sheep Goat Sheep Goat/Sheep Goat Sheep missing data 0 I I 0 0 3 0 0 3 3 1 0 2 3
Key characteristic=see Figure 8.11, speciesidentification obtained in First Ana1ysis nNISP, score X = n specimens scoring X for the particular characteristic, missing data=n specimens on which the particular characteristic was not preserved
8.18: Score Counts for Caprine Radius Characteristics
Characteristic B904 842 B905 843 B906 Eigenvalue Prp.TotI Factor 1 -0.91866 -091137 .0 88255
-0 80794 -0.45692 3.3 14989 0.662998 Factor 2 0.031247 0.087294 0. 15383 0. 199198 -O 88629 0 85 445 0. 171489
8.19: Factor Loadings for Caprine Radius Characteristics (Highest Loadings in Red, Eigenvalue <1.0 in Blue)
The relative contribution of each characteristic to the overall morphological variation
between distal radii of goats and sheep is demonstrated by the flictor loadings in Table
8.19. Factor 1 was affected mainly by B904, B42, B905 and B43 and Factor 2 by B906.
Although the eigenvalue of factor 1 is greater than one, that of thctor 2 is not. Therefore
only the morphological variation incorporated in flictor 1 can be regarded as making a
significant contribution to overall morphological variation. The four characteristics
affecting factor I may thus be regarded as the most reliable criteria by which to make an
identification of caprine distal radii to species and are presented in rank order of
reliability in Table 8.20.
Rank Characteristic Description
1 B904 Distal extension of dorsal edge of mtermedium facet
2 B42 Indentation in intermedium facet
3 B905 Small facet on intermedium facet
4 B43 Shape of radial facet
Table 8.20: Most Reliable Distal Radius Characteristics in Rank Order
The factor loadings of each analysed distal radius are plotted in Figure 8.12.
4 -.
--3
2
0
aI
0
riq
(.4 0
U--1 -o
0009
-2
D -3
000
4 -_-
--4 -3 -2 -1 0 2 3 4
Fl (B904,B42,B905,B43)
0 gOat
D sheeP goaUsheep
Figure 8.12: Factor Scores of Each Analysed Caprine Distal Radius
When interpreting Figure 8.12 it should be recalled that the eigenvalue of factor 2 for
distal radii was less than one (see Table 8.19) and can therefore be ignored. In Figure
8.12 the factor 1 loadings of distal radii identified to species in the First Analysis fall into
two clusters, one consisting of specimens previously identified as goats and the other
consisting of specimens previously identified as sheep. This confirms that the clusters are
a reflection of the morphological variation between the two species and suggests that all
identifications obtained during the First Analysis are correct. The factor loadings of
caprine specimens which could not be identified to species during the First Analysis fall
into an intermediate chister. All of these previously unidentified specimens, marked solid
in Figure 8.12, fall within the range of morphological variation of either goats or sheep as
represented by the clusters of previously identified specimens and could therefore be
assigned to one species or the other
p .4.4: Principal Com ponents Analysis of Ca p rine Distal Metacarpals:
Schematic drawings of the various distal metacarpal morphological characteristics are provided in Figure 8.13.
UU
1 2 3 4
Veiy Rounded Rounded and Shallow Sharp and Steep Very Sharp and Steep
Characteristic B71: Sharpness and Steepness of Vertidilhi on Trochlea (Boessneck 1969)
ZXII?
1 2 3 4
No Neck Hint of Neck Slight Neck Clear Neck
Characteristic B207: Definition of Trochlea by Neck at Verticilli (Boessneck 1969)
I 2 3 4
Minimal Slightly Developed Strongly Developed Very Strongly Deeloped
Characteristic B208: Extent of Fossulae (Boessneck 1969)
Figure 8.13: Schematic Drawings of Caprine Distal Metacarpal Morphological Characteristics
Parallel Slight Angle Strong Angle Very Strong Angle Characteristic B209: Degree of Convergence of Verticilli (Boessneck 1969)
Figure 8.13 (cont): Schematic Drawings of Caprine Distal Metacarpal Morphological Characteristics
The score counts and calculated factor loadings for the various morphological characteristics of caprine metacarpals are presented in Tables 8.21 and 8.22 respectively.
score score score score
n 1 2 3 4
62 0 7 30 17
61 3 25 30
0 I 0 0
62 1 12 27 21
61 14 40 6 0
1 0 0 0
62 2 10 19 28
61 25 25 6 0
1 1 0 0 0
62 0 5 9 5
61 8 22 0 0
0 0 0 0
characteristic B7 1 B7 1 B7 I B207 B207 B207 B208 B208 B208 B209 B209 B209 Goat Sheep Goat/Sheep Goat Sheep Goat/Sheep Goat Sheep Goat/Sheep Goat Sheep missing data 8 2 0 0 3 5 0 43 31
Key chaacteiisticsee Figure 8.13, species=identification obtained in First Analysis, n=NISP, score X=n specunens scoring X for the particular characteristic, missing data=n specimens on which the particular characteristic was not preserved
Table 8.21: Score Counts for Caprine Metacarpal Characteristics
Characteristic B7 1 B207 B208 B209 Eigenvalue Prp.TotI Factor 1 -0.6548 -O 81479 -080357 -0.57433 2.068217 0.517054 Factor 2 0.275478 0.198062 0.155232 -081226 0 898 0.199745
Table 8.22: Factor Loadings for Caprine Metacarpal Characteristics (Highest Factor Loadings in Red, Eigenvalue <1.0 in Blue)
The relative contribution of each characteristic to the overall morphological variation between distal metacarpals of goats and sheep is demonstrated by the factor loadings in Table 8.22. Factor I was affected mainly by B207 and B208 and Factor 2 by B209. Although the eigenvalue of factor 1 is greater than one, that of factor 2 is not. Therefore only the morphological variation incorporated in factor I can be regarded as making a significant contribution to overall morphological variation. The two characteristics affecting factor 1 may thus be regarded as the most reliable criteria by which to make an identification of caprine distal metacarpals to species and are presented in rank order of reliability in Table 8.23.
Rank Characteristic Description
1 B207 Definition of trochlear by neck at verticilli
2 B208 Extent of fossulae
Table 8.23: Most Reliable Distal Metacarpal Characteristics in Rank Order
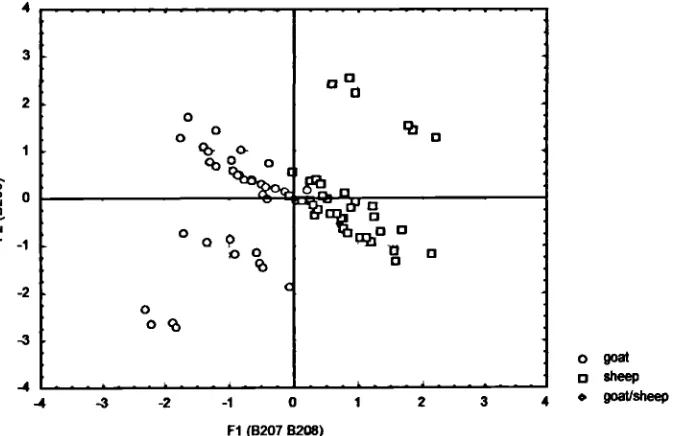
The factor loadings of each analysed distal metacarpal are plotted in Figure 8.14.
4
3
2
0
0
I
qO 0
U.
1 0% 0
-2
0 0
-3
- - -
--4 -3 -2 -1 0 1 2 3 4
Fl (B207 6208)
0 goat o sheep
• goaUsheep
Figure 8.14: Factor Scores of Each Analysed Caprine Distal Metacarpal
When interpreting Figure 8.14 it should be recalled that the eigenvalue of factor 2 for
distal metacarpals was less than one (see Table 8.22) and can therefore be ignored. The
factor 1 loadings of specimens identified to species in the First Analysis fall into two
clusters, one consisting of specimens previously identified as goats and the other
consisting of specimens previously identified as sheep. This confirms that the clusters are
a reflection of the morphological variation between the two species. However, the two
clusters overlap slightly and seven specimens identified during the First Analysis lie
within the zone of overlap. As a result not all of these identifications can be confirmed by
this method. Fortunately in the case of the distal metacarpal, all identifications obtained
during the First Analysis were confirmed by the metrical Second Analysis. The single
specimen which could not be identified to species during the First Analysis falls within
the range of morphological variation of sheep and could therefore be assigned to this species, as it was in the Second Analysis.
8.4.5: Princi p al Components Anal ysis of Ca p rine Distal Tibiae:
Schematic drawings of the various distal tibia morphological characteristics are provided in Figure 8.15.
1 2 3 4
Characteristic KI: Periphery of Medial Articular Surface on Prominence (dorsal view) (Kratochvii 1969)
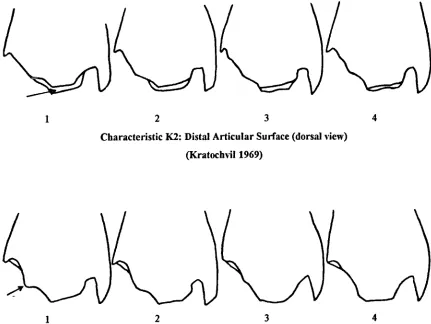
1 2 3 4
Characteristic 1(2: Distal Articular Surface (dorsal view) (Kratochvil 1969)
1 2 3 4
Characteristic K3: Periphery of Dorsal Prominence on Lateral Side (dorsal view) (Kratochvil 1969)
Figure 8.15: Schematic Drawings of Caprine Distal Tibia Morphological Characteristics
2
Characteristic K4: Sulcus Malleolaris (plantar view) (Kratochvil 1969)
4
Characteristic KS: Articular Surface and Synovial Foveola on Dorsal Prominence (plautar view) (Kratochvil 1969)
2 4
Characteristic K6: Prolapse in Middle of Plantar Edge of Articular Surface (palmar view) (Kratochvil 1969)
Figure 8.15 (cont): Schematic Drawings of Caprine Distal Tibia Morphological Characteristics
2 3 4 Characteristic K7: Visibility of Medial Half of Tibia (lateral view)
(Kratochvil 1969)
2 3 4
Characteristic KS: Incision and Articular Surface for Os Malleolare (lateral view) (Kratochvil 1969)
4 Characteristic K9: Lip on Medio-Plantar Limbus of Articular Surface (medial iew)
(Kratochvil 1969)
Figure 8.15 (cont): Schematic Drawings of Caprine Distal Tibia Morphological Characteristics
2
Characteristic K1O: Dorso-Medial Section of Articular Surface (distal view) (Kratochvil 1969)
2
Characteristic Ku: Sulcus Malleolaris (distal view)
(Kratoch% ii 1969)
2
Characteristic K12: Interruption of Plantar Limbus of Articular Surface (distal view) (Kratochvil 1969)
Figure 8.15 (cont): Schematic Drawings of Caprine Distal Tibia Morphological Characteristics
2f
S
1 2 3 4
Characteristic K13: Articular Surface for Os Malleolare (distal view) (Kratoch%il 1969)
Characteristic K14: Protuberantia on Anterior Face (Kratochvil 1969)
Figure 8.15 (cont): Schematic Drawings of Caprine Distal Tibia Morphological Characteristics
n 49 48 44 49 48 44 49 48 44 49 48 44 49 48 44 49 48 44 49 48 44 49 48 44 49 48 44 49 48 44 49 48 44 49 48 44 49 48 44 49 48 44 score 1 0 5 1 0 22 10 0 8 7 0 22 4 5 10 6 0 3 1 0 12 3 0 9 4 0 6 2 0 14 7 0 18 7 0 18 6 2 13 9 0 16 2 score 2 0 19 9 7 20 16 9 17 15 7 17 20 11 21 11 0 12 5 0 19 11 3 24 10 1 16 4 7 22 9 17 15 9 4 23 15 13 25 19 9 10 10 score 3 16 3 12 29 2 11 27 18 14 23 2 9 11 4 7 8 15 10 21 9 18 24 13 18 11 11 13 19 2 15 13 10 18 3! 6 19 22 4 9 11 0 4 score 4 22 0 5 11 0 2 12 4 5 8 0 I 12 I 3 38 17 24 17 1 3 12 1 3 27 4 8 18 0 I 9 1 8 12 0 1 6 0 0 4 0 0 missing 11 21 17 2 4 5 1 1 3 11 7 10 10 12 17 3 1 4 11 7 9 10 1 9 10 11 17 5 10 12 10 4 2 2 1 3 6 6 7 25 22 28 The score counts and calculated factor loadings for the various morphological characteristics of caprine tibiae are presented in Tables 8.24 and 8.25 respectively.
characteristic Ki K1 Ki K2 K2 K2 K3 K3 K3 K4 K4 K4 KS K5 K5 K6 K6 K6 K7 K7 K7 K8 K8 KS K9 K9 K9 K10 K10 K1O Ku Ku Ku K12 K12 K12 K13 K13 K13 K14 K14 K14 Goat Sheep Goat/Sheep Goat Sheep Goat/Sheep Goat Sheep Goat/Sheep Goat Sheep Goat/Sheep Goat Sheep Goat/Sheep Goat Sheep Goat/Sheep Goat Sheep Goat/Sheep Goat Sheep Goat/Sheep Goat Sheep Goat/Sheep Goat Sheep Goat/Sheep Goat Sheep Goat/Sheep Goat Sheep Goat/Sheep Goat Sheep Goat/Sheep Goat Sheep
Key: characteristic=see Figure 5.15, species=identiflcation obtained in First Anaiysis, n—NLSP, score X=n specimene scoring X for the particular characteristic, missing data —n specimene on which the particular characteristtc was i preserved
Table 8.24: Score Counts for Caprine Tibia Characteristics
Characteristic Kl K2 K3 K4 KS K6 K7 K8 K9 K10 Ku K12 K13 K14 Eigenvalue Pro.Totl Factor 1 o 644 89 07 87 0.368706 0 720177 0.294747 0.55653 0 85734 0.608301 0.584178 066053 0.471431 0689869 0.604428 0.563579 4 .95 7404
0.354 1
Factor 2 0.106749 0. 1202 18 -0 40635 -0.30098 0574 0.40684 0.077343 -0.33316 -0.1414 0.24578 -042153 0.389662 -0.2159 -0.06267 1.292784 0.092342
Table 8.25: Factor Loadings for Caprine Tibia Characteristics (Highest Factor Loadings in Red)
The relative contribution of each characteristic to the overall morphological variation
between distal tibiae of goats and sheep is demonstrated by the factor loadings in Table
8.25. Factor 1 was affected mainly by K4, K2, K12, K7, KlO and Ki and Factor 2 by
KS, Ki 1 and K3. As the eigenvalue of both flictors is greater than one, the
morphological variation incorporated in each factor can be regarded as significant. The
nine characteristics affecting factors 1 and 2 may thus be regarded as the most reliable
criteria by which to make an identification of caprine distal tibiae to species and are
presented in rank order of reliability in Table 8.26.
Rank 1 2 3 4 5 6 7 8 9 Characteristic K4 K2 K12 K7 K10 Ki K5 Ku K3
Sulcus malleolaris (plantar view) Distal articular surface (dorsal view)
Interruption of plantar limbus of articular surface (distal view) Visibility of medial half of tibia (lateral view)
Dorso-medial section of artiailar surface (distal view)
Periphery of medial articular surface on prominence (dorsal view) Articular surface and synoveal foveola on plantar dorsal prominence Sulcus malleolaris (distal view)
Periphery of lateral side of dc,rsal prominence (dorsal view)
Table 8.26: Most Reliable Distal Tibia Characteristics in Rank Order
4 3 2
.', 0
C.,
U--2
-3
D
D
a 1 .
0 • Q"Ø
C -0 • 0
c JcpO 0 0000 ° Q
D11s
U
oo°o
0 b c 1g 4 %%cPO
O
00
a
0
a a
-4 _____________________ ______________________ D sheep
o goat
-4 -3 -2 -1 0 1 2 3 4
Fl (K1,K2,K4,K7K10K12)
Figure 8.16: Factor Scores of Each Analysed Caprine Distal Tibia The factor loadings of each analysed distal tibia are plotted in Figure 8.16
In Figure 8.16 the factor loadings of distal tibiae identified to species in the First Analysis fall into two separate clusters, one consisting of specimens previously identified as goats and the other consisting of specimens previously identified as sheep. This confirms that the clusters are a reflection of the morphological variation between the two species and suggests that all identifications obtained during the First Analysis are correct. The factor loadings of caprine specimens which could not be identified to species during the First Analysis fall into an intermediate cluster. 23 of these previously unidentified specimens, marked solid in Figure 8.16, fltll within the range of morphological variation of either goats and sheep as represented by the clusters of previously identified specimens and could therefore be assigned to one species or the other. The remaining 21 unidentified specimens fall in between the goat and sheep clusters and could not be identified to species by this method.
8.4.6: Principal Com ponents Analysis of Caprine Astragali:
Schematic drawings of the various astragalus morphological characteristics are provided in Figure 8.17.
Very High
G
High0
Medium
0
Low
Characteristic B51: Projection at Proximo-Plantar Angle of Medial Articular Ridge (Boessneck 1969)
Small and Horizontal Small and Angled Large and Angled Large and Highly Angled
Characteristic B62: Distal End of Medial Articutar Ridge (Boessneck 1969)
Straight Slightly Angled Angled Highly Angled
Characteristic B63: Lateral Articular Ridge (Boessneck 1969)
Figure 8.17: Schematic Drawings of Caprine Astragalus Morphological Characteristics
I
U U C
Very Strong Ridge Strong Ridge Hint of Ridge No Ridge
Characteristic B64: Articular Surface for Calcaneum (Boessneck 1969)
1 2 3 4
Hint Weak Large Very Large
Characteristic PF26: Protuberance on Medial-Antero Face (Prummel and Frisch 1986)
U
aC
1 2 3 4
Rectangular Angular Pointed Very Pointed
Characteristic PF27: End of Medial Condyfe (Prummel and Fnsch 1986)
Figure 8.17 (cont): Schematic Drawings of Caprine Astragalus MorphologicaJ Characteristics
Falls
Wobbles but
Over
Stays Upright
1 2 3 4
Characteristic PF28: Capsize Test (Prummel and Frisch 1986)
Figure 8.17 (cont): Schematic Drawings of Caprine Astragalus Morphological Characteristics
105 90 25 105 90 25 105 90 25 105 90 25 105 90 25 105 90 25 105 90 25 score 1 0 36 I 0 46 3 2 46 5 0 44 2 0 57 3 0 'I 0 4 71 9 score 2 0 36 6 6 38 8 25 36 3 6 36 4 30 20 5 13 44 5 I 3 score 3 35 11 3 43 3 7 48 4 7 45 4 8 37 4 4 29 16 4 4 I 0 score 4 51 0 3 42 0 1 20 0 I 47 0 1 20 0 1 37 1 I 75 5 6
The score counts and calculated factor loadings for the various morphological
characteristics of caprine astragali are presented in Tables 8.27 and 828 respectively.
characteristic B5 1 B5 1 B5 I 862 862 B62 B63 B63 B63 B64 1364 1364 PF26 PF26 PF26 PF27 PF27 PF27 PF28 PF28 PF28 Go Sheep GoatlSheep Goat Sheep Goat/Sheep Goat Sheep Goat/Sheep Goat Sheep Goat/Sheep Goat Sheep Goat/Sheep Goat Sheep Goat/Sheep Goat Sheep missing data 19 7 12 14 3 6 10 4 9 7 6 10 18 9 12 26 18 15 21 10 9
Iey characteris*ic=see Figure 8.17, speciesidcntification obtained in First AnaIysis n=MSP, score X=n specimens scoring X Ibr the particular characteristic, missing data=n specimens osi which the particular characteristic was not preserved
Table 8.27: Score Counts for Caprine Astragalus Characteristics
Characteristic B5 1 1362 863 864 PF26 PF27 PF28 Eigenvalue Pri,.Totl Factor 1 0 849438 0 846567 0.70534 0 808618 0.788942 0.680041 07 8753 4.312481 0.616069 Factor 2 0.14709 0.09876 -0 48773 -0.20372 0.20899 0 5293 2 -0.28123 0 7 36 8 0. 101957
Table 8.28: Factor Loadings for Caprine Astragalus Characteristics (Highest Factor Loadings in Red, Eigenvalue <1.0 in Blue)
The relative contribution of each characteristic to the overall morphological variation
between astragali of goats and sheep is demonstrated by the factor loadings in Table 8.28. Factor 1 was affected mainly by B51, B62, B64, PF28 and PF26 and Factor 2 by
PF27 and B63. Although the eigenvalue of factor i is greater than one, that of factor 2 is
not. Therefore only the morphological variation incorporated in factor I can be regarded
_____________________ _____________________ o sheep
0
o o
•
oRcf
D
1cr
00c3a3u
d8o .
o n 0
4
-4
3
2
I N U-aO C,,
10
N -1 U.
-2
-3
as making a significant contribution to overall morphological variation. The five
characteristics affecting factor I may thus be regarded as the most reliable criteria by
which to make an identification of caprine astragali to species and are presented in rank
order of reliability in Table 8.29.
Rank Characteristic Description
1 B51 Projection at proxiino-plantar angle of medial articular ridge 2 B62 Distal end of medial articular ridge
3 B64 Articular surface for calcaneum 4 PF28 Capsize test
5 PF26 Protuberance on medial-antero face
Table 8.29: Most Reliable Astragalus Characteristics in Rank Order
The factor loadings of each analysed astragalus are plotted in Figure 8.18.
Fl vs F2 atM Ghazat Goat, Sheep d 0/C Astragali (aM pheses)
o goat
-4 -3 -2 -1 0 1 2 3 4 • go/Sheep
Fl (851,B62,B64,PF2S,PF28)
Figure 8.18: Factor Scores of Each Analysed Caprine Astragalus
When interpreting Figure 8.18 it should be recalled that the eigenvalue of factor 2 for
astragali was less than one (see Table 8.28) and can therefore be ignored. The factor 1
loadings of astragali identified to species during the First Analysis fall into two clusters,
one consisting of specimens previously identified as goats and the other consisting of
specimens previously identified as sheep. This confirms that the clusters are a reflection
of the morphological variation between the two species and suggests that all
identifications obtained during the First Analysis are correct. The factor loadings of
caprine specimens which could not be identified to species during the First Analysis fall into an intermediate cluster. 15 of these previously unidentified specimens, marked solid in Figure 8.18, fall within the range of morphological variation of either goats and sheep as represented by the clusters of previously identified specimens and could therefore be assigned to one species or the other. The remaining 10 unidentified specimens fall in between the goat and sheep clusters and could not be identified to species by this method.
8.4.7: Principal Com
p
onents Analy
sis of Cap
rine Calcanea:Schematic drawings of the various calcaneum morphological characteristics are provided in Figure 8.19.
c7
\
c7
4
Strong Projection Projection Weak Projection Minimal Projection
Characteristic B65: Top of Tuber Calcanei (Boessneck 1969)
2 4
Much Longer Longer About Equal Shorter
Characteristic B66: Articular Area of Lateral Process (Boessneck 1969)
4 Clearly Separate Separate but Not Clear Joined but Not Clear Clearly Joined
Characteristic B68: Articular Surface for Astragalus (Boessneck 1969)
Figure 8.19: Schematic Drawings of Caprine Calcaneum Morphological Characteristics
1/fl
I
1 2 3 4
Very Broad and Short Broad and Short Long and Narrow Very Long and Narrow
Characteristic B401: Length and Build of Shaft (Boessneck 1969)
1 2 3 4
No Curve Slight Curve Strong Curve Very Strong Curve Characteristic B402: Extent of Plantar Curve of Shaft (Boessneck 1969)
1 2 3 4
Much Widening Some Widening Slight Widening Minimal Widening
Characteristic B403: Extent of Distal Widening (Boessneck 1969)
Figure 8.19 (cont): Schematic Drawings of Caprine Calcaneum Morphological Characteristics
1 2 3 4
Strongly Concave Concave Straight Convex
Characteristic PF29: Curve of Corpus Calcanei (Prummel and Fnsch 1986)
1 2 3 4
Obvious Hollow Slight Hollow Ridge Clear Ridge Characteristic PF3O: Shape Between Sustenaculum Tali and Medial Articular
Surface of Processus Anterior (Prummel and Frisch 1986)
Figure 8.19 (cont): Schematic Drawings of Caprine Calcaneum Morphological Characteristics
n 46 43 26 46 43 26 46 43 26 46 43 26 46 43 26 46 43 26 46 43 26 46 43 26 score I 0 2 0 0 12 2 0 23 3 0 5 0 3 19 7 0 8 2 0 9 0 21 3 score 2 4 14 2 16 3 0 11 4 3 14 10 16 17 9 7 15 12 I 22 9 0 10 3 score 3 10 6 4 16 6 9 10 5 4 17 13 6 13 4 15 14 3 19 5 12 12 7 10 score 4 8 0 0 20 0 3 33 2 14 2 2 4 0 0 15 0 3 18 1 0 31 0 2
The score counts and calculated factor loadings for the various morphological characteristics of caprine calcanea are presented in Tables 8.30 and 8.31 respectively.
characteristic B65 B65 B65 866 B66 B66 B68 868 B68 B40 I 8401 B40 I 8402 B402 8402 8403 8403 8403 PF29 PF29 PF29 PF3O PF3O PF3O Goat Sheep Goat/Sheep Goat Sheep Goat/Sheep Goat Sheep Goat/Sheep Goat Sheep Goat/Sheep Goat Sheep Goat/Sheep Goat Sheep Goat/Sheep Goat Sheep Goat/Sheep Goat Sheep missing data 24 21 20 9 9 9 3 3 13 12 9 8 10 6 6 9 6 6 8 6 4 3 5 8
Ke characteristic=see Figure 8.19, speciesidentification obtained in First Analysis, n=NISP, score X =n specimens scoring X r the particular characteristic, missing data=n specimens on which the particular characteristic was n preserved
Table 8.30: Score Counts for Caprine Calcaneuni Characteristics
Characteristic B65 866 868 8401 8402 8403 PF29 PF3O Eigenvalue Prp.TotI
0.5 180 16 0.592948 0 803055 0.580298 0.633469 0.702952 0763126 07 16 3.708234 0.463529
Factor 2 -0.1657 051324 0.439678 -o 60799 -0.09386 -0 52887 -0. 16539 0.427081 1.352102 0.169013
Table 8.31: Factor Loadings for Caprine Calcaneum Characteristics (Highest Factor Loadings in Red)
2
0 -
U--2
-3
-3 -2 -1 0 Fl (B68,PF29.PF3O)
2 3 4
and B66. As the eigenvalue of both factors is greater than one, the morphological
variation incorporated in each factor can be regarded as significant. The six
characteristics affecting factors 1 and 2may thus be regarded as the most reliable criteria
by which to make an identification of caprine calcanea to species and are presented in
rank order of reliability in Table 8.32.
Rank Characteristic B68
2 FF30
3 PF29
4 B40 I
5 B403
6 B66
Articular surface for astragalus
Shape between sustenaculum tall and med. artic. surface of anterior process Curve of corpus calcanei
Length and build of shaft Extent of distal widening Articular area of lateral process
Table 8.32: Most Reliable Calcaneum Characteristics in Rank Order
The factor loadings of each analysed calcaneum are plotted in Figure 8.20.
4
3
Q
ci
O 8 -•-• 10
DI cbq,°O
D0•
91
0-d0
c9J? 00ccbQ
o W
-a .
C]
-4
-4
o goat o sheep
goaUsheep
Figure 8.20: Factor Scores of Each Analysed Caprine Calcaneum
In Figure 8.20 the factor loadings of calcanea identffied to species in the First Analysis
fall into two separate clusters, one consisting of specimens previously identified as goats
and the other consisting of specimens previously identified as sheep. This conliims that
the clusters are a reflection of the morphological variation between the two species and
suggests that all identifications obtained during the First Analysis are correct. The factor
loadings of caprine specimens which could not be identified to species during the First