International Journal of Nanomedicine
Study of the intra-arterial distribution of Fe
3
O
4
nanoparticles in a model of colorectal neoplasm
induced in rat liver by MRI and spectrometry
José J Echevarria-Uraga1 Ignacio García-Alonso2 Fernando Plazaola3 Maite Insausti3 Néstor Etxebarria3 Alberto Saiz-López4 Begoña Fernández-Ruanova5
1Radiology Department, Hospital de Galdakao-Usánsolo, Bizkaia, Spain; 2Experimental Surgery Laboratory, Medicine Faculty, University of the Basque Country, Bizkaia, Spain; 3Faculty of Science and Technology, University of the Basque Country, Bizkaia, Spain; 4Pathology Department, Hospital de Galdakao-Usánsolo, Bizkaia, Spain; 5Osatek SA Unidad del Hospital de Galdakao-Usánsolo, Bizkaia, Spain
Correspondence: José Javier Echevarria-Uraga
Radiology Department, Hospital de Galdakao-Usánsolo, Barrio Labeaga s/n 48960-Galdakao, Bizkaia, Spain Tel +34 944 007 063 Fax +34 944 007 107 Email fizer@telefonica.net
Purpose: To evaluate, in an experimental model, the reliability of MRI for determining whether
a higher iron concentration was obtained in tumor tissue than in normal liver parenchyma after intra-arterial administration of Fe3O4 lipophilic nanoparticles.
Materials and methods: WAG/RijCrl rats were inoculated in the left hepatic lobe with
25,000 syngeneic CC-531 colon adenocarcinoma cells, after which they were randomized into two groups: control (CG) and infused (IG). After confirming tumor induction, the IG rats received intra-arterial suspensions of Fe3O4 nanoparticles (2.6 mg) in Lipiodol® (0.15 mL). To calculate
the iron concentration, [Fe], in the tumor and liver tissues of both groups of rats, measurements of signal intensity from the tumors, healthy liver tissue, and paravertebral muscles were made on a 1.5T MRI system in gradient-echo DP* and T2*-weighted sequences. In addition, samples were collected to quantify the [Fe] by inductively coupled plasma-mass spectrometry (ICP-MS), as well as for histological analysis. Statistical analysis was performed with non-parametric tests, and Bland–Altman plots were produced; P values ,0.05 were considered significant.
Results: In the CG rats (n = 23), the mean [Fe] values estimated by MRI and ICP-MS
were 13.2 µmol ⋅ g−1 and 5.9 µmol ⋅ g−1, respectively, in the tumors, and 19.0 µmol ⋅ g−1 and
11.7 µmol ⋅ g−1, respectively, in the hepatic tissue. In the IG rats (n = 19), the values obtained
by MRI and ICP-MS were 148.9 µmol ⋅ g−1 and 9.4 µmol ⋅ g−1, respectively, in the tumors, and
115.3 µmol ⋅ g−1 and 11.6 µmol ⋅ g−1, respectively, in the healthy liver tissue. The IG results
revealed a clear disagreement between MRI and ICP-MS. In the comparative analysis between the groups regarding the [Fe] values obtained by ICP-MS, significant differences were found for the tumor samples (P, 0.001), but not for the hepatic tissue (P= 0.92). Under microscopy, scattered intravascular deposits of nanoparticles were observed, especially in the tumors.
Conclusion: ICP-MS demonstrated significant uptake of exogenous iron in tumor tissue.
MRI was useful for quantifying the [Fe] in the different tissues in the CG animals, but not in the IG animals. Although the irregular distribution of nanoparticles caused an important bias in the measurements obtained by MRI, the relative increase in iron content inside the tumor was suggested.
Keywords: liver neoplasm, hepatic arterial infusion, ferromagnetic particle, iron concentration,
MRI, spectrometry
Introduction
Magnetic nanoparticles, when exposed to an external magnetic field, can produce an energy transfer, inducing hyperthermia. Their application in oncology has been tested on different types of tumors, especially in prostate cancer,1 and their usefulness
also has been proven in experimental models of kidney, liver, and breast cancer.2–4 In
neoplastic liver disease, one of the therapeutic options would be to administer a fluid
Dove
press
O R I G I N A L R E S E A R C H
open access to scientific and medical research
Open Access Full Text Article
International Journal of Nanomedicine downloaded from https://www.dovepress.com/ by 118.70.13.36 on 23-Aug-2020
For personal use only.
Number of times this article has been viewed
This article was published in the following Dove Press journal: International Journal of Nanomedicine
with magnetic properties that could be injected intra-arterially into tumor tissue, and which would induce thermal ablation when placed under an external magnetic field. This tech-nique could be used to reach neoplasms through the arterial bed, in a similar manner as the transarterial procedures of embolization, chemoembolization, and radioembolization.
Several super paramagnetic iron oxide nanoparticles (SPIONs) have demonstrated their usefulness as contrast agents in MRI. However, because of their physicochemical properties and characteristic biodistribution, they cannot be used as thermotherapeutic agents.5,6 We have developed a
fluid based on a suspension of iron oxide (Fe3O4) magnetic nanoparticles in Lipiodol® (Guerbet Laboratory, Villepinte,
France), for future use in thermotherapy for neoplastic liver disease. The iodized oil, Lipiodol®, was selected because of
its affinity with tumor tissue.7 As a preliminary step, prior
to assessing the real ability of the fluid to induce heating, we studied the hepatic intra-arterial distribution of the Fe3O4 nanoparticles in a model of colorectal carcinoma induced in rat liver. There were two purposes for doing so: to evaluate the characteristics of this fluid in terms of its affinity for neoplastic tissue and, more importantly, to develop a noninvasive diagnostic tool that will be effective in the assessment of the presence of nanoparticles in target tissues, which will potentially be very useful in human disease. To attain these objectives, we carried out morphological imaging studies and non-invasive measurements of the presence of iron in neoplastic and healthy liver tissues, using MRI. For quantifying the iron concentrations with MRI, we used a method based on changes in the signal intensity of the tissues due to the presence of different quantities of iron.8 Moreover,
to check the reliability of the results obtained by this method, we made quantitative iron measurements from tumor and liver samples harvested after necropsy, using inductively coupled plasma-mass spectrometry (ICP-MS), a technique that allows the concentration of different chemical elements in tissues to be quantified.
Materials and methods
Development of the experimental model
The study was carried out using 132 male, four-month-old, WAG/RijCrl rats. All the procedures were performed in accordance with current national legislation on animal experimentation. The rats were kept in an animal house under standard conditions, and they were analyzed in eleven consecutive series of twelve individuals. On day 0 of the experiment, to induce neoplastic liver disease, all the rats received subcapsular injections, into the left hepatic lobe,of 25,000 syngeneic cells of colon adenocarcinoma (cellular line: CC-531) suspended in 0.05 mL of Hank´s solution. After tumor cell inoculation, the rats were randomized into two groups:
• Infused Group (IG): rats that would be infused intra-arterially with nanoparticles.
• Control Group (CG): rats that would not be infused and would serve as basal measurements of tissue iron to be obtained using MRI and ICP-MS.
Anesthesia
During the process of tumor inoculation, the animals were maintained under halothane-induced anesthesia. For the procedures of magnetic fluid infusion and for the imaging tests, intraperitoneal anesthesia was administered, with a combination of diazepam (25 mg/kg) and ketamine (100 mg/kg).
Magnetic fluid
Ultra-small, magnetic, iron oxide (Fe3O4) nanoparticles, ranging between 4 and 7 nm, were synthesized by decom-position of iron precursor at high temperatures in organic solvent. In our experiments, we obtained iron nanoparticles coated with oleic acid by the reduction of iron (III) acetylac-etonate by 1,2-hexadecanediol in a suspension of oleylamine and oleic acid in phenyl ether.9 The lipid nature of these
ligands allows the particles to be suspended in the iodized oil Lipiodol®. Suspensions of 3.5 mg of nanoparticles in
0.2 mL of Lipiodol® were prepared for intra-arterial hepatic
infusion in each animal.
Infusion procedure
The morphological characteristics of neoplastic tissue, even when only approximately 1 mm in diameter, enables it to be readily distinguished from healthy liver parenchyma by macroscopic visual examination.10 On day 28 after tumor
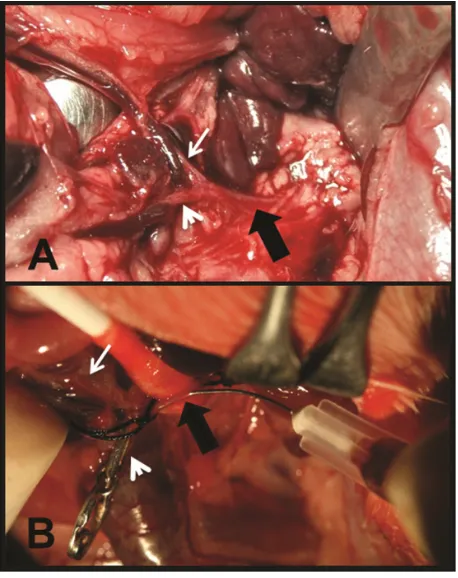
cell inoculation, a midline laparotomy was performed on each animal to assess hepatic tumor development. In both groups, rats in which no tumors were observed were rejected, and the subset of IG rats with neoplastic tissue received the magnetic fluid. The magnetic fluid infusion procedure required the exposure of the visceral arterial vessels. Using a surgical microscope (Leika M651), the celiac trunk was identified and, using removable surgical staples, its main branches clamped, except for the hepatic artery, with the aim of driving most of the celiac vascular flow toward this artery. Then, using a 30G needle that was connected to an infusion pump previously filled with the fluid, the celiac trunk was directly punctured, and the suspension was infused Dovepress Echevarria-Uraga et al
International Journal of Nanomedicine downloaded from https://www.dovepress.com/ by 118.70.13.36 on 23-Aug-2020
slowly (over 3 minutes) (Figure 1). The progression of the suspension was monitored visually through the microscope; each rat received a maximum of 0.15 mL of magnetic fluid containing 2.6 mg of iron. Before removing the clamps and the needle, ligatures were tied around the celiac artery. Finally, the laparotomy was closed.
MRI: sequences and procedures
Within the first twelve hours after infusion of the fluids, an MRI was performed on a 1.5T Siemens Symphony system (Siemens, Erlangen, Germany), using a standard cranial coil. Axial STIR [repetition time: 3600 ms; echo time: 20 ms; inversion time: 130 ms (3600/20/130); section thickness: 3 mm; intersection gap: 0.3 mm; matrix: 288 × 512] and gradient-echo (GRE) [120/4(DP*) and 120/14(T2*); flip angle: 20°; section thickness: 3 mm; intersection gap: 0.3 mm; matrix DP*: 288 × 512; matrix T2*: 288 × 512] weighted sequences were made.
Hyperintense masses observed inside the liver on the STIR sequences were considered to be neoplastic lesions. In an attempt to assess differences in concentration of iron
nanoparticles in the tissues, we used GRE sequences, which are known to be useful in the diagnosis of iron overload.8 We
considered that the homogeneous decay of signal intensity (SI) from the liver and tumors, in GRE sequences performed on the IG rats, could be attributed to the presence of iron nano-particles in these tissues, and it was taken to be evidence of proper vascular diffusion of the suspensions.11 In both groups
of rats, we made measurements of SI obtained from the tumors, healthy liver tissue, and paravertebral muscles, with both DP* and T2*-weighted sequences. The SI values obtained from an ROI located in these tissues allowed the calculation of the SI ratio (SIr) of the different tissues. The hepatic SI ratio (hSIr) was defined as the ratio between the SI values from healthy liver tissue and paravertebral muscle, and the tumor SI ratio (tSIr) was defined as the ratio between the values from tumor tissue and muscle. Furthermore, from the MRI, it was possible to calculate the tissue iron concentration, [Fe], in micromoles per gram of dry liver, according to the following formula: [Fe] µmol ⋅ g−1= e(5.808−(0.877 × T2*SIr)−(1.518 × DP*SIr).8 This approach
allowed the presence of different quantities of iron in the tumor and healthy tissues to be assessed non-invasively and, thus, the different concentrations of nanoparticles to be estimated, once the correlation of these values with those obtained by ICP-MS were determined. The results achieved in the CG rats were expected to reflect endogenous hepatic iron, mainly present in hepatocytes and in blood hemoglobin, while the results obtained in the IG rats were expected to reflect a mixture between the endogenous iron and the exogenous iron from the magnetic fluid.
Necropsy: evaluation of tumor induction
and quantification of iron by ICP-MS
After the imaging studies, the IG and CG rats were euthanized. The livers were extracted, and the neoplastic lesions were excised. Tumor volumes were calculated in mm3 accordingto the following formula:
Longest diameter × (Shortest diameter)2/2.12
To study the healthy liver tissue from all the rats, tis-sue fragments weighing at least 100 mg were collected. Once labeled, metastases and liver samples were processed to measure [Fe]. For iron quantification, samples were subjected to a digestion process in acid, and the resulting solutions were analyzed by ICP-MS. In our experiments, this technique yielded values of average [Fe] in micrograms per gram, [Fe] µg ⋅ g−1, of wet tissue. To make comparisons
between the results obtained with ICP-MS and with MRI, however, it was necessary to transform the values from µg ⋅ g−1
Figure 1 (A)Midline laparotomy. Retraction of the spleen and stomach. Celiac trunk (thick black arrow), hepatic artery (thin white arrow), and gastroduodenal artery (white arrowhead). (B) Exposure of the celiak trunk. Direct puncture of the artery with a 30G needle. Celiac trunk (thick black arrow) and hepatic artery (thin white arrow). The gastroduodenal artery appears clamped by a removable surgical staple (white arrowhead).
Dovepress Evaluation of intra-arterial distribution of Fe3O4 nanoparticles into tumors
International Journal of Nanomedicine downloaded from https://www.dovepress.com/ by 118.70.13.36 on 23-Aug-2020
of wet tissue to µmol ⋅ g−1 of dry tissue: [Fe] µmol ⋅ g−1 dry
tissue = [Fe] µg ⋅ g−1 wet tissue x f /55.8; where 55.8 is the
atomic weight of iron, and f is a variable describing the water content of the tissues. The water content in rat liver is about 70%,13,14 and, accordingly, the [Fe] calculated per gram of wet
liver is 3.33-fold lower than per gram of dry liver; therefore, f for liver corresponded to 3.33. On the other hand, water content in tumors is higher; in our estimates, we considered the water content to be 80%,14 hence an f of 5.
Histological analysis
Samples of liver and tumor were obtained from 12 IG rats with tumor volumes greater than 100 mm3. The samples were
placed in 10% formalin and stained with hematoxylin-eosin and Perls’ Prussian blue for optical microscopy. Microscopy was used to look for acute inflammatory changes or necrotic areas associated with the infusion of the magnetic fluid, and for highlighting the iron deposits within vascular structures.
Statistical analysis
Quantitative variables are described by their mean and stan-dard deviation (SD). For SIr and [Fe] values, the median (Md) and interquartile range (IQR) also were calculated. Ratios were used as appropriate. Statistical analysis was carried out using non-parametric tests (Wilcoxon test for related samples), and comparisons between pairs of groups were performed using the Mann–Whitney U test. For two-variable data sets, we produced scatter plots and box plots, and to
evaluate the statistical dependence between two variables, we used Spearman´s rho. To assess agreement between the differences in the measurements obtained by MRI and ICP-MS, the Bland–Altman plot was used. P values ,0.05 were considered significant.
Results
On day 28, we found tumors in 81 rats. In 23 CG and 19 IG rats, it was possible to perform all the procedures. The other 39 were not suitable, due to deficiencies in the process of infusion (n = 8), or because there was very little tumor tis-sue to be seen on the MRI or to be measured by ICP-MS (n = 31).
The mean weights of the CG and IG animals were 288 g (SD = 34.7) and 292 g (SD = 38.4), respectively, (P= 0.7). The mean volume of the tumors induced in the CG was 172.9 mm3 (SD = 91.6), and in the IG it was 138.4 mm3
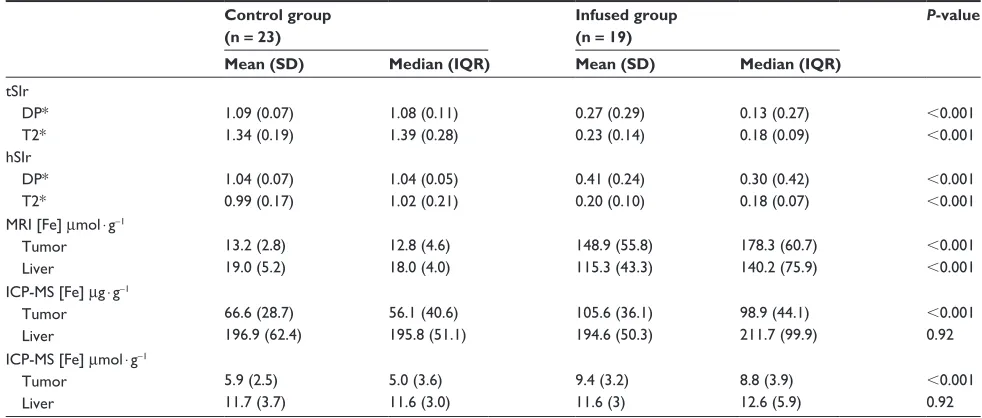
(SD = 107.7); the difference between these values was not significant (P= 0.21). The IG rats were infused with a mean of 0.12 mL (SD = 0.02) of the magnetic fluid, meaning that they received a mean of 2.21 mg (SD = 0.49) of nanoparticles intra-arterially. The results of the measurements described below are reported in Table 1, by group of rats.
Results for CG rats
On the MRI, neoplastic masses were detected on STIR images as hyperintense nodes in the liver. On the GRE images, the tumor implants appeared with slightly hyperintense SI compared to the liver parenchyma; this fact allowed tSIr
Table 1 Results of the measurements in the two groups of rats
Control group (n = 23)
Infused group (n = 19)
P-value
Mean (SD) Median (IQR) Mean (SD) Median (IQR)
tSIr DP* T2* 1.09 (0.07) 1.34 (0.19) 1.08 (0.11) 1.39 (0.28) 0.27 (0.29) 0.23 (0.14) 0.13 (0.27) 0.18 (0.09) ,0.001 ,0.001 hSIr DP* T2* 1.04 (0.07) 0.99 (0.17) 1.04 (0.05) 1.02 (0.21) 0.41 (0.24) 0.20 (0.10) 0.30 (0.42) 0.18 (0.07) ,0.001 ,0.001 MRI [Fe] µmol ⋅ g−1
Tumor Liver 13.2 (2.8) 19.0 (5.2) 12.8 (4.6) 18.0 (4.0) 148.9 (55.8) 115.3 (43.3) 178.3 (60.7) 140.2 (75.9) ,0.001 ,0.001 ICP-MS [Fe] µg ⋅ g−1
Tumor Liver 66.6 (28.7) 196.9 (62.4) 56.1 (40.6) 195.8 (51.1) 105.6 (36.1) 194.6 (50.3) 98.9 (44.1) 211.7 (99.9) ,0.001 0.92 ICP-MS [Fe] µmol ⋅ g−1
Tumor Liver 5.9 (2.5) 11.7 (3.7) 5.0 (3.6) 11.6 (3.0) 9.4 (3.2) 11.6 (3) 8.8 (3.9) 12.6 (5.9) ,0.001 0.92
Notes: Using MRI, the iron concentration estimates are for dry tissue. For ICP-MS, the iron concentrations expressed in µg ⋅ g−1 are the values calculated from wet tissue,
and these values are transformed into µmol ⋅ g−1 for the purpose of comparison.
Abbreviations: SD, standard deviation; IQR, interquartile range.
Dovepress Echevarria-Uraga et al
International Journal of Nanomedicine downloaded from https://www.dovepress.com/ by 118.70.13.36 on 23-Aug-2020
and hSIr values to be calculated for DP* and T2*-weighted sequences (Figure 2). On the DP* and T2*-weighted images, the mean tSIr values were 1.09 and 1.34, while the mean hSIr values were 1.04 and 0.99, respectively. The mean values of [Fe] in tumor and healthy liver tissues that were estimated using MRI were 13.2 and 19 µmol ⋅ g−1 of dry
tissue, respectively.
The mean values of [Fe] in the tumor and liver tissues, obtained using ICP-MS, were 66.6 µg ⋅ g−1 and 196.9 µg ⋅ g−1,
respectively. After transforming these values, the mean values of [Fe], in µmol ⋅ g−1 calculated, were 5.9 and 11.7 µmol ⋅ g−1
of dry tissue, respectively.
In the comparative analysis of SIr values between tumor and healthy liver tissue, we obtained the following results:
• DP* tSIr vs DP* hSIr, P = 0.042, slightly significant differences.
• T2* tSIr vs T2* hSIr, P , 0.001, a high degree of statistical significance.
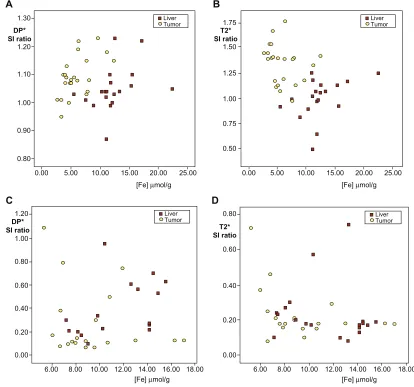
In the same context, when we generated scatter plots to assess the correlation between the different SIr values calculated on the DP* and T2*-weighted images, and the [Fe] quantities obtained by ICP-MS, we observed similar values of DP* SIr from the tumor and healthy liver tissue. On the other hand, with respect to the T2* data, the higher quantities of iron present in healthy liver tissue provoked an evident decrease in hSIr (Figure 3).
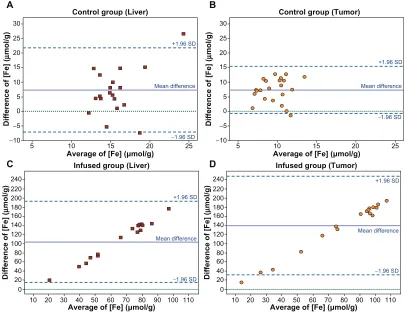
The Bland–Altman plot revealed excellent agreement between the results of the measurements obtained by MRI and by ICP-MS, in both the tumors and healthy livers (Figure 4). However, in the comparative analysis between [Fe] µmol values obtained by the two techniques, we found significantly
(P, 0.001) lower quantities of iron by ICP-MS than by MRI. Moreover, a difference also was observed in the ratios of the mean [Fe] values obtained by the two techniques: with MRI, the results were 2.2-fold higher for tumors and 1.6-fold higher for healthy liver tissue.
Finally, we performed statistical analyses to look for a relationship between tumor volume and [Fe] values obtained by ICP-MS; however, we found only a weak correlation (r = 0.44, P= 0.03).
Results for IG rats
On the STIR images, the tumor implants appear as hyperin-tense nodes. On the GRE sequences, especially on the T2* images, the IG rats showed a marked decrease in SI of the tumor and hepatic tissues, attributable to the presence of magnetic nanoparticles. This fact made it difficult to identify correctly the areas for measurement; nevertheless, it was possible to use the STIR images as a guide to locate the ROI properly over the neoplastic tissue on the GRE images (Figure 2). On the DP* and T2*-weighted images, the mean tSIr values were 0.27 and 0.23, and the mean hSIr values were 0.41 and 0.2, respectively. The mean values of the [Fe] of the tumor and healthy liver tissues obtained by MRI were 148.9 and 115.3 µmol ⋅ g−1 of dry tissue, respectively.
By ICP-MS and from samples harvested after necropsy, we obtained the [Fe] in µg ⋅ g−1 of tumor and of healthy
liver tissue. The mean [Fe] values were 105.6 µg ⋅ g−1 for
the tumors and 194.6 µg ⋅ g−1 for healthy liver tissue. After
transformation, these yielded mean [Fe] values, quantified by ICP-MS, of 9.4 µmol ⋅ g−1 for the tumors, and 11.6 µmol ⋅ g−1
for healthy liver tissue.
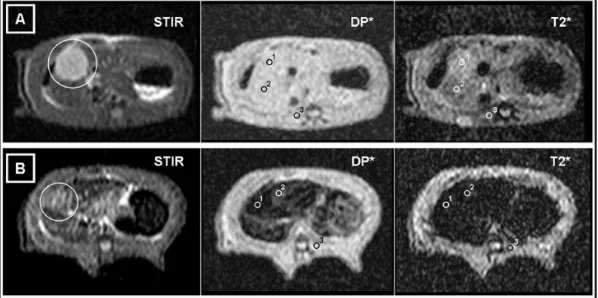
Figure 2 MRIs of two different animals. Axial STIR, DP*, and T2*-weighted sequences at the same slice position. ROIs are located for obtaining measurements of the SI in (1) tumor implants, (2) liver, and (3) paravertebral muscles. (A) MRI of a CG rat. On the STIR image, the liver and the paravertebral muscles are seen to have a similar SI, while the tumor tissue appears hyperintense (white circle). On the DP* image, the neoplastic tissue is not clearly seen. On the T2* image, the tumor appears slightly hyperintense compared to healthy liver tissue. (B) MRI of an IG rat. On the STIR image, the liver and the paravertebral muscles are seen to have a similar SI, while the tumor tissue appears hyperintense (white circle). On the DP* and T2* images, it can be seen that there is a substantial decrease in the SI from healthy liver and, especially, from tumor tissue, due to the presence of magnetic nanoparticles.
Abbreviations: MRI, magnetic resonance imaging; ROI, region of interest; SI, signal intensity; CG, control group; IG, infused group.
Dovepress Evaluation of intra-arterial distribution of Fe3O4 nanoparticles into tumors
International Journal of Nanomedicine downloaded from https://www.dovepress.com/ by 118.70.13.36 on 23-Aug-2020
In the comparative analysis between SIr values, the results were as follows:
• DP* tSIr vs DP* hSIr, P= 0.03, significant differences.
• T2* tSIr vs T2* hSIr, P = 0.53, non-signif icant differences.
Again, we produced scatter plots to assess the correlation of the SIr calculated on the DP* and T2*-weighted images with the [Fe] values obtained by ICP-MS (Figure 3). In this case, the DP* values of the tumor and healthy liver tissues showed wide variation and, contrary to what had been expected, there was no clear pattern of hSIr decreasing with increasing [Fe]. Nevertheless, the values obtained on T2*-weighted images were less widely dispersed, and the SIr values from the tumor and healthy liver tissues fell progressively with increasing [Fe].
When we compared the two measurement techniques – MRI and ICP-MS – the Bland–Altman plot revealed a clear disagreement, due to the values obtained from the MRI (Figure 4).
When we compared the results of tumor volumes with the [Fe] values quantified by ICP-MS, we observed that the pres-ence of iron and, accordingly, the uptake of this metal, was higher in smaller tumor implants (Figure 5). In the statistical analysis to assess the relationship between tumor volume and metal concentration values, we found a moderately strong correlation (r =−0.56, P= 0.01).
Finally, when we looked for potential correlations between the different volumes of magnetic fluid infused and other variables, such as tumor volume and [Fe] µg ⋅ g−1 of tumor, we
found no relationship (r =−0.03 and r = 0.04, respectively).
1.30 Liver
Tumor
A
1.20
DP* SI ratio
1.10
1.00
0.90
0.80
0.00 5.00 10.00 15.00
[Fe] µmol/g 20.00 25.00
1.20 Liver
Tumor
1.00
DP* SI ratio
0.80
0.60
0.40
0.20
0.00
6.00 8.00 10.00 12.00
[Fe] µmol/g
14.00 16.00 18.00
1.75 LiverTumor
B
1.50
T2* SI ratio
1.25
1.00
0.75
0.50
0.00 5.00 10.00 15.00
[Fe] µmol/g 20.00 25.00
0.80 Liver
Tumor
D C
T2* SI ratio
0.60
0.40
0.20
0.00
6.00 8.00 10.00 12.00
[Fe] µmol/g
14.00 16.00 18.00
Figure 3 Scatter plot of the iron concentration values quantified using ICP-MS against the SI ratio from healthy liver and tumor tissues, calculated from DP* and T2*-weighted images. Control rats, (A) DP* and (B) T2*. In DP* sequence images, the values obtained are similar, but in the case of T2*-weighted sequences, significantly lower values for the healthy liver can be seen. Rats infused with magnetic fluids, (C) DP* and (D) T2*. In both the DP*- and T2*-weighted images, the SIr in the tumors tends to progressively decrease with increasing iron in the tumor tissue. In the healthy liver tissue, the trend is not as clear, which is probably related to differences in the endogenous and exogenous [Fe], which affects the measurement of the metal in the tissue.
Abbreviations: ICP-MS, inductively coupled plasma-mass spectrometry; SI, signal intensity; Slr, signal intensity ratio; [Fe], iron concentration.
Dovepress Echevarria-Uraga et al
International Journal of Nanomedicine downloaded from https://www.dovepress.com/ by 118.70.13.36 on 23-Aug-2020
Comparative analysis between groups
In the comparative analysis between the CG and IG rats regarding the results of tSIr, hSIr, and quantification of [Fe] by MRI, we found significant differences in all cases (P , 0.001). Regarding the ICP-MS measurements, the results obtained from the tumors demonstrated that the quantity of metal in the IG rats was significantly greater than in the CG animals, (P, 0.001). However, in the analysis of the healthy liver samples, no significant differences were found (P= 0.92) (Figure 6).Histological analysis in IG rats
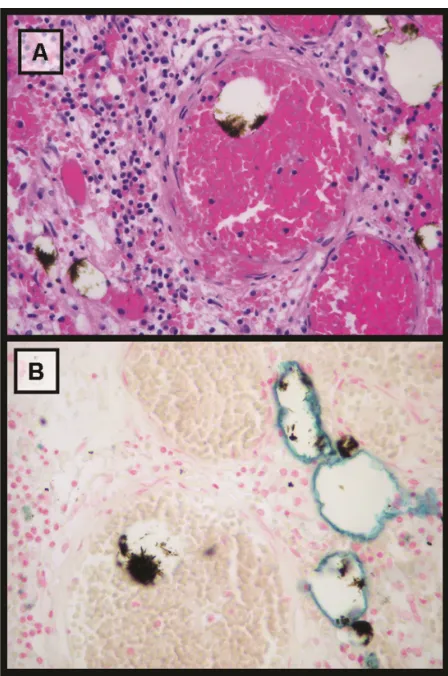
In the macroscopic visual examination of the samples, we observed several dark deposits of magnetic fluid within the tumors. Under microscopy, the tumor samples showed scattered deposits of fluid within vascular structures, and their distribution was very irregular. In the analysis of the liver, we observed sinusoidal congestion, scattered foci of inflammatory cells, and hepatocyte necrosis, associated with patchy infarction phenomena. Moreover, Perls’ Prussian blue
stain demonstrated iron deposits along the inner walls of the vessels, especially into the tumor tissue (Figure 7).
Discussion
Local therapies, such as radiofrequency thermal ablation and transarterial chemoembolization, developed for patients with nonoperable metastatic liver disease, are only partially effective.15–18 As such, there is a clear need
for new therapeutic procedures to be developed for these patients. Despite its limitations, thermotherapy offers an important advantage in antitumor therapy – its low systemic toxicity. This has prompted the study of the use of metallic magnetic nanoparticles for generating hyperthermia in local therapy of neoplastic pathologies. With procedures that involve direct insertion into the bed of the tumor, magnetic nanoparticles have been used in experimental models of cancer,2–4 and at a clinical level in various types of recurrent
neoplasia.1,19 However, at an experimental level, it has been
demonstrated that a more homogeneous distribution of nanoparticles in neoplastic tissues can be achieved by intra-Control group (Liver)
Average of [Fe] (µmol/g)
+1.96 SD
Mean difference
−1.96 SD
Difference of [Fe]
( µ mol/g ) 30 A C B D 25 20 15 10 5
5 10 15 20 25
0
−5
−10
Control group (Tumor)
Average of [Fe] (µmol/g)
+1.96 SD
Mean difference
−1.96 SD
Difference of [Fe]
( µ mol/g ) 30 25 20 15 10 5
5 10 15 20 25
0
−5
−10
Infused group (Liver)
Average of [Fe] (µmol/g)
+1.96 SD
Mean difference
−1.96 SD
Difference of [Fe]
( µ mol/g) 240 200 220 180 140 160 120 80 100
10 20 30 40 50 60 70 80 90 100 110
60
20 40
0
Infused group (Tumor)
Average of [Fe] (µmol/g)
+1.96 SD
Mean difference
−1.96 SD
Difference of [Fe]
( µ mol/g) 240 200 220 180 140 160 120 80 100
10 20 30 40 50 60 70 80 90 100 110
60
20 40
0
Figure 4 Bland–Altman plot. The relationship between pairs of values of tissue iron concentration in µmol ⋅ g−1 as assessed using MRI and ICP-MS. On the x-axis, the average
of the values obtained using the two techniques: (MRI+ICP-MS)/2; on the y-axis, the difference between the results obtained: MRI−ICP-MS. Results in CG rats: (A) liver and (B) tumors. There is excellent agreement between the two measurement techniques: in both A and B, the means of the differences between the results obtained by the two techniques are similar. Results in IG rats: (C) liver and (D) tumors. There is notable disagreement, attributable to the high values estimated by MRI.
Abbreviations: ICP-MS,inductively coupled plasma-mass spectrometry; CG, control group; IG, infused group.
Dovepress Evaluation of intra-arterial distribution of Fe3O4 nanoparticles into tumors
International Journal of Nanomedicine downloaded from https://www.dovepress.com/ by 118.70.13.36 on 23-Aug-2020
200.00
180.00
160.00
140.00
120.00
100.00
80.00
60.00
0.00 100.00 200.00 300.00
Tumor volume (mm3)
[Fe] µg/g tumo
r
400.00 500.00
Figure 5 Scatter plot of the tumor volume of the infused rats against [Fe] in µg ⋅ g−1, determined using ICP-MS.
Note: The measured iron tissue concentration is higher in the smallest lesions.
*21
20
39
40
10 9
Tumor [Fe] µg/g Liver [Fe] µg/g 400
300
100 200
0
Control group Infused group
Groups of rats
Figure 6 Box plot, graphical representation of the quantification of the metal by ICP-MS, in liver and tumor tissues, in the two groups of animals. Note: A significantly higher [Fe] can be observed in the tumors of IG animals.
Abbreviations: ICP-MS, inductively coupled plasma-mass spectrometry; IG, infused group.
Dovepress Echevarria-Uraga et al
International Journal of Nanomedicine downloaded from https://www.dovepress.com/ by 118.70.13.36 on 23-Aug-2020
arterial administration, which may enable the hyperthermia to be generated, and therefore, the treatment, to be more effective.3
Intratumor distribution of magnetic fluids by vascular administration has been studied in several neoplastic models induced by direct inoculation of tumor cells into the liver.3,20,21 In general, these studies are based on the fact that
the vascular supply of the neoplastic tissue comes exclusively via the hepatic artery.3,22 This characteristic would allow the
selective deposition of nanoparticles into tumors, thereby avoiding lesions in healthy liver parenchyma. Therefore, the evaluation of the distribution of the fluids in an experimental model is of crucial importance before assessing their hypothetical ability to induce thermal effects. Taking into account that MRI has demonstrated high sensitivity to iron nanoparticles, this technique could be useful for evaluating their presence in different tissues inside the liver. In fact, several SPIONs currently are being used as contrast agents
in MRI, especially for detecting tumor lesions in the liver. After intravascular injection, the SPIONs are phagocytosed by the Kupffer cells; these cells are present in the hepatic parenchyma and in some liver tumors, but not in metastatic tissue. The accumulation of iron inside the Kupffer cells provokes a decrease of the SI of the tissues, which indirectly enhances the metastasic tissue as a non-modified area.5,6
However, in our study, as we were looking to obtain the deposition of enough iron nanoparticles in the metastases but not in the liver parenchyma, SPIONs could not be used, so we had to develop a different kind of nanoparticle. Ultra-small, lipophilic, magnetic iron oxide nanoparticles, due to their smaller size, avoid phagocytosis by Kupffer cells, and can be suspended in an iodized oil, which shows high affinity for the tumor tissue.
For our study, it was necessary to obtain two groups of animals with very similar physiological characteristics. Under normal conditions, the rat liver contains variable amounts of iron, which may depend on several factors, including age, sex, and body weight. On the other hand, tumors also contain iron, the content of which may vary due to differences in vascularization and in necrosis, related to tumor volume. To avoid bias arising from such variations, the two groups included only male rats, of the same age, with very similar tumor volumes and weights. In relation to this, in our study, tumor volume was not found to have a great influence on the amount of iron in tumor tissue quantified in CG rats; there was, however, a clear volume effect in the IG rats, with the smallest lesions showing higher exogenous iron uptake.
The STIR sequences allowed us to identify the tumors correctly in all the animals, and they were not affected by the presence or absence of the magnetic fluid. On the other hand, in the GRE sequences, the effect of the magnetic fluid was clear, with a decrease in the SI, in both healthy tissue and tumors, allowing us to establish a rough qualitative assessment of the suitability of the intravascular infusion procedure.11
We quantified the various different concentrations of iron by MRI and by ICP-MS. In order to compare the results obtained using the two techniques, it was necessary to convert the measurements to the same units; this process involved various correction factors. In particular, it should be noted that the value for the tumor water content was estimated theoretically from the literature, and it might be a conservative estimate. In the CG rats, the liver [Fe] values obtained by ICP-MS, and the SIr values observed in the healthy liver tissue and the tumors, were in agreement with or similar to figures published elsewhere.8,23 In these rats, there
Figure 7 Microscopic analysis (25×) of tumor tissue stained with hematoxylin-eosin and Perls’ Prussian blue. (A) Hematoxylin-eosin stain. Scattered brown deposits of magnetic fluid within vascular structures can be observed. (B) Perls’ Prussian blue. The iron in the deposits of the magnetic fluids does not appear stained, probably due to the intense aggregation. Moreover, non-aggregated iron nanoparticles can be observed as a blue line over the inner edge of the vascular structures.
Dovepress Evaluation of intra-arterial distribution of Fe3O4 nanoparticles into tumors
International Journal of Nanomedicine downloaded from https://www.dovepress.com/ by 118.70.13.36 on 23-Aug-2020
was a significant decrease in hSIr compared to tSIr, especially in the T2* sequences, due to the higher quantities of iron in the liver, and as a clear indication of the greater sensitivity of these sequences to small changes in [Fe].
Bland–Altman plots are useful for revealing relationships between the differences and the magnitude of measurements, to look for any systematic bias, and to identify possible outliers.24 In the CG rats, this approach indicated a good
level of agreement between the results obtained by MRI and by ICP-MS. Nevertheless, the statistical analysis revealed significant differences between the values estimated by the two techniques. Specifically, using MRI, the values were higher overall, and 1.3 times higher in the tumors than in the healthy liver tissue. Given the relatively low concentration of iron to be measured, technical limitations of the MRI procedure used may explain this discrepancy to some extent. On the other hand, the results obtained with the sequences used, designed to assess human liver tissue, seemed to require a correction factor; this is probably due to differences in water content in the tissues, which in rats is at least 10% higher in neoplastic tissue than in healthy liver tissue. In these animals, such a correction could provide better agreement with the iron values obtained by ICP-MS.
In the IG rats, differences in the volume of fluid infused did not significantly affect the measurements. In these ani-mals, ICP-MS results indicated a significant increase in [Fe] with respect to baseline values, only in tumor tissue and in relationship with the presence of exogenous iron, the esti-mated value of which was 39 µg ⋅ g−1. However, using MRI,
a marked decrease in SI was detected both in the healthy liver and in the tumors, indicating the presence of exogenous metal in these territories and in a large amount, much higher than that estimated using ICP-MS.
This finding was clear in the Bland–Altman graphs, where a great discrepancy was observed between the measurements obtained with ICP-MS and those obtained with MRI, especially in the tumor lesions. With MRI, the [Fe] measurements were in disagreement not only in mag-nitude, but also in contrast to ICP-MS; the imaging detected a higher absolute concentration of iron in the tumors than in the healthy liver tissue. Finally, in the same context and in the SIr analysis, the values from the T2* sequences were low overall, while there was marked variability in values from the DP* sequences, especially with regard to the liver values. These findings probably indicate a systematic bias, associated with the method and the formula used to quantify [Fe] with MRI. Furthermore, it must be considered that
the formula used was developed to measure iron deposits in the hepatocytes, and its usefulness for quantifying iron located in the extracellular medium was not evaluated in previous studies.
The explanation for all these results was found at the histological level, partly due to differences in the proportion of endogenous and exogenous iron in the two types of tissue, and partly due to irregularity in its distribution. Specifically, microscopy studies of the liver and tumor samples revealed that the infused fluid, despite reaching most regions, did so unevenly. Furthermore, in our model, we found that there was aggregation of iron nanoparticles, probably resulting from hydrophobic inter-actions due to the lipid nature of the suspension medium. Indeed, it has been demonstrated, in in vitro studies, that nanoparticles added to a culture medium tend to form aggregates, due to magnetic attraction forces or hydro-phobic interactions,25 and that these aggregates result in a
drastic shortening in T2 relaxation times of water protons.26
Therefore, a heterogeneous distribution of the magnetic fluid in the liver, due to its lipid nature, would lead to a displacement of the iron present in blood under normal circumstances, by a mechanism of incomplete sinusoidal embolization.27 This may explain why the [Fe] values in
the CG and IG were similar using ICP-MS, as well as the high level found using MRI in the IG animals, which were carriers of aggregated exogenous iron. On the other hand, the vascular tree is less well structured in tumors; it has
been demonstrated that they accumulate more Lipiodol®
than neighboring healthy liver tissue,7,28 and they have a
lower baseline [Fe]. In tumors, the displacement of blood would have less effect than that provoked by the deposit of magnetic fluid aggregates. This exogenous iron would be responsible for the dramatic shortening in the T2 relaxation time and for the high [Fe] obtained from MRI measurements, which would reflect a higher concentration of exogenous iron in neoplastic tissue.
In summary, we found several limitations in our work. The MRI system used is not specifically designed for small animals, which could lead to certain inaccuracies. Regarding the sequences used, we observed that it was necessary to take into account the water content of the different tissues in order to obtain more accurate estimates of [Fe]. More-over, the magnetic fluid has shown, at the histological level, a heterogeneous vascular distribution into the tissues with formation of aggregates of iron, and this fact prevents the sequences of MRI used to evaluate properly the intravascular deposits of exogenous iron.
Dovepress Echevarria-Uraga et al
International Journal of Nanomedicine downloaded from https://www.dovepress.com/ by 118.70.13.36 on 23-Aug-2020
Despite these limitations, however, it is possible to draw some interesting conclusions from this study. The magnetic fluid showed a higher affinity for the neoplastic tissue than for the healthy hepatic tissue. Moreover, in baseline in vivo conditions, our experiment rendered a reasonable agreement between the [Fe] calculated by MRI and by ICP-MS. In addition, despite the fact that MRI was not able to quantify the exogenous iron accurately, the findings indicate that this technique is highly sensitive to this variable, as it did indicate a higher concentration of this metal in the neoplastic tissue.
On the basis of these findings, we believe that further research is required into non-aggregating nanoparticles. In particular, it would be interesting to use ultra-small, hydro-philic, magnetic nanoparticles functionalized with carbo-hydrates, silica, antibodies, or peptides,5,6,29 which would
be able to diffuse more homogeneously, and could display greater biocompatibility and a higher affinity for tumor cells. If these hypotheses prove to be true, then an investigation of the real potential of MRI for determining the distribution of thermotherapeutic nanoparticles in various types of tissue should be carried out.
Acknowledgments
This project has been possible thanks to funding from the 2008 and 2010 Grants for Research Projects from the Departments of Health and Industry of the Basque Govern-ment, and from the program for FIS Research Projects of the Carlos III Health Institute of the Spanish Ministry of Science and Innovation.
Disclosure
The authors report no conflicts of interest in this work.
References
1. Johannsen M, Gneveckow U, Thiesen B, et al. Thermotherapy of prostate cancer using magnetic nanoparticles: feasibility, imaging,
and three- dimensional temperature distribution. Eur Urol. 2007;52(6):
1653–1661.
2. Bruners P, Braunschweig T, Hodenius M, et al. Thermoablation of malignant kidney tumors using magnetic nanoparticles: an in vivo
feasibility study in a rabbit model. Cardiovasc Intervent Radiol. 2010;
33(1):127–134.
3. Moroz P, Jones SK, Gray BN. Tumor response to arterial embolization hyperthermia and direct injection hyperthermia in a rabbit liver tumor
model. J Surg Oncol. 2002;80(3):149–156.
4. Hilger I, Hiergeist R, Hergt R, Winnefeld K, Schubert H, Kaiser WA. Thermal ablation of tumors using magnetic nanoparticles: an in vivo feasibility study. Invest Radiol. 2002;37(10):580–586.
5. Lodhia J, Mandarano G, Ferris NJ, Eu P, Cowell SF. Development and use of iron oxide nanoparticles (Part 1): Synthesis of iron oxide nano-particles for MRI. Biomed Imaging Interv J [Series on the Internet]. 2010;6(2):e12. http://dx.doi.org/10.2349/biij.6.2.e12. Accessed September 20, 2010.
6. Mandarano G, Lodhia J, Eu P, Ferris NJ, Davidson R, Cowell SF. Development and use of iron oxide nanoparticles (Part 2): The application of iron oxide contrast agents in MRI. Biomed Imaging Interv J [Series on the Internet]. 2010;6(2):e13. http://dx.doi. org/10.2349/biij.6.2.e13. Accessed September 20, 2010.
7. Nakakuma K, Uemura K, Kono T, Yanaka N, Yokoyama I. Studies on anticancer treatment with anticancer drug injected into the ligated hepatic artery for liver cancer (preliminary report). Nichidoku Iho. 1979; 24(4):675–682.
8. Alústiza JM, Artetxe J, Castiella A, et al. MR quantification of hepatic
iron concentration. Radiology. 2004;230(2):479–484.
9. Sun S, Zeng H, Robinson DB, et al. Monodisperse MFe2O4 (M = Fe,
Co, Mn) nanoparticles. J Am Chem Soc. 2004;126(1):273–279.
10. Echevarria JJ, Garcia-Alonso I, Diaz I, et al. Ultrasonographic characterization of an experimental model of liver metastases from
colon carcinoma in rats. Radiologia. 2010;52(1):37–44.
11. Echevarria JJ, Garcia-Alonso I, Larena JA, et al. Intraarterial administration of a magnetic fluid for therapeutic purposes: a distribution study in an experimental model of hepatic metastases using MRI and spectrometry. In: European Congress of Radiology 2010 [homepage on the Internet]. Vienna: European Society of Radiology; 2009. Available from: http://dx.doi.org/10.1594/ecr2010/C-2126. Accessed April 12, 2010.
12. Carlsson G, Gullberg B, Hafstrom L. Estimation of liver tumor volume
using different formulas – an experimental study in rats. J Cancer Res
Clin Oncol. 1983;105(1):20–23.
13. Rothe KF. Fractional extracellular space and fractional water content of various rat tissues at different extracellular pH values and in uremia.
Lab Anim. 1979;13(2):171–174.
14. Kiricuta IC, Simplaceanu V. Tissue water content and nuclear magnetic
resonance in normal and tumor tissues. Cancer Res. 1975;35(5):
1164–1167.
15. Gillams AR, Lees WR. Radiofrequency ablation of colorectal liver
metastases. Abdom Imaging. 2005;30(4):419–426.
16. Gillams AR, Lees WR. Five-year survival following radiofrequency ablation of small, solitary, hepatic colorectal metastases. J Vasc Interv Radiol. 2008;19(5):712–717.
17. Sakamoto I, Aso N, Nagaoki K, et al. Complications associated with
transcatheter arterial embolization for hepatic tumors. Radiographics.
1998;18(3):605–619.
18. Vogl TJ, Zangos S, Eichler K, Yakoub D, Nabil M. Colorectal liver metastases: regional chemotherapy via transarterial chemoembolization (TACE) and hepatic chemoperfusion: an update. Eur Radiol. 2007; 17(4):1025–1034.
19. Wust P, Gneveckow U, Johannsen M, et al. Magnetic nanoparticles for interstitial thermotherapy – feasibility, tolerance and achieved
temperatures. Int J Hyperthermia. 2006;22(8):673–685.
20. Moroz P, Metcalf C, Gray BN. Histologic analysis of liver tissue following hepatic arterial infusion of ferromagnetic particles in a rabbit
tumor model. Bio Metals. 2003;16(3):455–464.
21. Moroz P, Jones SK, Winter J, Gray BN. Targeting liver tumors with hyperthermia: ferromagnetic embolization in a rabbit liver tumor model.
J Surg Oncol. 2001;78(1):22–29.
22. Gonda T, Ishida H, Yoshinaga K, Sugihara K. Microvasculature of
small liver metastases in rats. J Surg Res. 2000;94(1):43–48.
23. Dabbagh AJ, Mannion T, Lynch SM, Frei B. The effect of iron overload on rat plasma and liver oxidant status in vivo. Biochem J. 1994;300(3): 799–803.
24. Bland JM, Altman DG. Statistical methods for assessing agreement
between two methods of clinical measurement. Lancet. 1986;1(8476):
307–310.
25. Gupta AK, Gupta M. Synthesis and surface engineering of iron oxide
nanoparticles for biomedical applications. Biomaterials. 2005;26(18):
3995–4021.
26. Perez JM, Josephson L, Weissleder R. Use of magnetic nanoparticles as
nanosensors to probe for molecular interactions. Chembiochem. 2004;
5(3):261–264.
Dovepress Evaluation of intra-arterial distribution of Fe3O4 nanoparticles into tumors
International Journal of Nanomedicine downloaded from https://www.dovepress.com/ by 118.70.13.36 on 23-Aug-2020
International Journal of Nanomedicine
Publish your work in this journal
Submit your manuscript here: http://www.dovepress.com/international-journal-of-nanomedicine-journal
The International Journal of Nanomedicine is an international, peer-reviewed journal focusing on the application of nanotechnology in diagnostics, therapeutics, and drug delivery systems throughout the biomedical field. This journal is indexed on PubMed Central, MedLine, CAS, SciSearch®, Current Contents®/Clinical Medicine,
Journal Citation Reports/Science Edition, EMBase, Scopus and the Elsevier Bibliographic databases. The manuscript management system is completely online and includes a very quick and fair peer-review system, which is all easy to use. Visit http://www.dovepress.com/ testimonials.php to read real quotes from published authors. 27. Kan Z, Wallace S. Sinusoidal embolization: impact of iodized oil on
hepatic microcirculation. J Vasc Interv Radiol. 1994;5(6):881–886.
28. Moroz P, Pardoe H, Jones SK, St Pierre TG, Song S, Gray BN. Arterial embolization hyperthermia: hepatic iron particle distribution and its
potential determination by magnetic resonance imaging. Phys Med
Biol. 2002;47(9):1591–1602.
29. Moros M, Pelaz B, López-Larrubia P, García-Martin ML, Grazúa V, De la Fuente JM. Engineering biofunctional magnetic nanoparticles for
biotechnological applications. Nanoscale. 2010;2(9):1746–1755.
Dovepress
Dove
press
Echevarria-Uraga et alInternational Journal of Nanomedicine downloaded from https://www.dovepress.com/ by 118.70.13.36 on 23-Aug-2020
![Figure 5 Scatter plot of the tumor volume of the infused rats against [Fe] in µg ⋅ g−1, determined using ICP-MS](https://thumb-us.123doks.com/thumbv2/123dok_us/8337075.1381239/8.612.144.449.327.690/figure-scatter-plot-tumor-volume-infused-determined-using.webp)