Intelligent patent analysis through the use of a neural network:
experiment of multi-viewpoint analysis with the MultiSOM model
Jean-Charles Lamirel LORIA
Campus scientifique, BP 239 54506 Vandoeuvre CEDEX
France
Shadi Al Shehabi LORIA
Campus scientifique, BP 239 54506 Vandoeuvre CEDEX
France
Martial Hoffmann INIST-CNRS 2, Allée du Parc de Brabois 54514 Vandoeuvre CEDEX
France
Claire François INIST-CNRS 2, Allée du Parc de Brabois 54514 Vandoeuvre CEDEX
France
Abstract
The main area of this paper concerns the neural methods for mapping scientific and technical information (articles, patents) and for assisting a user in carrying out the complex process of analysing large quantities of such information.
In the procedure of information analysis, like in the domain of patent analysis, the complexity of the studied topics and the accuracy of the question to be answered may often lead the analyst to partition his reasoning into viewpoints. Most of the classical information analysis tools can only manage an analysis of the studied domain in a global way. The information analysis tool that will be considered in our study is the MultiSOM tool whose core model represents a significant extension of the classical Kohonen SOM neural model. The MultiSOM neural-based tool introduces the concepts of viewpoints and dynamics into the information analysis with its multi-maps displays and its inter-map communication process. The dynamic information exchange between maps can be exploited by an analyst in order to perform cooperative deduction between several different analyzes that have been performed on the same data.
The paper demonstrates the efficiency of a viewpoint-oriented-analysis as compared to a global analysis in the domain of patents. Both objective and subjective quality criteria are taken into account for quality evaluation.
The experimental context of the paper is constituted by a patent database of 1000 patents related to oil engineering. The patents structure and
the patents field semantics are firstly exploited in order to generate different viewpoints corresponding to different areas of interest for the analysts. In the experiment the selected viewpoints correspond to uses, advantages, patentees, and titles subfields of the patents. The indexing vocabulary of each viewpoint is automatically extracted of its related textual contents in the patents through a full text analysis. The resulting vocabulary is then used to rebuild patents descriptions regarding each viewpoint. These descriptions are finally classified through the unsupervised MultiSOM algorithm resulting in as much different maps as viewpoints. A fifth “global viewpoint” which represent the combination of all the specific ones is also considered in order to perform our comparison between a global classification mechanism and a pure viewpoint-oriented classification mechanism.
1. Introduction
(W), which represents the strength of the links among nodes. Moreover, both their relationships with multivariate data analysis and their non-linear capabilities represent added-values for classing and mapping. The Kohonen self-organizing map (SOM) model is a specific kind of ANN which implements in only one step the tasks of classing and mapping a data set. In the SOM case, the learning is competitive and unsupervised and the approach gives central attention to spatial order in the classing of data. The purpose is to compress information by forming reduced representations of the most relevant features, without loss of information about their interrelationships. The main advantages of the SOM model are its robustness and its very good illustrative power. Conversely, the fact that original model he his only able to deal with one classification of the data at a time might be considered as a serious bottleneck for exploiting it for fine mining tasks.
In this article we shall be dealing with an innovation that was firstly introduced for the information retrieval purposes [13]. It has also been successfully tested for multimedia mining and browsing tasks, exploiting both the multi-map concept and the synergy between images and text on the same maps [14]. It is the multi-map extension of the Kohonen SOM algorithm. This will be from now signified by the name of MultiSOM. As we shall notice, the MultiSOM introduces the concepts of viewpoints and dynamics into the information analysis concept with its multi-map displays and its inter-map communication process. The dynamic information exchange between maps can be exploited by an analyst in order to perform cooperative deduction between several different analyzes that have been performed on the same data. The principal intent of this article is to propose the MultiSOM model as an ANN implementation of the information analysis concept.
We will mainly focuses on the study of the contribution of the viewpoint's oriented data analysis proposed by the MultiSOM model as compared to the global analysis proposed by the other models. An attempt will be made to define a protocol and to design a platform for this comparison. As soon as the MultiSOM model can be used either in a global way or in a
viewpoint-oriented way, it will be used as the reference model for our comparison. The section 2 of the article presents the Kohonen self-organizing maps (SOM) and their main applications in mapping of science and technology. Sections 3 deals with MultiSOM, the multi-map innovation of the SOM algorithm. The context of the experiment on the oil engineering patents and the preprocessing of these latter will be described in the section 4. The Section 5 describes the protocol of comparison which has been set up along with its results. The conclusions are finally exposed.
2. The self-organizing map (SOM)
tuning itself to that input, in addition the best matching node activates its topographical neighbors in the network to take part in tuning to the same input. More a node is distant from the winning node the learning is weaker. It is also called unsupervised learning because no information concerning the correct classes is provided to the network during its training. Like any unsupervised clustering method, the SOM can be used to find classes in the input data, and to identify an unknown data vector with one of the classes. Moreover, the SOM represents the results of its classing process in an ordered two-dimensional space (R2). A mapping from a high-dimensional data space Rn onto a two dimensional
lattice of nodes is thus defined. Such a mapping can effectively be used to visualize metric ordering relations of input data. As Kohonen [9] says: "The main applications of the SOM are in the visualization of complex data in a two dimensional display, and creation of abstractions like in many classing techniques."
The SOM algorithm is presented in details in ([2],[9],[12],[13],[19]). It consists of two basic procedures: (1) selecting a winning node and (2) updating weights of the winning node and its neighboring nodes. This preliminary learning phase is not straightforward process [9]. It necessitates several different learning steps, single map evaluations, and comparisons between a lot of generated maps in order to find at least a reliable map, at most an optimal one [13],[32].
Let x(t) = {x1(t), x2(t),…, xN(t)} be the input
vector selected at time t, and Wk(t) = {Wk1(t), Wk2(t),…, WkN(t)} the weights for node k at time t.
The smallest of the Euclidean distances ||x(t) –
Wk(t)|| can be made to define the winning node s:
||x(t) – Ws(t)|| = min ||x(t) – Wk(t)||
After the winning node s thus selected, the weights of s and the weights of the nodes in a defined neighborhood (for example all nodes within a square or a cycle around the winning node) are adjusted so that similar input patterns are more likely to select this node again. This is achieved through the following computation:
Wki(t+1) = Wki(t) + α(t) × h(t) × [Xi(t) – Wki (t)],
for 1 ≤ i ≤ N
where α(t) is a gain term (0 ≤ α(t) ≤ 1) that decreases in time and converges to 0, and h(t) is the neighborhood function.
Once the SOM algorithm is achieved, the data can be set to the nodes of the map. For each input data vector, the winning node is selected according to the algorithm first step presented above, and the data are affected to this selected node.
In the quantitative studies of science, the Kohonen self-organizing maps have been successfully used for mapping scientific journal networks [2], and also author co-citation data [33]. Maps have been also successfully used for several other applications in the general area of data analysis like for classifying meeting output [30], for classing socio-economic data [32] and for documentary database contents mapping and browsing [13],14]. Kaski et al. have implemented a specific adaptation of SOM, named WEBSOM, for the analysis of important document collections [6]. WEBSOM main characteristic is to include strategies for reducing the dimension of the entry data descriptions by using random projection techniques applied on word histograms extracted from the document contents. WEBSOM method has been tested for patents abstract analysis [7]. Nevertheless, as this method only manages such an analysis in a global way, it can only provide the analyst with general overview of the topics covered by the patents along with their interactions. A more exhaustive description of all the SOM applications might be found in [32].
section 4 presents a map resulting from these processes.
In all the following sections, we will consider that the classification process deals with electronic documents associated with their description in the form of index vectors. Classes will be represented by node vectors or class profile; each component of the vectors being the coordinate of a document index element (keyword). The list of the input data, which are the documents affected to the node, will represent the “class members” profile. The conceptual mean of the classes will be below called a topic. This semantic information is supplied by the classified keywords and documents.
3. The MultiSOM model
The communication between self-organizing maps that has been first introduced in the context of an information retrieval model [10], represents a major amelioration of the basic Kohonen SOM model. From a practical point of view, the multi-map display introduces in the information analysis the use of viewpoints. Each different viewpoint is achieved in the form of map. Each map is a spatial order in which the information is represented into nodes (classes) and spatial areas (group of classes). The multi-map enables a user to highlight semantic relationships between different topics belonging to different viewpoints. Each map represents a particular viewpoint. Figure 4 of section 4 illustrates it.
3.1 The viewpoint paradigm
The viewpoint building principle consists in separating the description space of the documents into different subspaces corresponding to different keyword subsets. The set of V all possible viewpoints issued from the description space D of a document set can be defined as:
V = {v1, v2, …, vn}, vi∈ P(D), with v D
n 1 i
i=
=
U
where each vi represents a viewpoint and P(D)
represents the set of the parts of the description space of the documents D; the union of the different viewpoints constitutes the description space of the documents.
The viewpoint subsets issued from V may be overlapping ones. Moreover, they may also fit into the structure of the document when they correspond to different vocabulary subsets associated to different documents subfields, if any. Other viewpoints may be also manually extracted from an overall document description space. At last, the viewpoint model is flexible enough to tolerate document descriptions belonging to different media, as soon as these descriptions can be implemented by description vectors (for ex. an image can be simultaneously described both by a keyword vector and by color histogram vector).
The inter-map communication mechanism, which is described hereafter, takes directly benefit of the above described viewpoint model in order to overcome the low quality problem inherent to a global classification approach while conserving a overall view on the interaction between the data.
3.2 Inter-map communication mechanism
In MultiSOM, this inter-map communication is based on the use of the data that have been projected onto the maps as intermediary nodes or activity transmitters between maps. The intercommunication process between maps operates in three successive steps. Figure 1 shows graphically the three steps of this intercommunication mechanism.
To perform in the best conditions, the inter-map communication process obviously necessitates that a significant part of the data should play that roles between the maps. This last condition could be
easily verified if each vector used for the map generation indexes a significant part of the bibliographic database.
Source signal: direct user activation or query matching activation
Source Map
[1]
[2] [3]
Source signal: direct user activation or query matching activation
Source Map
[1]
[image:5.595.175.426.193.341.2][2] [3]
Figure 1: Inter-map communication mechanism. This figure represents the main steps of the inter-map communication mechanism. [1] The activity is set up directly by the user or by a query formulation on one or several nodes of one or several source map. [2] The activity is transmitted to the data nodes associated to the activated class nodes of the source map. [3] The activity is transmitted through the data nodes to other maps to which these data are associated. Positive as well as negative activity could be managed in the same process. Note that the data are in this case indexed document.
4. Application
In the two preceding sections we have introduced MultiSOM after having previously presented the SOM algorithm. In this section, we shall then use a real example, to make some of the notions more concrete. We argue that visualization into form of a set of maps represents an important added-value for analysis in the technology watching tasks, as well as in science watch, and in knowledge discovery in databases. Our example is a set of 1000 patents about oil engineering technology recorded during the year 1999.
4.1 The analysis phase
The role of the MultiSOM application has been firstly planed by the domain expert in order to get answers to such various kinds of questions on the patents that:
1: “Which are the relationships between the patentees?”
2: “Which are the advantages of the different oils?”,
3: “Does a patentee works on a specific engineering technology, for which advantage and for which use?”,
4: “Which is the technology that is used by a given patentee without being used by another one?”,
5: “Which are the main advantages of a specific oil component and do this advantages have been mentioned in all the patents using this component?”.
been highlighted by the expert from the set of possible questions are:
1: Patentees,
2: Title (often contains information on the specific components used in the patent),
3: Use,
4: Advantages.
A fifth “global viewpoint” which represent the combination of all the specific ones is also considered in order to perform our comparison between a global classification mechanism, of the WEBSOM type, and a pure viewpoint-oriented classification mechanism, of the MultiSOM type.
4.2 The technical realization
The role of this phase consists in mapping the four specific viewpoints highlighted by the domain expert in the preceding phase in four different maps. A preliminary task consists in obtaining the index set (i.e. the vocabulary set) associated to each viewpoint from the full text of the patents. This task has been itself divided into three elementary steps. At the step 1, the structure of the patent abstracts is parsed in order to extract the subfields corresponding to the Use and to the Advantages
viewpoints1. At the step 2, the rough index set of
each subfield is constructed by the use of a basic computer-based indexing tool [4]. This tool extracts terms and noun phrases from the subfield content according to a normalized terminology and its syntactical variations. It eliminates as well usual language templates. At the step 3, the normalization of the rough index set associated to each viewpoint is performed by the domain expert in order to obtain the final index sets. The normalization of the
Title, Use and Advantages subfields consists in choosing a single representative among the terms or noun phrases which represent the same concept (for ex., “oil fabrication” and “oil engineering” noun phrases will be both assimilated to the single “oil engineering” noun phrase). The normalization of the
Patentees viewpoint is operated in the same way
considering that the same firm can appear with different names in the set of published patents.
1
The Patentees and Title subfields are directly represented in the original
patent structure and therefore do not necessitate any extraction.
After the construction of the final index sets, the patents are re-indexed separately for each viewpoint thanks to these sets. Figure 2 presents a patent abstract including its generated multi-index.
The following task consists in building the maps representing the different viewpoints, using the map algorithm described in section 2. Before these step, a classical IDF-Normalization step [27] is applied to the index vectors associated to the patents in order to reduce the influence of the most widespread terms of the indexes. For each specific viewpoint a map of 10x10 nodes (classes) is finally generated. Two global maps representing global unsupervised classifications, of the WEBSOM type [7], of the patents are also constructed. The index sets of these maps represent the union of the index sets of all the specific viewpoints. They only differ one to another by the number of their classes. The first one (GlobMin) is constrained to have the same number of classes as the viewpoint maps (i.e. 100 classes). The second one (GlobMax) is constrained to have to sum of the number of classes of all the viewpoint maps (i.e. it becomes a 20x20 map comprising 400 classes). The table 1 summarizes the results of the patent indexation and the map building. A single viewpoint map resulting from the map building process is presented at the figure 4. Some remarks must be made concerning the results shown in table 1. (1) The index count of the Title
general index: “Divers”. (3) On the Patentees map, the number of classes is close to the final number of retained patentees. Most of these patentees will then be associated to separate classes on the Patentees
map. (4) Only 62% of the patents have an
Advantages field and 75% a Use field.
Consequently, some of the patents will not be
[image:7.595.119.477.212.428.2]indexed for the all the expected viewpoints. The role of the mechanism of communication between viewpoints (see next section) will then be to generate indirect evaluation of the contents of these patents on their missing viewpoints through their associations with other patents.
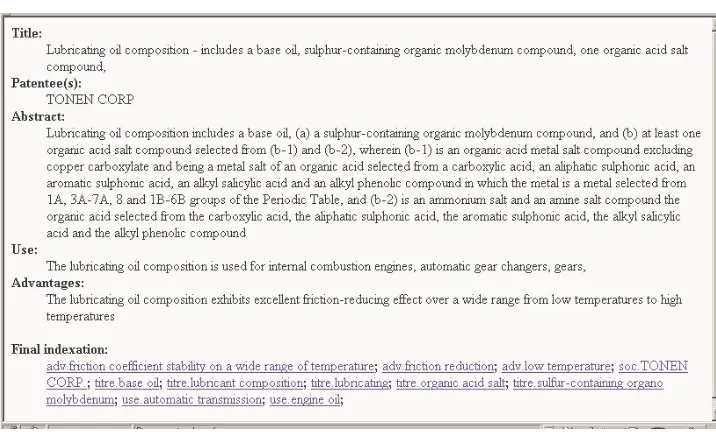
Figure 2: Example of a patent abstract with its generated multi-index. The multi-index that has been generated for the above patent abstract corresponds to the “Final indexation” field. The terms of the generated multi-index are prefixed by the name of the viewpoint to which they are associated: “adv.” for the Advantages viewpoint, “titre.” for the Title viewpoint, “use.” for the Use viewpoint, “soc.” for the Patentees viewpoint.
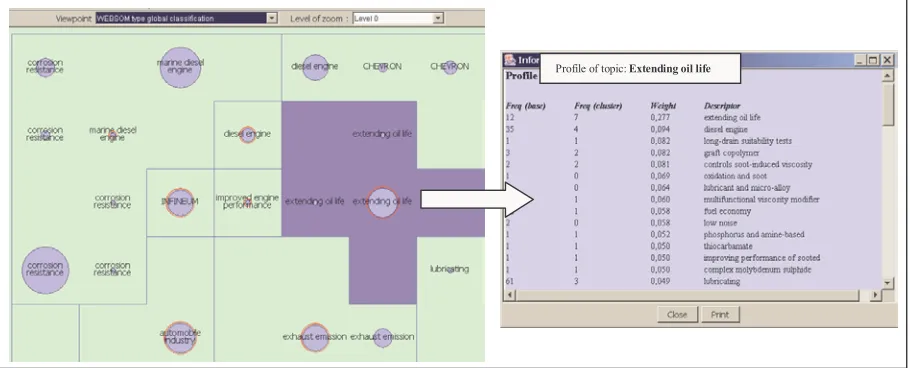
[image:7.595.161.437.506.695.2]learning. After the learning, the nodes related to the same topics have been grouped into coherent areas thanks to the topographic properties of the map. The number of nodes of each area can then be considered as a good indicator of the topic weight in the database. Topics or areas near one to another represent related notions. For example, the “extending oil live” area shares some of its borders with the “black sludge control” area on the map. The proximity of these two areas illustrates the fact that oil duration strongly depends of maintaining a low level of sludge in it. The surrounding circles represent the centers of gravity of the areas.
Patentees Title Use Advantages GlobMin
(WEBSOM) (WEBSOM) GlobMax
Number of indexed documents
(NID) 1000 1000 745 624 1000 1000
Number of rough indexes generated
(NRI) 73 605 252 231 1395 1395
Number of final indexes
(NFI) 32 589 234 207 1075 1075
Numbers of map classes with members
[image:8.595.86.511.199.328.2](/100) 28 55 57 61 89 238
Table 1: Summary of the results of patent indexation and map building. Note that the NRI (resp. NFI) of the “global viewpoint” are less than the sum of the NRIs (resp. NFIs) of all the specific viewpoints (i.e. 1089) because there are similar indexes occurring in different viewpoints.
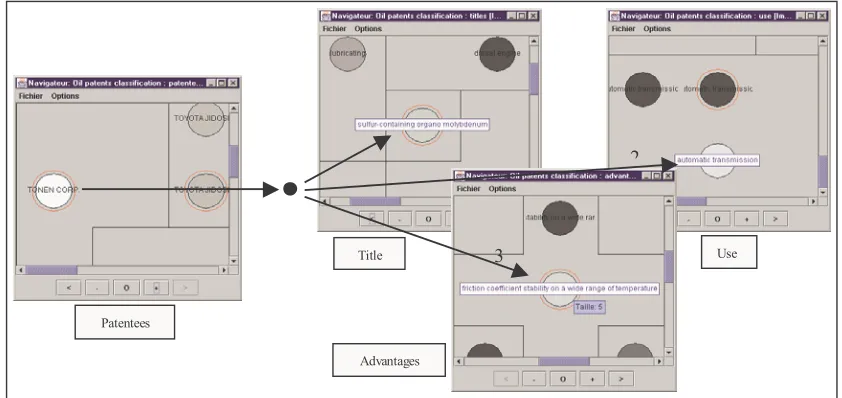
Figure 4: Example of exploitation of the inter-map communication mechanism. The analyst decision to activate the area corresponding to the TONEN CORP. company on the Patentees map and to propagate the activity to the thematic maps associated to the Use, Advantages and Title viewpoints corresponds to a "viewpoints crossing query" whose explicit formulation might look like: "I want to know which are the specific areas of competence (concerning oil use, oil composition and expected advantages) of the TONEN CORP. company, if there are. The MultiSOM application let him interactively find that TONEN CORP. company is a specialist of the lubrication of the automatic transmissions [arrow n°2 on the map] and that it adopted for this kind of lubrication sulfur-containing organo-molybdenum compound [arrow n°1] whose main advantages are to provide oil with a friction coefficient that is stable on a wide range of temperature [arrow n°3]. In this case, an inverted propagation from the target topics should be also used to verify that these topics only belong to TONEN CORP. areas of competence. The whiter is the color of a node representing a map class (topic), the higher is its resulting activity.
1 2
3
Patentees
Title
Advantages
[image:8.595.87.508.387.586.2]4.3 Inter-map communication for analysis
In comparison with the standard mapping methods, as such as principal component analysis, multidimensional scaling or WEBSOM global SOM analysis, the advantage of the multi-map displays is the inter-map communication mechanism that MultiSOM environment provides to user. Each map is representing a viewpoint. Each viewpoint is representing a subject category. The inter-map communication mechanism assisted the user to cross information between the different viewpoints. In both cases, the responses of the system are given both through activity profiles on the maps and through patents examples associated to the most active class representatives of these maps. The estimation of the quality of thematic deduction is achieved through an evaluation of the activity focalization on the target maps (see [13]). The figure 4 illustrates a thematic deduction between the four different viewpoints of the study.
5. Evaluation
The advantages of the MultiSOM method seem obvious to the expert of the domain: the original multiple viewpoints classification approach of MultiSOM tends to reduce the noise which is
inevitably generated in an overall classification approach while increasing the flexibility and the granularity of the analyses. Moreover, with a global classification method, like WEBSOM, important relationships between some subtopics are hidden in the class profiles and therefore very difficult to precisely characterize. The expert found more than 35 of such important relationships by the use of the MultiSOM method. A simple example is given by the comparison of the figure 3 and the figure 5. Other examples of more elaborated topic relationships that can be only obtained by the MultiSOM inter-map communication mechanism are given in the annex of the paper. Finally, the expert argued that the possibility of interactively activating, positively or negatively, the classes on the maps represents a great help for tuning very precisely an analysis process. Nevertheless, expert empirical evaluation remains insufficient to objectively compare global approach to viewpoint-oriented approach. For this last purpose, we propose new objective classification quality estimators for both evaluating and optimising the results of the classification and of the mapping methods, especially when they are applied in the domain of documentary databases. These estimators are described in the next section.
[image:9.595.73.528.498.682.2]
Figure 5: Results of a WEBSOM-like global mapping of 10x10 nodes (GlobMin). The left part of the figure represents the WEBSOM-like mapping (i.e. without viewpoint management) of the content of the patent abstracts. The right part of the map represents the description (i.e. profile) of the “extending oil life” WEBSOM global topic. Even if a strong relationship between “extending oil life” and “black sludge control” topics has been highlighted by
the MultiSOM viewpoint-oriented classification (see map of figure 3), this relationship has been lost by the WEBSOM-like classification due to the noise of the global classification (this relationship do not appear, neither in the above map, nor in the “extending oil life” topic profile).
5.1 Evaluation procedure
When anyone aims at comparing classification methods, he will be faced with the problem of choice of reliable classification quality measures. The classical evaluation measures for the quality of a classification are based on the intra-class inertia and the inter-class inertia [16][17][25]. Thanks to these two measures, a classification is considered as good if it possesses low intra-class inertia as compared to its inter-class inertia. However, in the case of a Kohonen classification, as well as for many other numerical classification methods, these measures are often strongly biased, mainly because the intrinsic dimensions of the classes profiles (number of non-zero components in the profiles) are not of the same order of magnitude than the intrinsic dimensions of the data profiles2. It is
especially true in the documentary domain where the number of indexes in the documents is extremely low as compared to the dimension of their overall description space.
A promising way we have found in order to more precisely highlight the main characteristics of the classes of the map and to validate the thematic deductions between the maps consists in coupling the MultiSOM model with a symbolic model using Galois lattice conceptual classification of the patents regarding the same viewpoints as the one used for the map building. This approach is extensively described in [31]. A Galois lattice model could also be considered as a pure natural elementary classifier. Indeed, it groups the data by directly considering their intrinsic properties (i.e. without any preliminary construction of class profiles). Hence, one might derive from its behavior news class quality evaluation factors which can be substituted to the measures of inertia for validating the intrinsic properties of the numerical classes. For the sake of user-orientation, our measures will be based in a parallel way on the recall and precision criteria which are extensively used from evaluating
2
In the SOM method, a second bias is generated by the class construction process that tends to maintain the topographic properties of the map by enhancing the similarities between neighboring classes.
the result quality of information retrieval (IR) systems. In IR [29], the Recall R represents the ratio between the number of relevant documents which have been returned by an IR system for a given query and the total number of relevant documents which should have been found in the documentary database. The PrecisionPrepresents the ratio between the number of relevant documents which have been returned by an IR system for a given query and the total number of documents returned for the said query. Recall and Precision
generally behave in an antagonist way: as Recall
increases, Precision decreases, and conversely. The
F function has thus been proposed in order to highlight the best compromise between these two values [35]. It is given by:
(
)
P R P R F +=2 * (Eq. 1)
Based on the same principles, the Recall and
Precision measures which we introduce hereafter
evaluate the quality of a classification method by measuring the relevance of its resulting class content3 in terms of shared properties. In our further
descriptions, the class content is supposed to be represented by documents and the indexes (i.e. the properties) of the documents are supposed to be weighted by values within the range
[ ]
0,1.Let us consider a set of classes C resulting from a classification method applied on a set of documents
D, the Recall measure is expressed as:
∑
∑
∈ ∈ = c S p p p Cc c C
c S C R * * 1 1 ,
∑
∑
∈ ∈ = c S p p Cc c c
c S C P * 1 1
where Sc is the set of properties which are
peculiar to the class c that is described as:
( )
= ∈ ∈ = ∈C c p p cc p d d c W MaxW
S c
' ' ,
where Crepresents the peculiar set of classes
3
extracted from the classes of C,which verifies:
{
∈ ≠∅}
= c C Sc
C
and:
∑∑
∑
∈ ∈
∈
=
C c d c
p d c d
p d p
c
W W W
' '
where p x
W represents the weight of the property
p for element x.
Similarly to IR, the F-measure (described by Eq. 1) could be used to combine Recall and
Precision results. Moreover, we have demonstrated
in [16] that if both values of Recall and Precision
reach the unity value, the peculiar set of class
Crepresents a Galois lattice. Therefore, the combination of this two measures enables to evaluate to what extent a numerical classification model can be assimilated to a Galois lattice natural classifier. The stability of our Quality criteria has also been demonstrated in [16].
5.2 Evaluation results
Patentees Title Use Advantages Average F (MSOM)
GlobMin
(WEBSOM)
GlobMax
(WEBSOM)
R 0,94 0,89 0,78 0,77 0,87 0,84
P 0,92 0,40 0,63 0,60 0,48 0,65
[image:11.595.108.487.313.395.2]F 0,93 0,55 0,70 0,67 0,71 0,61 0,68
Table 2: Summary of the results of Quality, Recall and Precision evaluation: The nearer the different values are from 1, the better are the classification results. The F value provides a synthesis of the results of R and P.
The examination of the Quality measures of the table 2 gives more reliable and stable results because these measures are both independent of the classification method and of the size of the description space. It highlights the overall superiority of the viewpoint-oriented approach as compared with a global approach with the same number of class (GlobMin). As the number of classes is strongly increased in the global approach (GlobMax), its quality is simultaneously increased, but the advantage of the viewpoint-oriented approach remains obvious in the average (higher Average F-value on all viewpoints than F-value of
GlobMax), with a more reasonable number of
classes per maps from a user point of view. The specific case of the Title classification should be discussed here. The bad quality of this classification is both due to the index sparseness of this field4 and
to an inappropriate number of classes, relatively to
4
This can be “a posteriori” confirmed by the inertia results for this viewpoint.
the size of its associated description space. An interesting strategy would then be to make use of the quality factor Q in order to find the optimal number of classes for this classification. An unbalance between Recall and Precision (in the favour of Recall) can be observed in the case of the worse classifications (GlobMin and Titles). Such an unbalance means that documents with different properties sets are grouped in the same classes, leading conjointly to the risk of confusion in the interpretation of the content of the classes by the user.
The quality analysis clearly shows that the viewpoint-oriented approach enhance the quality of interpretation of a classification by both reducing the number of class to be consulted by the user on each viewpoint and providing him with more coherent and exhaustive classes in terms of content.
5.3 Optimisation of classification results
the latter section can also be used for optimizing the number of classes for each viewpoint map. The goal of this process is to provide the analyst with an optimal quality of interpretation for each individual map associated to a specific viewpoint. For that purpose, different maps are generated from 6x6 to 24*24 nodes (classes) for each viewpoint. The principle of our algorithm of classification optimisation, which is described in [16], is to search for a break-even point (i.e. intersection point)
between Recall and Precision. The map whose quality criteria stand the nearest from the break-even point is considered as the optimal one. The figure subjectively illustrates the difference of accuracy that can be obtained in the analysis by optimizing the map size for a given viewpoint. As it is shown in the figure 6, high quality maps are usually characterized by more precise topic labels and smaller average size of their logical areas.
[image:12.595.76.523.251.469.2]
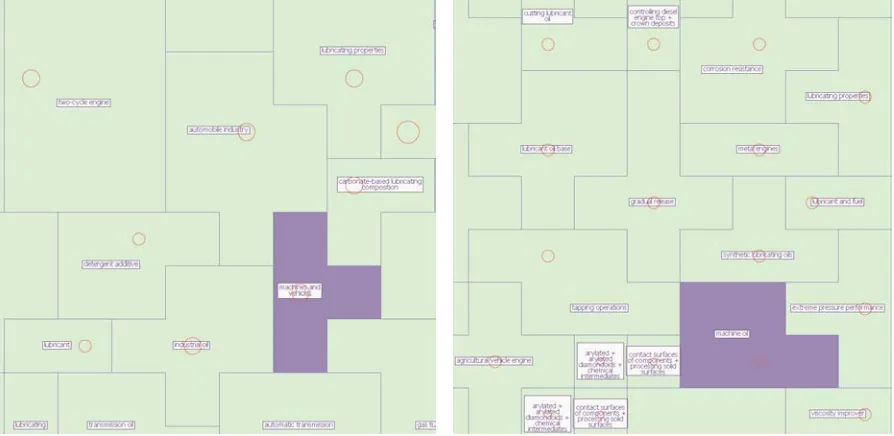
Figure 6: Comparison between a 11x11 “Use viewpoint” thematic map and a 16x16 “Use viewpoint” thematic map through map extracts: the 11x11 map extract is presented at the left, the 16x16 map extract is presented at the right. On the figure, the focus is given “machine oil” topic. The comparison highlights, as an example, that the logical surrounding of this topic is more precisely defined in the 16x16 map (optimal quality) than in the 11x11 map (lower quality). Moreover, in the 11x11 map, the topic “machine oil” has been derived in a more fuzzy scope topic named “machine and vehicles”.
6. Conclusion
We have presented a new self-organizing multi-map system. We proposed it as a visualization-based system for scientific and technical information analysis, like patents analysis. The model that this multi-map environment provides is certainly not the map but in its original extended version of intercommunication between multiples maps. Each map representing a particular viewpoint extracted from the data. These viewpoints are related either by the problem to be solved, or by the intercommunication mechanism between the maps. We have exposed both the map generation and their
intercommunication mechanism. We finally showed how one can evaluate such a viewpoint-oriented approach by comparing it to a global classification approach.
relationships between some subtopics are hidden in the class profiles and therefore very difficult to precisely characterize.
Our experiment has also highlighted that our quality evaluation factors that we have proposed can be benefitely used for optimizing the classifications in terms of number of classes, either these classifications are global or they are viewpoint-oriented. This optimization seems to be mandatory when one want to classify documents issued from the Web, where sparseness could usually be a blocking factor.
7. References
[1] IST-1999-20350.
[2] J. M. Campanario, «Using Neural Networks To Study Networks of Scientific Journals,»
Scientometrics, 33 (1995) No. 1, p. 23-40.
[3] J-F. Jodouin, Les réseaux neuromimétiques, HERMES, Paris, 1994.
[4] O. Jouve, «Les nouvelles technologie de la
recherche d’information», Séminaire
Documentation, Paris, Otobre, 1999
[5] G. E. Hinton, «Connectionist Learning Procedures,» Artificial Intelligence, 40 (1989) p. 185-234.
[6] S. Kaski, T. Honkela, K. Lagus and T. Kohonen, «WEBSOM-self organizing maps of document collections », Neurocomputing, vol. 21, pp. 101-117, 1998.
[7] T. Kohonen, S. Kaski, K. Lagus, J. Salojrvi, J. Honkela, V. Paatero and A. Saarela, Self organization of a massive document collection", IEEE Transactions on Neural Networks, 2000. [8] T. Kohonen, Self-Organisation and Associative Memory, Springer Verlag, Third edition, Berlin, 1984.
[9] T. Kohonen «The Self-Organizing Map,»
Proceedings of the IEEE, 78 (1990) No 9, p. 1464-1480.
[10] T. Kohonen, «Self-Organizing Maps: Optimization Approaches,» in Artificial Neural Networks, T. Kohonen, K. Mäkisara, O. Simula, J. Kanges, Editors, Elsevier Science Publishers B.V, North Holland, Amsterdam, 1991, p. 981–990. [11] T. Kohonen, «Things You Haven't Heard about the Self-Organizing Map,» IEEE International Conference on Neural Networks, San
Francisco, Calif., March 28 – April 1, (1993) p. 1147-1156.
[12] T. Kohonen, Self-Organizing Maps. Springer Verlag, Berlin, 1997.
[13] J-C. Lamirel, Application d’une approche symbolico-connexionniste pour la conception d’un système documentaire hautement interactif, Thèse de l’Université de Nancy 1 Henri Poincaré, 1995. [14] J-C. Lamirel, J. Ducloy, G. Oster, «Adaptative browsing for information discovery in an iconographic context,» In Conference Proceedings RIAO, Paris, Volume 2, 2000, p. 1657-1672. [15] J.C. Lamirel, Y. Toussaint, « Combining Symbolic and Numeric Techniques for Digital Libraries Contents Classification and Analysis ».
Proceedings of First DELOS Network of Excellence Worshop, Zurich, December 2000. [16] J.C. Lamirel, S. Al Shehabi, C. Francois, M. Hoffmann, « New classification quality estimators for analysis of documentary information: application to web mapping ». Proceedings of ISSI, Bejing, 2003 (to be published).
[17] L. Lebart, A. Morineau and J. P. Fénelon, «
Traitement des données statistiques », Dunod, Paris, France, 1982.
[18] A. Lelu et A. Georgel, « Neural Models for Orthogonal and Oblique Factor Analysis: Towards Dynamic Data Analysis of Large Sets of Highly Multidimensional Objects », Proceedings of IJCNN, pp. 829–832, Paris, France, 1990.
[19] X. Lin, D. Soergel, G. Marchionini, «A Self-Organizing Semantic Map for Information Retrieval,» in Proceedings of the 4th International SIGIR Conference on R&D in Information Retrieval, 13-16 October, Chicago, 1991, p. 262-269.
[20] X. Lin., « Map Displays for Information Retrieval, »JASIS, 48 (1) : 40-54, 1997.
[21] R. P Lippmann., «An Introduction to Computing with Neural Nets,» IEEE ASSP
Magazine, April, p. 4-22 (1987) p. 4-22.
[22] R. E. Orwig, H. Chen and J. F. Nunamaker Jr., « A graphical, Self Organizing Approach to Classifying Electronic Meeting Output, » JASIS, 48 (1) : 157-170, 1997.
informatiques», Centre Elie Cartan, Université de Nancy I, France, 1997.
[24] X. Polanco, J.C. Lamirel and C. Francois, «Using Artificial Neural Networks for Mapping of Science and technology: A Multi self-organizing maps Approach », Scientometrics, Vol. 51, N° 1 (2001), pp. 267-292.
[25] X. Polanco, C. François, «Data Classing and Class Mapping or Visualization in Text Processing and Mining,» Dynamism and Stability in Knowledge Organization. Proceedings of the Sixth international ISKO Conference, 10-13 July 2000, Toronto, Canada. Edited by C. Beghtol, C. L. Howarth, N. J. Williamson. Advances in Knowledge Organization, 7 (2000a), p. 359-365. [26] C. Rham (De), «La classing hiérarchique ascendante selon la méthode des voisins réciproques,»Les cahiers de l’analyse de données, 5 (1980) No. 2, p. 135-144.
[27] S. E. Robertson and K. Sparck Jones,
«Relevance Weighting of Search Terms», Journal of the American Society for Information Science, 27:129–146, 1976.
[28] H. Ritter, T. Kohonen, «Self-Organizing Semantic Maps,» Biological Cybernetics, 61 (1989) p. 241-254.
[29] G. Salton, The SMART Retrieval System: Experiments in Automatic Document Processing,
Prentice Hall Inc., Englewood Cliffs, New Jersey, 1971.
[30] SOM papers,http://www.cis.hut.fi/nnrc/refs/
[31] Y. Toussaint, J.C. Lamirel, M. d’Aquin, « Combining Symbolic and Numeric Techniques for Database Content Analysis, » Proceedings of IEA01, Budapest, Hungary, 2001.
[32] Varsis and C. Versino « Clustering of Socio-Economic Data with Kohonen Maps, » In
Proceedings of third International Workshop on Parallel Applications in Statistics and Economics, Pragues, Czechoslovakia, december 1992.
[33] H. D. White, X. Lin, K.W. McCain, «Two Modes of Automated Domain Analysis: Multidimensional Scaling vs Kohonen Feature Mapping of Information Science Authors,» in
Structures and Relations in Knowledge Organization. Proceeding of the Fifth International ISKO Conference, Lille, 25-29 August 2000. Edited by W. Mustafa el Hadi, J. Maniez, S.. A. Politt. Advances in Knowledge Organization, 6 (1998) p. 57-63.
[34] P. H. Winston, Artificial Intelligence. Addison-Wesley Publishing Company, Reading, Mass., 1977.
ANNEX: EXAMPLE OF DYNAMIC ANALYSIS
Dynamic analysis takes place mainly by using the inter-map communication mechanism which makes it possible to bring to successful conclusion sets of topics deductions between different viewpoints chosen like investigation subfields. This analysis is based on the generation of an initial activity corresponding to the premises of the deductions to check. According to the stage of analysis, this activity can itself be generated several manners by the analyst on one or more source maps. If the activity generation is directly operated by analyst on a map, it corresponds then to a broad set of topics questions. If the activity generation is operated indirectly by projection of a query on a map or by activation of documents group stored beforehand in a document collector, it corresponds then to more targeted questions, which can intervene in one advanced stage of the analysis.
The analyst interest is to highlight the specific areas of competence of the Exxon company. On the simulation of analysis we develop on figure 7, we will consider two different viewpoints, the
Patentees viewpoint which will represent the source of the analysis and the Title viewpoint which will represent its destination.
The analyst starts the process of deduction by generating an initial activity on the main Exxon
topic (i.e. Exxon area gravity center) of the
Patentees viewpoint map. To obtain a broad set of potential deductions, he selects the Possibilistic
mode of deduction [14]. The activity generated by the inter-map communication mechanism on the
Title viewpoint map is focused in two different zones of this map, corresponding to two potential results.
In the first active zone (1), the analyst makes use of two different naming strategies to facilitate its interpretation, namely, a naming strategy based on the profile of the topics (more generic) and a naming strategy based on the profile of the best members (i.e. patents) of the topics (more specific). These operations enable him to highlight that the Exxon company is specialized in a
correlative way on topics: “marine diesel engine”, “surfactant system” and “basic calcium compound”. The expert checks the correlation between these topics by consulting the patents associated to the topic “surfactant system” (2). The title of the patents already confirm him the problematic detected by the application. A thorough examination of the contents of the documents will show him than the purpose of use of surfactant containing calcium in addition with the normal formula of oils is to protect the combustion chambers of the marine diesel engines against corrosion due to the absorption of air charged out of salt during their operation. The problem of protection of the marine engines against corrosion is sufficiently important to represent a field of investigation for an oil manufacturer like Exxon.
The construction of a query containing the single descriptor “surfactant system” (3) on the Title
viewpoint will allow the analyst:
1. To validate the correlation between
“surfactant system” and “marine diesel engine” topics which will be interpreted by the fact that “surfactant system” is only associated with “marine diesel engine”.
2. To check the inverse deduction “surfactant systemÆ Exxon” which will insure him that Exxon is the only company whose interest in the conception of “surfactant system”.
The result of the projection of the query on the
Title viewpoint map (4) shows that the generated activity is peculiar to the logical topic area “marine diesel engine”, which confirms the first assumption. Simultaneously with projection, the documents that are relevant for the query are presented in a Collector (5). The global activation of these documents allows analyst to initiate a new deduction. Then, the result of this latter can be examined on the Patentees map. Like only the main Exxon topic has been activated (6), the second assumption of the analyst is confirmed.
to observe that the second major field of activity of
Exxon is the “biodegradable” oils. He will be able to also note that these oils are more specifically used for the lubrication of the two-stroke engines (“two cycle engine”) that reject generally much unburned oil. Probabilistic mode of deduction will allow him to check if the inverse deduction, namely, that Exxon is the only company to be worked on biodegradable oils, can be validated (8). This process will lead the analyst
to conclude that “biodegradable” oil
manufacturing is shared between Exxon and
Mobil companies (9), which are the most important oil manufacturers.
A complementary use of negative activity setting on the “two cycle engine” topic (10) will show more precisely to the analyst that that Mobil
company mainly focuses on manufacturing of biodegradable oils for “two stroke engines” and, in a complementary way, that Mobil company only focuses on manufacturing of biodegradable oils for “four stroke engines” (11).
The simulation of analysis presented here above shows clearly how the analyst can make use of the MultiSOM functionalities in order to highlight all the privileged activity fields of the Exxon
Activated area
Inverse validation
Activity resulting from the inverse validation Analysis of
deduction
Focali-zation
Inverse validation
Activity resulting from the inverse validation
Projection resulting from the inverse validation
Legend :
Viewpoint “Patentees” Viewpoint “Title”
1
2
3
7
6
Figure 7: Diagram of the analysis simulation4
5
8
9
=
Result = 28,6% and 23%
Result= 100%
Activated area
Categorical choice
Result = 28,6% and 17% Categorical
rejection
[image:17.595.64.520.116.734.2]