Update Summarization Using a Multi-level Hierarchical
Dirichlet Process Model
Jiwei Li
1Sujian Li
1Xun Wang
1Ye Tian
1Baobao Chang
1(1) Key Laboratory of Computational Linguistics, Peking University, Ministry of Education, CHINA {bdlijiwei, lisujian, xunwang, ytian, chbb}@pku.edu.cn
ABSTRACT
Update summarization is a new challenge which combines salience ranking with novelty detection. Previous researches usually convert novelty detection to the problem of redundancy removal or salience re-ranking, and seldom explore the birth, splitting, merging and death of aspects for a given topic. In this paper, we borrow the idea of evolutionary clustering and propose a three-level HDP model named h-uHDP, which reveals the diversity and commonality between aspects discovered from two different epochs (i.e. epoch history and epoch update). Specifically, we strengthen modeling the sentence level in the h-uHDP model to adapt to the sentence extraction based framework. Automatic and manual evaluations on TAC data demonstrate the effectiveness of our update summarization algorithm, especially from the novelty criterion.
1 Introduction
Update summarization aims to generate a short and concise summary for the latest updating topic-related documents (hereafter update documents for short), under the assumption that the user has already read the earlier historical documents (history documents for short) about the same topic. Recently, there have been many attempts to explore different approaches to generate update summaries. The predominant approaches are mainly built upon the sentence extraction framework.
Update summarization for an evolving topic differs from previous generic summarization for a static topic in that the latter aims to acquire the salient information in one topic, while the former cares for both the salience and the novelty of information. By developing traditional summarization techniques, massive efforts on update summarization have been made to dig out new information (Boudin et al., 2008; Fisher and Boark, 2008; Wan, 2007; Li et al., 2008; Du et al., 2010; Li et al., 2012). The typical examples include the scaled Maximal Marginal Relevance (MMR) algorithm which excludes those sentences similar to the history documents, and some extensions of TextRank such as TimedTextRank (Wan, 2007), PNR2 (Li et al., 2008), MRSP (Du et al., 2010) which re-rank the salience scores of sentences by employing various kinds of reinforcement between sentences. One problem with these approaches is that they tend to regard update summarization more as a redundancy removal problem than a novelty detection problem. Another problem is that these approaches are mainly based on the computation of lexical similarities between sentences and fail to consider higher level information to avoid semantic redundancy in update summarization.
To solve these two problems, we borrow the techniques of evolutionary clustering which focuses on detecting the dynamics of a given topic. Normally, one topic is described from various specific aspects1, accompanied with the background information running the whole topic (Chemudugunta et al., 2007; Li et al., 2010). For example, the topic “Quebec independence” may involve the specific aspects including “leader in independence movement”, “referendum”, “related efforts in independence movement” and so on, while “Quebec” and “independence” are seen as the general background information. The evolving dynamics of a topic is mainly embodied in the birth, splitting, merging and death of the specific aspects (Ren et al., 2008). Then, the commonality and diversity between history documents and update documents can be easily summarized from the aspect level and update summarization is not limited to lexical redundancy removal. Recently, hierarchical Dirichlet process (HDP) (Teh et al., 2006) has been widely used to model the aspects in evolutionary clustering. HDP does not need to predefine the number of clusters, and can be easily and naturally extended to multiple correlated corpora for detecting aspects (Ren et al., 2008; Xu et al., 2008; Zhang et al., 2010; Gao et al., 2011). These distinct advantages make it suitable to update summarization. However, to our best knowledge, no previous work has explored HDP for update summarization.
Aiming at the task of update summarization, in this paper, we develop a novel three-level (i.e. corpus, document set, and document levels) HDP model, called h-uHDP model, which extends the standard HDP to the scenario of two related document sets in different epochs (namely history epoch and update epoch). In h-uHDP, the diversity and connections of aspects between two epochs are naturally modeled: two epochs may share some common aspects; further, some aspects may become outdated while some become popular or some new may appear over time, causing the number of aspects and aspect structures to change at different epochs.
Under the framework of extractive summarization, it is important to acquire the relationship between sentences and aspects for sentence selection. However, in most existing HDP models, the sentence level is disregarded and we cannot directly get the aspect distribution of sentences. Inspired by the progress made in Latent Dirichlet Allocation (LDA) models (Chemudugunta et al., 2007; Li et al., 2010; Delort and Alfonseca, 2012), we newly add the sentence level between the word level and document level in the h-uHDP model. Since neighboring sentences in one document usually talk about one same aspect, we assume that the aspect assignment of each sentence is not conditionally independently. With such assumption, the aspect of each sentence is determined by the aspect distribution of both the document and its neighboring sentences. Our h-uHDP model is capable of mapping multiple levels of information into the latent aspect space. The rest of this paper is organized as follows. Section 2 discusses the related work on update summarization and evolutionary clustering. Section 3 briefly introduces Dirichlet Process (DP) and Hierarchical Dirichlet Process (HDP). Section 4 presents our proposed aspect model h-uHDP and its inference algorithm. Section 5 addresses the algorithm of update summarization. Section 6 shows the experimental results. Finally, Section 7 concludes the paper.
2 Related work
In this section, we review the related work on update summarization and evolutionary clustering.
2.1 Update summarization
In generic summarization2, numerous techniques have been developed to measure the salience of sentences and remove the redundancy in summaries, such as the well-known Maximal Marginal Relevance (MMR) (Carbonell and Goldstein, 1998), TextRank (Mihalcea and Tarau, 2004) et al. Some initial work on update summarization inherited the idea of salience ranking in generic summarization and extended the available algorithms to selecting sentences from the newly-coming documents. Boudin et al. (2008) proposed a sentence scoring algorithm derived from MMR and preferred to select those sentences dissimilar to previously read sentences. Fisher and Roark (2008) used a supervised perceptron and simple filtering rules to get the salient sentences for the update documents. Gillick et al. (2008) formulated sentence selection as the problem of integer linear programming and aimed to select a set of sentences that maximize the sum of weights of n-grams covered by the sentences. Adapting the ILP of Gillick et al.(2008), CLASSY by Conroy et al.(2009) seeked to find the sentences that maximize the total approximate oracle scores. Wang and Li (2010) employed an incremental hierarchical clustering algorithm COBWEB to re-organize sentence clusters immediately after new documents/sentences arrive and the most representative sentences for the updated clusters were selected. The graph-based algorithm – TextRank (Mihalcea and Tarau, 2004) has more extensions for update summarization. TimedTextRank by Wan (2007) introduced the time decaying ratio for weighting sentence reinforcement, PNR2 by Li et al. (2008) added the negative reinforcement between sentences, and MRSP by Du et al. (2010) turned the historical sentences into sink points which are limited their reinforcement with other sentences. Through reinforcement propagation, the salience of sentences in the update documents is influenced by history documents to assure that those sentences with less redundancy with history documents appear in the update summaries. However, they mainly start from the lexical level and cannot explain explicitly what the novel information is.
There are also a few attempts to explore semantic information in update summarization. Steinberger and Jezek (2009) proposed the Iterative Residual Rescaling (IRR) algorithm which
maps the documents to a set of latent semantic aspects3. Then sentences containing novel and significant aspects are then selected for the summary. Inspired by Latent Dirichlet Allocation (LDA) (Blei et al., 2003), Delort and Alfonseca (2012) proposed the DualSum algorithm which designs a nonparametric Bayesian approach to generate four kinds of aspects respectively for background, document, common and novel information. Though these researches have achieved some preliminary findings on exploring semantic information in update summarization, they still cannot present a unified framework to reveal the dynamics of a given topic.
2.2 Evolutional clustering and HDP
Evolutionary clustering is a relatively new research for topic detection, which aims to preserve the smoothness of clustering results over time, while fitting the data of each epoch. The work by Chakrabarti et al. (2006) was probably considered as the first to address the problem of evolutionary clustering. They proposed a general framework of evolutionary clustering and extended two classical clustering algorithms to the evolutionary setting: (1) k-means clustering, and (2) agglomerative hierarchical clustering. Later, Chi et al. (2008) presented two frameworks by incorporating temporal smoothness constraint and applied them on spectral clustering algorithm. While the researches on extending classic clustering algorithms have advanced the literature of evolutionary clustering, they have a very restrictive assumption: the number of clusters over time stays the same. It is clear that this assumption is obviously violated in many real applications.
Recently, HDP has been widely used in evolutionary clustering due to its capability of learning number of clusters automatically and sharing mixture components across different corpora. In HDP, each corpus is modeled by an infinite Dirichlet Process (DP) mixture model, and the infinite set of mixture clusters is shared among all corpora. Sethuraman (1994) gave a stick-breaking constructive definition of DP for arbitrarily measurable base space, which is very useful to model the weight of mixture components in the mixture model. Blackwell and MacQueen (1973) explained DP using the Polya urn scheme, as the predictive distribution of an event is proportional to the frequency of the existing events or to a concentration parameter for an unpresented event. The Polya urn scheme is closely related to the Chinese Restaurant Process (CRP) metaphor, which is applied on HDP demonstrating the ‘clustering property’ as the ‘distribution on partition’. In addition, HDP can also be seen as an LDA-based model, which can automatically and naturally infer the number of clusters from data (Teh et al., 2006). Base on HDP, some algorithms of evolutionary clustering are proposed by incorporating time dependencies, such as DPChain, HDP-EVO, HDP-HMM, dynamic HDP and EvoHDP et al. (Xu et al., 2008; Xu et al., 2008; Ren et al., 2008; Zhang et al., 2010; Gao et al., 2011).
3 DP and HDP
In this section, we briefly introduce Dirichlet Process (DP) and Hierarchical Dirichlet Process (HDP).
A DP can be considered as a distribution of probability measure G. Suppose a finite partition (T1,…,TK) in the measure space and a probability distribution G0 on , we write G~DP(α, G0) if (G(T1),…,G(TK)) ~ Dir(αG0(T1),…,αG0(TK)), where α is a positive concentration parameter and
G0 is called a base measure. Sethuraman (1994) showed that a measure G drawn from a DP is discrete by the stick-breaking construction:
~ (1, )
k B e ta
,
1 1
1 1
(1 ) (1 )
k k
k k l k l
l l
, {k}k 1~G0
,
1
=
k
k k
G
(1)where kis a probability measure concentrated at k. It is important to note that the sequence π
1
(k)k
constructed by Eq. (1) satisfies
1 k 1
k
with probability 1. For convenience, we write π~GEM(α)4 if π is a random probability measure defined by Eq. (1). After observing the draws 1, 2, ...,n1from G, the posterior of G still satisfies the DP distribution:0
1 2 1
| , , ..., ~ ( 1, )
1
k
k n
m G
G D P n
n
(2) where mk denotes the number of draws taking the value k.
A HDP defines a distribution over a set of DPs. In HDP, a global measure G0 is distributed as a DP with concentration parameter γ and base measure H. Then a set of measures { } 1
J j j
G is drawn independently from a DP with base measure G0. Such a process is described as:
0~ ( , )
G D P H , Gj|0,G0~D P(0,G0) (3)
For each j, let { } 1 j
n j i i
be independent and identically distributed (i.i.d.) random variables drawn
from Gj. nj observations { } 1 j
n j i i
x are drawn from the mixture model: ~
j i Gj
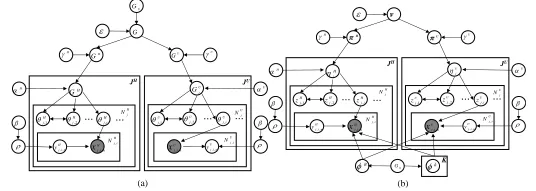
, xj i ~F(x|j i) (4) where F(x|θji) denotes the distribution of generating xji. Equations (3) and (4) complete the definition of a HDP mixture model, whose graphical representation is shown in Figure 1(a).
According to Eq. (1), the stick-breaking construction of HDP can be represented as:
β =(k)k 1~G E M( )
, 0
1
=
k
k k
G
, πj=(j k)k1
~ DP(α0, β),
1
=
k
j jk
k
G
(5)and the corresponding graphical model is shown in Fig. 1(b). We can see that HDP can readily be extended to as many levels as are deemed useful. That is, we can obtain a hierarchy of DPs, where the draw from the DP at a given node serves as a base measure for its children (Teh, 2006).
FIGURE 1– Graphical representation for HDP. (a) original representation. (b) stick-breaking construction
4 h-uHDP model
This section clarifies why and how we propose our improved HDP model (named history-update HDP, h-uHDP for short) for the task of update summarization.
In update summarization, a given topic is composed of two document sets (docset for short) varying two epochs, namely history and update epoch. To precisely observe the dynamics of the aspects in one topic, we need to model the aspects over three levels: topic corpus, docset at each
4 GEM stands for Griffiths, Engen, and McCloskey (Teh et al. 2006)
H
0
G 0
j
G ji xji
J nj
0
j
π zji xji
H
k
J
j n
epoch, and document. In such case, we extend the standard HDP to a three level HDP: a set of common aspects on the top level of the hierarchy explicitly address the issue of aspect correspondence between two epochs; the second level is for the aspects at each different epoch, which are considered as the subset of the top level aspects; and the third level is designed for the aspects of each document; the relationship among these three levels of aspects can be obtained through statistical inference. Thus, h-uHDP can naturally model the diversity and connections of aspects between two epochs.
First of all, we introduce some notations in our real data setting of update summarization. We use
JHand JU to denote the number of documents in the history and update epochs respectively. For the convenience of description, we use the symbol e in the superscript to denote U or H. Each
docset is denoted as { } 1
e
e e J
j j
D D where document
e j D has e
j
N sentences { ,} 1 e j
N e j i i
s and the ith
sentence in e j
D has ,
e j i
N observed word samples ,
, ,} 1
{ i
e j
N e j i n n
x .
4.1 Model
Our h-uHDP model is an extension of a three-level HDP model which naturally incorporates the levels of corpus, docset and document as shown in Fig. 2. Specifically, we design a two-level HDP respectively for each docset, and these two HDPs share an overall base measure G which is drawn from DP(ε,G0) and serves as the overall component bookkeeping for both epochs. We use
GH to denote the global measure for the history epoch and call it the history global measure. Similarly, GU is called the update global measure. Then, the local measures for each document
are denoted as { } 1 e
e J j j
G , which are drawn from the history or update global measures. That is,
~ ( , )
e e
j
e P
G D G given e{H U, }.
Then, we introduce the sentence level into the HDP model where each sentence is assigned to one aspect with the consideration of both its neighboring sentences and words contained by this sentence. We use ,
e j i
to denote the aspect assignment of the ith sentence in e j
D . There is also a binomial distribution y~b in o m ia l(), which controls for each sentence how often we encounter a background word, or an aspect word. ρ has a beta prior with parameter β: ~b e ta().
FIGURE 2 –Graphical representation for h-uHDP. (a) original representation. (b) stick-breaking construction
Fig. 2(a) illustrates the graphical representation of h-uHDP model. The generation process of our h-uHDP model is as follows:
1. Draw an overall base measure G~ D P( , G0) , which denotes the overall aspect distribution for all documents at two epochs.
... G H G U G H
U
j H G ... ... ... H
U
,1 H j , , H j i n
x , 2 H j , H j i ,1 U j , 2
U j , U j i , , H j i n y 0 G U j G JU JH , , U j i n
x , ,
U j i n
y H j N U j N , H j i N , U j i N (a) ... H
U
j H ... ... ... H
U
,1 H j z , , H j i n
x , 2 H j z , H j i z ,1 U j z , 2
U j z , U j i z , , H j i n
y U j J U JH , , U j i n
x , ,
U j i n
y
B
G0 kK
H j N U j N v H
π πU
[image:6.420.60.328.363.459.2]2. For e{H U, }:
2.1 Draw the global measure Ge according to the overall measure G. Ge serves as the base measure for each docset. That is, Ge ~D P(e,G).
2.2 Draw the local measures { } 1 e
J j j e
G . Each e j
G for document Dej is drawn from the
corresponding global measure e
G : Gej ~D P(e,Ge). 2.3 Draw the aspect for sentence ,
e j i
s according to Gej and the aspect assignment of
neighboring sentences: , ~ ( | , )
e j ,- i
θ
e e
j i g Gj
2.4 Sample the words ,
, , 1
{ }
e j i
N e j i n n
x : , , ~ ( )
e j i n
y b i n o m i a l , xej i n, , ~ f(x|ej i,,yej i n, , ) where
, , ,
( | e , e )
j i j i n
f x y is a distribution parameterized by e, j i
and , ,
e j i n
y .
We can see that the extended three-level HDP model h-uHDP, in fact, considers five levels for a given topic, including word, sentence, document, docset, and corpus. At the same time, aspect assignment dependency between sentences is naturally incorporated in the model.
Next, we will provide the stick-breaking perspective and a Gibbs sampler for model inference.
4.2 The stick-breaking construction
According to the stick-breaking construction of DP, the overall base measure G can be expressed with the following form:
1 k k
k
G v
, v~G E M( ) (6) Then, according to Eq. (5), we can also get the global and local measures with the form as:1 k
e e
k k
G
, πe ~ ( e, )D P v (7)
and
1 k
e e
j k jk
G
, e ~ ( , e)j
η e π
D P (8)
As with the standard HDP, we get the stick-breaking construction for h-uHDP, illustrated in Figure 2(b).
Next, we focus on the modeling of the sentence level. ,
e j i
z is used to indicate the aspect
assignment of sentence ,
e j i
s and the formula of assigning aspect k to ,
e j i
z is as follows:
, , ,
( j ie | ,z-j,i) k( ej i) ( ej i |ze-j,i)
p z k f s g z k (9)
and ,
,
[1 , ] { }
( , )
1
( | ) e x p
| |
| 1 |
e - j ,i
z
e j
e j d e
j i e
d N i
j
k z
g z k
d i
N
(10) In Formula (9), ( ,)e k j i
f s denotes the probability of generating sentence sej i, given aspect k and
the function g(·) reflects the influence from the neighboring sentences. We use the symbol ‘-’ to denote the exclusion of current sentence or word, and z- j , i means the aspect assignment of all
sentences in e j
D excluding the current sentence. ( , , )
e j d
k z
equals 1 if the aspect assignment of the
dth sentence in e j
D is k, 0 otherwise. The parameter (named as sentence influence factor) is
used to tune the influence from neighboring sentences. Eq. (10) shows that the longer the distance from one sentence to the current sentence, the less the influence that sentence has on the aspect assignment of the current sentence. , ,
e j i n
y is the indicator variable of word xej i n, , and
controlled by a binomial distribution with beta prior β. If , , 0
e j i n
If , , 1
e j i n
y , xej i n, , is an aspect word.
4.3 Inference
For model inference, we use a straightforward Gibbs sampler based on the Chinese Restaurant Franchise (CRF) and the stick-breaking construction. Thus, we begin with an analog of the CRF process for h-uHDP: a document e
j
D corresponds to a restaurant, and a sentence ,
e j i s
corresponds to a customer. Different from the standard HDP, one customer in our model is seen as a family which includes a few persons. Here, we assume that the persons in one family usually have the same preference for one dish at one table except some persons shown no preference for any food. The general backgrounddish is assigned to the persons having no preference and a specific dish k is assigned to those persons having preference. The global menu of dishes is denoted by K+1 i.i.d. random variables B, 1,,K distributed according to G0. We also introduce variables, e
j t
, to represent the dish served at table t in restaurant j. To denote the associations among ,
e j i
, e
j t
and k, we let e ji
t be the index of e j t
associated with ,
e j i
, and let e
j t
k be the index of k associated with e j t
. In the CRF metaphor, customer ,
e j i
s sits at table e ji t
while table t in restaurant e j
D serves dish e j t
k .
We also need a notation for counts. Specifically, we need to record the counts of families, persons and tables. Marginal counts are represented with dots in the subscript. e
j t
n represents the number of families in restaurant j at table t in the corresponding epoch, and jk
e
n represents the number of families in restaurant j eating dish k in the corresponding epoch. The notation e
jk m
denotes the number of tables in restaurant j serving dish k in one epoch, e j
m denotes the number of tables in restaurant j in one epoch, k
e
m denotes the number of tables serving dish k in one epoch, and e
m denotes the total number of tables in each epoch. The notation above with removing the superscript represents the corresponding counts in both epochs. For example, n k is the total number of customers assigned to aspect k in both epochs and mk denotes the total number of tables serving dish k in both epochs.
In our implementation, we first sample the index variables e ji t and e
j t
k . Then the ,
e j i
and e j t
can be reconstructed from their index variables and k, which makes the MCMC sampling more efficient (Blei et al., 2006).
Samplingt. Due to the space limit, we would just show the sampling formula without derivation.
The likelihood due to ,
e j i s given e
ji
t t for some previously t is , , ( ) e j i e jt s e j i k
f s . The likelihood of generating ,
e j i
s given e n e w j i
t t can be calculated by integrating out the possible values of n e w
j t
k .
e
K denotes the set of aspects assigned in current epoch. The prior probability that e ji
t takes on a
previously used t is calculated according to ( , | )
e - j ,i
z e j i
g z , ( ,)
j i j t
s e
k j i
f s and e j t
n , whereas the probability that it takes on a new value (i.e. tn e wmej1) is proportional to
e
. Then, the conditional distribution of e
ji
t given the rest of the variables is:
, , , ( | ) ( ) ( | , ) ( | , , ) e -j,i -ji -ji
z if p r e v io u s ly u s e d
t k
t k if
ji jt
e
s
e e e
j i jt k j i
e
ji e e n e w n e w
j i ji
g z k n f s t
p t t
P s t t t t
and , , , {,} , , , , , ( | , , ) ( | ) ( ) ( ) ( ) ( ) e -ji -j,i
t k z
e j i e
e
j i j i
n e w H U e
e e
s
e n e w e k k e
j i ji kK j i e e e e k j i
e e
s e s e
k
k j i j i
e e e e k
kK K
m m
P s t t g z k f s
m
m m
m
f s f s
m m m m (12)
where e
m denotes the total number of tables in epoch e and
{H U, }
K means the set of the aspects available in the two epochs.
According to the distribution , , ~ ( )
e j i n
y b i n o m i a l and ~b e ta(), we can get the conditional
probability of generating sentence ,
e j i
s given a specified aspect k:
, , , , , , , , , , , , , , , , , , , ( ) () ( ) ( ) () () ( ) ( ) 1 , ( ) ( ) () ( ) ( ) ( )
i f p r e v i o u s l y u s e d
( ) ( ) ( ) ( ) ( ) ( ) ( ) e j i e e
j i n j i n
e e
e e
j i n j i
j i j i n
e e
j i n j i
e j i e j i n e j j i s k x x k k k x s
k k s x
y
s e
k j i
s x k x s k E E n V k
n A V E
f s E V A V , ,
, , 1
e e
i n j i e j i n
n e w
s y k k
(13)
,
()
(e)
j i
k s
A denotes the number of words that belong to aspect k in sentence ,
e j i
s . It is obvious that background words do not influence the aspect assignment of sentences. n k is the total number of words assigned to aspect k in both epochs. V represents the size of vocabulary.
, ,
()
(e )
j i n
k x
E denotes
the total number of times that word , ,
e j i n
x belongs to topic k in both docsets, and , , , ( ) ( ) e j i e j i n
s x
E denotes
the number of times that word , ,
e j i n
x exists in ,
e j i
s .
If the sampled value of e ji
t is n ew
t , then we can sample n e w
e j t
k according to (12):
, , , , , , , ( | ) ( ) ( ) ( | , ) ( ) ( )
n e w
e - j ,i
e - j t
z i f
t k i f
i f =
e j i
e j i n e w
e j i n e w
e e
s
e k k e e
j i e e e e k j i
e
s
e k e e
k j i
e e
j t
e
s e n e w
j i
e e k
m m
g z k f s k K
m
m m
m
p k k f s k K K
m m
f s k k
m m (14)
All the counts above except
,
()
(e)
j i
k s
A and ,
, , ( ) ( ) e j i e j i n
s x
E exclude the current sentence.
Samplingk. Because the process of sampling t actually changes the component member of tables,
we continue to sample e j t
k for each table. The conditional probability p k( ej tk| ,t k- j t) can be calculated similar to Eq. (14) and it is noted that a set of customers (not one custom) at table t
should be considered.
Samplingy. , ,
e j i n
y determines whether , ,
e j i n
x is a background word or an aspect word. If
, , 0
e j i n
y ,
, ,
e j i n
x is a background word, otherwise assigned to aspect k. we sample , ,
e j i n y as:
, ,
, ,
( )
( 0 ) ( 0 )
, ,
() ( 0 )
, , ,
( )
(1 ) ()
, , ()
() (1 )
0 2
( | , )
1 2
- i , j , n
i f
y
i f
e j i n
e j i n x
e j i n
e e
j i n j i
x
k e
j i n k
C C
y
C C V
p y z k
C C
y
C C V
(15)
where C() denotes the total number of words in both docsets, C( 0 ) denotes the total number of
background words, C(1 ) denotes the total number of aspect words, and
()
(1 )
k
number of words that are assigned to aspect k. ( , ,) ( 0 )
e j i n
x
C represents the number of times that word
, ,
e j i n
x is assigned to background word and ( , ,)
()
e j i n
x k
C represents the total number of times that word
, ,
e j i n
x is assigned to aspect k. The base measure G0 was set a symmetric Dirichlet distribution with
parameters (e.g. 0.5).
Based on Equations (11), (12) and (14), the aspect assignment probability of each sentence can be calculated as:
, , , , , , , { , } , , ( | ) ( ) ( | ) ( ) ( ) ( | ) ( ) e e
- j ,i - j ,i
e - j t
z z
i f
k i f
e j i e j i e j i s
e e e e e
j i jk k j i j i
e
e e
s e
k k
k j i
e e e e
e
s
e e k e H U e
j i e e k j i
e e
e e
g z k n f s g z k
k K m m f s m m m m
p s k f s k K K
m m m , ,
( ) i f =
e j i n e w
s e n e w
j i k
f s k k
m (16)
As for the concentration parameters of h-uHDP, i.e., ,e and e, we sample them from a vague gamma prior which is set to be Ga(10.0, 1.0). The sampling method is the same as that in (Teh et al., 2006).
5 Update Summarization with h-uHDP model
The task of update summarization aims to produce an update summary for the documents in the
update epoch, assuming that users already read earlier documents in the history epoch. That is,
we need to boost sentences in update epoch that can bring out important and novel information. On one hand, the generated summary should extract the main content in DU, and on the other hand, the summary should avoid mentioning too much old information in DH. To care for these two points, we propose a sentence selection strategy based on Kullback-Leibler (KL) divergence, which has been widely used in extractive summarization (Haghighi and Vanderwende, 2009; Mason and Charniak, 2011; Delort and Alfonseca, 2012 ).
Given the history sentence set SH and the update sentence set SU, we propose a function to score a set of sentences Sum which is a subset SU.
( ) ( SH || S u m) ( SU || S u m)
S c o r e S u m K L p p K L p p (17)
In the equation, the first term means the prize on the divergence from epoch history and the
second term represents the penalty on the divergence from epoch update. The parameter
(called as epoch balance factor) is used to tune the weights of two KL distances. pS u m is the empirical aspect distribution of the candidate summary Sum. pSHand pSU respectively denote
the aspect distribution of SH and SU.
( Se|| S u m)
K L p p (e{H U, }) represents the KL divergence
given by
1
( | ) ( | ) lo g
( | )
e K
e
k
p S k
p S k
p S u m k
1 1
( | ) ( ) ( | ) ( )
| |
,
e
e
e sS s S u m
j j
p S k p s k p S u m k p s k
S u m
N
(18)Generally, an optimum update summary should have the aspect distribution which approximates to pSU as possible and keep far away from the distribution pSH. Let
*
S u m denote the optimum
update summary. We can get *
S u m that maximizes the scoring function.
*
& & ( )
a rg m a x ( )
U
S u m S w o r d s S u m L
S u m S c o r e S u m
(19)
Since the problem of finding the subset of sentences from a collection that maximize the scoring function is NP-complete, a greedy algorithm is applied by adding sentences one by one. We use Y
to denote the sentence set which contains the selected summary sentences. The algorithm first initializes Y to and X to SU. During each iteration, we select from X one sentence (i.e. s
m) which makes S c o r e s( mY) have the highest score. To avoid aspect redundancy in the summary, we also adopt the MMR strategy in the process of sentence selection. That is, for each sm, we compute the semantic similarity between sm and each sentence st in set Y as follows:
2 2
1 1
( | ) ( | )
c o s _ ( , )
( | ) ( | )
m t
k m t
K K
m t
k k
p s k p s k
s e m s s
p s k p s k
(20)
6 Experiments
In our experiments, we use four years of TAC (2008-2011) data, which contain 44-48 topics per year. For each topic, two docsets (named docset H and U) are given to respectively describe the
history epoch and the Update epoch. Table 1 illustrates the number of topics, averaged number of
documents per docset, and averaged number of sentences per docset for each year’s data.
TAC 2008 2009 2010 2011
Topics # 48 44 46 44
docset H U H U H U H U
Avg Doc # per docset 10 10 10 10 10 10 10 10
Avg Sen # per docset 236.5 222.4 253.5 228.3 238.6 230.2 208.9 210.5
TABLE 1 – Experiment data (TAC 2008 - 2011).
As for the automatic evaluation of summarization, we still use the widely used ROUGE (Recall-Oriented Understudy for Gisting Evaluation) (Lin and Hovy, 2003) measures, including ROUGE-1, ROUGE-2, and ROUGE-SU45and their corresponding 95% confidential intervals. In order to obtain a more comprehensive measure of summary quality, we also conduct manual evaluation on TAC 2011 dataset with the reference to (Haghighi and Vanderwende, 2009; Celikyilmaz and Hakkani-Tur, 2011; Delort and Alfonseca, 2011).
6.1 Parameter tuning
To get the final update summary using the h-uHDPSum algorithm, we still need to determine two parameters: sentence influence factor in Eq. (10) and epoch balance factor in Eq. (17). The combination of the two factors makes it hard to find a global optimized solution. So we apply a
gradient search strategy. At first, the epoch balance factor is fixed to a given value. Then the performance using different values of is evaluated. After that, we fix with the value which has achieved the best performance, and conduct experiments to find an appropriate value for . TAC 2008 and 2009 datasets are used as training data to tune these two parameters.
Firstly, is set to the value of 1, i.e. the prize on the divergence from epoch history is as important as the penalty on the divergence from epoch update. Reviewing Eq. (10), we can see that, the aspect assignment of one sentence is mainly determined by its neighboring sentences when is set a large value, whereas the influence from other sentences is not considered at all when is set 0. In the first place, we experiment the h-uHDPsum algorithm by setting in the range from 0 to 10 with interval of 1. The ROUGE scores drop sharply when is set a value larger than 2.0. Next, is set in the range from 0.0 to 2.0 with interval of 1.0. Fig. 4 presents the ROUGE-2 and ROUGE-SU4 evaluation results of h-uHDPSum, with regard to different values of . We find that the ROUGE scores reach their peak at around 1.0 and drop afterwords. The experimental results conform to our expectation and verify that the h-uHDP model is reasonable by considering the influence among sentences.
FIGURE 4 – Tuning parameter σ when is set to 1.
FIGURE 5 – Tuning parameter when σ is set to 1.
Next, we fix the sentence influence factor at 1.0 and tune the parameter . From Eq. (17), we can see that is used to balance the prize for the divergence from history epoch and penalty on the divergence from the update epoch. When is set as the value of 0, the scoring of sentences is only determined by docset H. That is, a sentence is likely to be selected into summary, only when it has a large divergence of aspect distribution from docset H. When is set a larger value, penalty on the divergence from docset U is more considered. Similar to the process of tuning , the performance using different values of ranging from 0 to 10 with interval of 1 is evaluated. We find that the peak performance of should be located in the range of [0.0, 2.0]. Thus, we conduct experiments to find an appropriate value for in the range from 0.0 to 2.0 with interval of 0.1. Fig. 5 shows the performance of h-uHDPSum with respect to . Performance gets better as increases from 0 to 1.4, and then declines gently until arrives at 3.0. Afterwards, the curve becomes smooth and means that the summarization algorithm is mainly up to docset U to decide which sentences to select. Parameters and are respectively set as 1.0 and 1.4 in the h-uHDPSum algorithm.
6.2 Comparison with other approaches
In this subsection, we compare our h-uHDPSum algorithm with several baseline methods on TAC 2010 and TAC 2011 datasets. One kind of baseline methods consists of the top three performing systems (denoted as SysRank 1st, 2nd and 3rd) on update summarization tasks according to the ROUGE-2 metric on TAC2010 and TAC2011. From Table 3, we can see that our approach obviously outperformed the top three participating systems both on TAC2010 and TAC2011, with respect to the ROUGE-2 and ROUGE-SU4 scores along with the corresponding 95% confidence intervals.
TAC2010 TAC2011
ROUGE-2 ROUGE-SU4 ROUGE-2 ROUGE-SU4
h-uHDPSum 0.0857(0.0784-0.0930) 0.1255(0.1182-0.1328) 0.1017(0.0910-0.1034) 0.1364(0.1265-0.1473)
SysRank 1st
0.0799(0.0747-0.0851) 0.1198(0.1154-0.1244) 0.0959(0.0894-0.1029) 0.1309(0.1251-0.1366) SysRank 2nd
0.0790(0.0740-0.0842) 0.1187(0.1142-0.1234) 0.0924(0.0857-0.0993) 0.1274(0.1217-0.1334) SysRank 3rd 0.0729(0.0682-0.0779) 0.1080(0.1041-0.1122) 0.0863(0.0808-0.0920) 0.1280(0.1229-0.1330)
h-uHDPSum-noBG 0.0812(0.0767-0.0852) 0.1199(0.1120-0.1278) 0.0931(0.0874-0.0988) 0.1310(0.1258-0.1362)
2LevHDPSum 0.0780(0.0709-0.0851) 0.1171(0.1110-0.1232) 0.0917(0.0863-0.0971) 0.1315(0.1227-0.1401)
HDPSum 0.0708(0.0631-0.0785) 0.1091(0.1014-0.1176) 0.0842(0.0782-0.0902) 0.1218(0.1163-0.1273)
2LevLDASum 0.0720(0.0687-0.0793) 0.1152(0.1067-0.1237) 0.0879(0.0831-0.0925) 0.1310(0.1255-0.1366)
LDASum 0.0649(0.0594-0.0704) 0.1027(0.0936-0.1118) 0.0767(0.0704-0.0830) 0.1074(0.1015-0.1134)
TABLE 2 – Performance Comparison on TAC2010 and TAC2011.
To illustrate the effectiveness of our aspect modeling technique, we provide five other baseline systems which adopt different aspect modeling techniques. The systems h-uHDPSum-noBG and
2LevHDPSum can be seen the simplified versions of h-uHDPSum. h-uHDPSum-noBG is the
same as h-uHDPSum except that the general background information is not considered, whereas
2LevHDPSum is a two-level (i.e. document level and sentence level) HDP model where the
docset level is removed. At the same time, we implement one standard HDP model for comparison. As shown in Table 2, h-uHDPSum is better than both h-uHDPSum-noBG,
2LevHDPSum and HDPSum, which verifies that the identification of background words or the
introduction of the docset level can promote the performance of update summarization. Even without consideration of the background information, we can see the h-uHDPSum-noBG
approach can be comparable to the best participating system of TAC evaluations. In addition, to compare with another popular modeling technique - Latent Dirichlet Allocation (LDA), we design a two-level LDA-based system 2LevLDASum and a standard LDA-based system LDASum. Both 2LevLDASum and 2LevHDPSum are similar as possible beyond the distinction that
2LevLDASum assume a fixed finite number of aspects6 while 2LevHDPSum does not. We can see
that 2LevHDPSum is better than 2LevLDASum and HDPSum better than LDASum in performance. This can be easily explained, novel aspects can be automatically detected and the aspect number is determined naturally in HDP-based models. In contrast, how to determine the aspect number in the LDA-based models is still an open problem. This is also the reason why we select HDP as the foundation of our aspect modeling technique.
6.3 Manual evaluation
In order to obtain a more accurate measure of summary quality, manual evaluation is required. In this section, we compare our h-uHDPSum approach with 2LevLDASum and the best participating
6 In our experiments, the aspect number is set as 10, 20, 30 and 40 respectively and we select the best performed
system (Peer 43). Similar to the manual evaluation in TAC, human assessors assign a score to each summary with respect to each of the following four criteria: 1) Overall responsiveness (overall performance in terms of content and fluency), 2) Focus (containing less irrelevant details), 3) Novelty (containing novel information beyond docset H), 4) Non-redundancy (repeating less the same information). The score is an integer between 1 (very poor) and 5 (very good). We randomly select 28 topics from TAC 2011 data and assign each topic to three different assessors7.In Table 3, the left four columns report the average scores of each criterion for the three systems. The experimental results indicate that h-uHDPSum is significantly better than both
Peer 43 and 2LevLDASum (based on paired t-test with p-value < 0.01).
Simultaneously, a fairly standard approach for manual evaluation is conducted through pairwise comparison (Haghighi and Vanderwende, 2009; Celikyilmaz and Hakkani-Tur, 2011). According to the rating scores, each pair of summaries is judged which one is better under each criterion. If two summaries have the same score, they are judged a tie (of the equal quality). We record the times of ‘winning’ (having a higher score) and tie for each system. In Table 3, the right six columns show the evaluation results in frequencies respectively for h-uHDPSum vs. Peer 43, and
h-uHDPSum vs. 2LevLDASum. The experimental results also indicate that h-uHDPSum is
significantly better than both Peer 43 and 2LevLDASum. We also observe that the winning times
of h-uHDPSum under the novelty criterion is much more than those under the other criteria. This
indicates that our approach can exhibit a clear advantage of promoting the novelty performance in update summaries.
h-uHDPSum Peer43 2LevLDASum
h-uHDPSum vs. Peer 43 h-uHDPSum vs. 2LevLDASum
h-uHDP. Tie Peer43 h-uHDP. Tie 2LevLDA.
Overall 3.94 3.65 3.56 31 39 14 50 19 15 Focus 4.06 3.75 3.65 36 26 22 33 48 3 Novelty 4.17 3.69 3.67 52 13 19 62 6 16 Non-redund. 4.18 3.91 3.98 41 22 21 36 44 4
TABLE 3 – Results of manual evaluation on TAC2011.
Conclusion
In this paper, we propose a novel approach based on a three-level HDP model h-uHDP for update summarization. The h-uHDP model can detect the birth, splitting, merging and death of specific aspects and the general background information for a given topic. Under the sentence extraction based framework of summarization, we especially strengthen modeling the sentence level in h-uHDP, where the aspect assignment of each sentence is influenced by its neighboring sentences. Based on h-uHDP, we propose a sentence selection strategy adopting KL divergence, which cares for both salience and novelty of sentences. Automatic and manual evaluations on TAC data illustrate that our approach obviously outperforms the state-of-the-art approaches.
Acknowledgments
The research work described in this paper has been partially supported by NSFC grants (No.90920011 and No.61273278), NSSFC grant (No: 10CYY023), National Key Technology R&D Program (No: 2011BAH10B04-03), and National High Technology R&D Program (No. 2012AA011101). We also thank the three anonymous reviewers for their helpful comments. Corresponding authors: Sujian Li ([email protected]) and Baobao Chang ([email protected]).
7 Each topic includes three update summaries generated by the three systems. A total of 1008 (28topics *
References
Blackwell, D. and MacQueen J. B. (1973). Ferguson distributions via Polya urn schemes. The Annals of statistics, 1: 353-355.
Blei, D., Andrew, Y. N. and Jordan, M. L. (2003). Latent Dirichlet Allocation, in Journal of
Machine Learning Research, vol 3: 993-1022.
Boudin, F., El-Beze, M. and Torres-Moreno, J. (2008). A scalable MMR approach to sentence scoring for multi-document update summarization. In COLING 2008, volume: Posters, pages 23–26.
Carbonell, J. and Goldstein, J. (1998). The use of MMR, diversity-based reranking for reordering documents and producing summaries. In Proc. of the 21st SIGIR, pages 335-336.
Celikyilmaz, A. and Hakkani-Tur, D. (2011). Discovery of topically coherent sentences for extractive summarization. In Proc. of the 49th ACL, pages 491-499.
Chakrabarti, D., Kumar, R. and Tomkins, A. (2006). Evolutionary clustering, in Proc. of
KDD2006, pages 554–560.
Chemudugunta, C., Smyth, P. and Steyvers, M. (2007). Modeling general and specific aspects of documents with a probabilistic topic model. In Neural Information Processing Systems.
pages 241-248.
Chi, Y., Song, X., Zhou, D., Hino, K. and Tseng, B. L. (2007). Evolutionary spectral clustering by incorporating temporal smoothness, In Proc. of KDD 2007, pages 153–162.
Delort, J. and Alfonseca, E. (2012). DualSum: a topic-Model based approach for update summarization, In Proc. of the 13th EACL, pages 214-223.
Du, P., Guo, J., Zhang, J. and Cheng, X. (2010). Manifold ranking with sink points for update summarization. In Proc. of CIKM’2010, pages 1757-1760.
John, C. M., Judith, S. D. and Dianne, O. P. (2009). Summarization and metrics. In Proc. of TAC’09.
Fisher, S. and Roark, B. (2008). Query-focused supervised sentence ranking for update summaries. In Proc. of 1st Text Analysis Conference, TAC-2008.
Gao, Z. J., Song, Y. and Liu, S. (2011). Tracking and connecting topics via incremental hierarchical Dirichlet Processes, In ICDE 2011. pages 1056-1061.
Gillick, D., Favre, B., and Hakkani-Tur, D. (2008). The ICSI summarization system at TAC 2008. In Proc. Of TAC’08.
Griffiths, T. L., Steyvers, M., Blei, D. M. and Tenenbaum, J. B. (2005). Integrating topics and syntax. In Neural Information Processing Systems, vol 17, pages 537-544.
Gruber, A., Weiss, Y. and Rosen-Zvi, M. (2007). Hidden topic Markov models. In Proc. of the conference on Artificial Intelligence and Statistics.
Haghighi, A. and Vanderwende, L. (2009). Exploring content models for multi-document summarization. In Proc. of Human Language Technologies: The 2009 Annual Conference of the
Li, P., Jiang, J and Wang, Y. (2010). Generating templates of entity summaries with an entity-aspect model and pattern mining, in ACL 2010, pages. 640-649.
Li, W., Wei, F., Lu, Q. and He, Y. (2008). PNR2: ranking sentences with positive and negative reinforcement for query-oriented update summarization. In Proc. of COLING ’08.Vol 1, pages 489–496.
Li, X., Du, L., and Shen, Y. (2012). Update summarization via graph-based sentence ranking,
IEEE Transactions on Knowledge and Data Engineering.
Lin, C. Y. and Hovy, E. H. (2003). Automatic evaluation of summaries using N-gram co-occurrence statistics. In Proc. of HLT-NAACL 2003, pages 71-78.
Mason, R. and Charniak, E. (2011). Extractive multi-document summaries should explicitly not contain document-specific content. In Proc. of WASDGML’11, pages 49-54.
Mihalcea, R. and Tarau, P. (2004). TextRank: bringing order into texts. In Proc. of EMNLP ’04.
Ren, L., Dunson, D. B. and Carin, L. (2008). The dynamic hierarchical Dirichlet process. In
ICML’ 08, pages: 824- 831.
Sethuraman J. (1994). A constructive definition of Dirichlet priors. In Statistica Sinaca, Vol 2 pages: 639-650.
Shen, C. and Li, T. (2010).Multi-document summarization via the minimum dominating set. In
COLING ’10, pages 984–992.
Steinberger, J. and Jezek, K. (2009). Update summarization based on novel topic distribution. In
Proceedings ofDocEng’09. pages 205-213.
Teh, Y., Jordan, M., Beal, M., and D. Blei. (2006). Hierarchical Dirichlet processes, Journal of
the American Statistical Association, vol. 101, pages 1566–1581.
Wan, X. (2007). TimedTextRank: Adding the Temporal Dimension to Multi-Document Summarization. In Proc. of SIGIR’07, pages 867-868.
Wang, D. and Li, T. (2010). Document update summarization using incremental hierarchical clustering. In CIKM’10, pages 279–288.
Xu, T., Zhang, Z. M., Yu, P. S. and Long. B. (2008). Dirichlet process based evolutionary clustering. In ICDM’08. pages 648-657.
Xu, T., Zhang, Z. M., Yu, P. S., and Long. B. (2008). Evolutionary clustering by hierarchical Dirichlet process with hidden Markov state. In ICDM’08. pages 658-667.