SLEEP REGULATORY CIRCUITS IN ZEBRAFISH
Thesis by
Justin Liu
In Partial Fulfillment of the Requirements
for the Degree
of Doctor of Philosophy
CALIFORNIA INSTITUTE OF TECHNOLOGY
Pasadena, California
2015
© 2015
Justin Liu
ACKNOWLEDGMENTS
I’d first like to thank my advisor, David Prober, who afforded me the opportunity to
explore and grow as a scientist. As one of his first students, I witnessed how David built
the lab from a virtually empty room into the bustling research facility it is today. Since
we study sleep, it’s actually very quiet, but make no mistake: our videotrackers are
always running. Through it all, David has kept his door open for his students, but I
suspect he may not know just how much we appreciate his availability and concern. So
thank you, David, for investing so much time and energy on our behalf.
I also thank the members my committee: Paul Sternberg, who combines an
obvious passion for science with pragmatism and humor; Angelike Stathopoulos, who
generously shared her knowledge and was quick to suggest “smoking gun” experiments;
and Henry Lester, who has unerringly given excellent advice not just on science but on
how to succeed as a scientist.
Briefly, I would also like to acknowledge the people who mentored me before my
arrival at Caltech: Grace Rosenquist, who first taught me to be meticulous and thorough;
Kristin Ostrow, who showed me that some of the most productive research is
collaborative; Liqun Luo, who once said, “Sometimes, the correct strategy in biology is
brute force”; and Maria Spletter, who patiently introduced me to countless useful
techniques, including confocal microscopy.
During my doctoral studies, I have been fortunate that the terms “colleague” and
“friend” were often interchangeable. Every member of the Prober lab, without exception,
has helped in some way with the research in this thesis, for which I am extremely
cheerleader, and friend all at once. I would especially like to thank Wendy Chen and
Avni Gandhi for countless impromptu discussions of confusing experimental results,
moral support during late nights in lab, and our shared belief that difficult days are best
remedied with desserts and puppies. We began the journey of graduate school together
and I am certain that I would not have finished it without their friendship.
Finally, I’d like to thank Alberto Stochino and Erica Cherry-Kemmerling, who
gave their unconditional love and support despite long distances. And I want to thank my
parents, Kojam and Tai-Ying, and my sister, June, who have always encouraged me to
PREFACE
“Utnapishtim said, ‘As for you, Gilgamesh,
who will assemble the gods for your sake,
so that you may find that life for which you are searching? But if you wish,
come and put it to test: only prevail against sleep for six days and seven nights.’
But while Gilgamesh sat there resting on his haunches, a mist of sleep even now the mists of sleep are drifting over him.’”
-from the Epic of Gilgamesh
The Sumerian poem, Epic of Gilgamesh, was set in clay tablets over 4,000 years ago and is considered the first book ever written. In it, Gilgamesh, the mighty warrior
king of Uruk, seeks to learn the secret of immortality from the mystic Utnapishtim, who
reluctantly agrees to teach Gilgamesh the secret if he can first pass a strange challenge:
avoid sleeping for one week. Despite his god-like strength and unparalleled
accomplishments, Gilgamesh ultimately fails the test and is denied immortality. The
moral of this ancient tale is simple: sleep, like death, is an inescapable part of life. And no
matter how strong or resolved the hero, he will still succumb to sleep.
For a behavioral biologist like myself, the allure of sleep is both physical and
emotional. Like everyone else, I experience an uncontrollable urge to sleep, but the
mystery of why and how this urge arises is just as irresistible. Grappling with that
ABSTRACT
Sleep is widely accepted as an essential behavior for optimum mental and physical
health, yet the genetic and neural circuits that govern sleep remain poorly understood. In
this thesis, I briefly introduce the behavioral criteria that define sleep, currently known
sleep regulatory mechanisms, and the distinct advantages of the zebrafish, Danio rerio, as a simple animal model for studying sleep. I then investigate two factors previously
implicated in sleep behavior: epidermal growth factor receptor and hypocretin. First, I
show that epidermal growth factor receptor signaling is both necessary and sufficient for
normal sleep behavior in zebrafish, just as it is in invertebrates. This demonstrates that
sleep regulatory mechanisms can be conserved over large evolutionary distances, and is
the first genetic study showing that the epidermal growth factor receptor signaling is
necessary for normal sleep behavior in a vertebrate. Second, I capitalize upon the rapid
external development of zebrafish embryos to screen for developmental factors that
specify hypocretin neurons, which are known to promote arousal and consolidate
sleep/wake bouts. I identify the LIM homeobox 9 transcription factor as necessary for
hypocretin neuronal development in zebrafish and sufficient to specify additional
hypocretin neurons in both zebrafish and mice. This is the first time any factor has been
shown to induce hypocretin neurons in vivo and may be an important step towards curing narcolepsy, a debilitating sleep disorder caused by the selective loss of hypocretin
neurons. These studies deepen our understanding of how sleep is regulated at a genetic
and cellular level and underscore the potential for zebrafish to make future contributions
TABLE OF CONTENTS
Chapter 2: Epidermal Growth Factor Receptor Signaling Promotes Sleep in Zebrafish . 12 2.1 Abstract ... 13
2.2 Introduction ... 14
2.3 TGF-α overexpression increases sleep ... 15
2.4 Disruption of EGFR signaling decreases sleep ... 17
2.5 EGFR signaling modulates arousal state ... 21
2.6 EGFR inhibition suppresses TGF-α-mediated sleep ... 22
2.7 TGF-α-mediated sleep requires the MAPK/ERK pathway ... 24
2.8 TGF-α overexpression activates EGFR+ cells along the brain ventricle ... 27
2.9 tgfa expression does not cycle in a circadian manner ... 32
2.10 TGF-α-mediated sleep does not require overt circadian rhythms and is light-dependent ... 34
3.3 Microarray analysis identifies transcripts enriched in Hcrt neurons ... 52
3.4 Expression patterns of candidate genes validate the microarray results ... 58
3.5 Lhx9 is sufficient to specify Hcrt neurons ... 60
3.6 Lhx9 is necessary for Hcrt neuron specification ... 65
3.7 Lhx9 directly promotes hcrt expression ... 69
3.8 Lhx9 overexpression in mouse embryos induces Hcrt neuron specification ... 72
CHAPTER 1:
1.1Defining sleep behavior
All humans, to some extent, have an intuitive understanding of sleep. However,
sleep superficially resembles many other forms of behavioral inactivity, such as quiet wakefulness, hibernation, or coma. To distinguish between these states, sleep is defined by a set of behavioral criteria (Campbell and Tobler, 1984). First, sleep is a period of behavioral quiescence associated with reduced locomotor activity. This
quiescent state is rapidly reversible and commonly occurs during a particular phase of the circadian cycle. Second, sleep is accompanied by reduced sensory responsiveness. That is, animals require a stronger stimulus to elicit a behavioral response when asleep than when awake. Finally, sleep behavior is subject to homeostatic regulation, whereby animals prevented from sleeping must compensate for this disturbance with an additional period of sleep rebound later.
By this definition, sleep behavior has been observed in almost all animals (Siegel, 2008). The evolutionary conservation of sleep suggests that it serves some highly adaptive function, such as metabolic homeostasis (Porkka-‐Heiskanen and Kalinchuk, 2011; Xie et al., 2013), synaptic plasticity (Tononi and Cirelli, 2014), or immune system regulation (Imeri and Opp, 2009). It also suggests that the
1.2Known mechanisms of sleep behavior
therefore highly amenable to genetic manipulation. Perhaps the best-‐characterized sleep regulator is the neuropeptide hypocretin, also known as orexin. In rodents, hypocretin overexpression strongly inhibits sleep and optogenetic stimulation of hypocretin neurons increases the probability of sleep to wake transitions (Adamantidis et al., 2007; Tsujino and Sakurai, 2009). Loss of hypocretin neurons is
characterized by excessive sleepiness, fragmented sleep-‐wake bouts, and cataplexy (Dauvilliers et al., 2007). The role of hypocretin is therefore to promote and maintain periods of wakefulness. In addition to hypocretin, many other
neuropeptides modulate sleep behavior, including melanin-‐concentratin hormone, leptin, corticotropin-‐releasing hormone, and tumor necrosis factor, which all indicate that neuropeptidergic signaling through EGFR promotes sleep behavior.
Comparative studies across different animal species have clearly made
invaluable contributions to our understanding of sleep. However, further characterization and discovery of sleep regulatory mechanisms could be made using complementary model organisms, such as the zebrafish.
1.3Zebrafish as a simple animal model of sleep
The zebrafish Danio rerio presents a unique platform to study sleep behavior. Zebrafish satisfy the aforementioned criteria for sleep (Zhdanova, 2006), but unlike other model organisms are prolific, diurnal vertebrates whose offspring develop externally. A single mating pair can produce hundreds of transparent embryos, which hatch into larvae after only a few days. Larvae exhibit robust sleep behavior by four days post-fertilization (Prober et al., 2006) and are sustained by a yolk sac for the first week of development, which obviates behavioral variability introduced by feeding. Pharmacological treatment is straightforward, as small molecules added to the water are rapidly absorbed through the gills and skin. Larval zebrafish are thus superbly suited for modern genetic techniques (Jao et al., 2013), in vivo imaging experiments (Ahrens et al., 2013; Naumann et al., 2010), and high-throughput behavioral analysis (Rihel et al., 2010a; Rihel et al., 2010b).
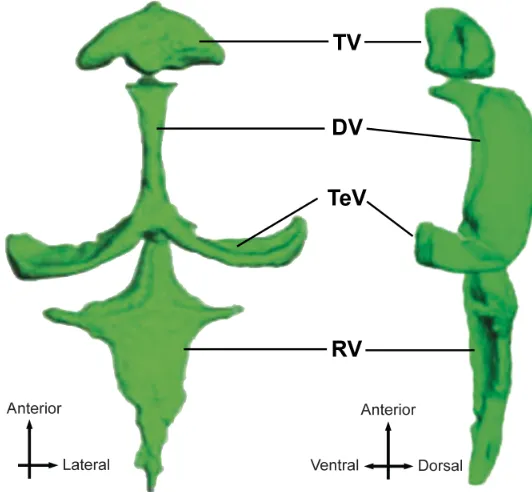
Importantly, zebrafish larvae possess many homologous neural structures involved in mammalian sleep (Chiu and Prober, 2013), including the noradrenergic locus ceruleus (Prober et al., 2006), histaminergic tuberomammilary nucleus (Kaslin and Panula, 2001), serotonergic dorsal raphe, dopaminergic ventral tegmental area and substantia nigra (McLean and Fetcho, 2004; Ryu et al., 2007), and the cholinergic basal forebrain (Guo et al.). The general neuroanatomy and ventricular system of larval zebrafish are summarized in Figure 1 and Figure 2, respectively, to orient the reader and provide a framework for the data presented in subsequent chapters.
References
Adamantidis, A. R., Zhang, F., Aravanis, A. M., Deisseroth, K. and de Lecea, L. (2007). Neural substrates of awakening probed with optogenetic control of hypocretin neurons. Nature 450, 420–424.
Ahrens, M. B., Orger, M. B., Robson, D. N., Li, J. M. and Keller, P. J. (2013). Whole-brain functional imaging at cellular resolution using light-sheet microscopy. Nat Meth 10, 413–420.
Campbell, S. S. and Tobler, I. (1984). Animal sleep: a review of sleep duration across phylogeny. Neurosci Biobehav Rev 8, 269–300.
Chiu, C. N. and Prober, D. A. (2013). Regulation of zebrafish sleep and arousal states: current and prospective approaches. Front Neural Circuits 7, 58.
Cirelli, C. (2009). The genetic and molecular regulation of sleep: from fruit flies to humans. Nat. Rev. Neurosci. 10, 549–560.
Cirelli, C., Bushey, D., Hill, S., Huber, R., Kreber, R., Ganetzky, B. and Tononi, G. (2005). Reduced sleep in Drosophila Shaker mutants. Nature 434, 1087–1092.
Dauvilliers, Y., Arnulf, I. and Mignot, E. (2007). Narcolepsy with cataplexy. The Lancet 369, 499–511.
Espinosa, F., Marks, G., Heintz, N. and Joho, R. H. (2004). Increased motor drive and sleep loss in mice lacking Kv3-type potassium channels. Genes Brain Behav 3, 90–100. Foltenyi, K., Greenspan, R. J. and Newport, J. W. (2007). Activation of EGFR and ERK by rhomboid signaling regulates the consolidation and maintenance of sleep in Drosophila. Nature Neuroscience 10, 1160–1167.
Guo, S., Wilson, S. W., Cooke, S., Chitnis, A. B., Driever, W. and Rosenthal, A. Mutations in the Zebrafish Unmask Shared Regulatory Pathways Controlling the Development of Catecholaminergic Neurons. Developmental Biology 208, 473–487. Imeri, L. and Opp, M. R. (2009). How (and why) the immune system makes us sleep. aminergic systems in zebrafish (Danio rerio). J. Comp. Neurol. 440, 342–377.
(1998). The Drosophila clock gene double-time encodes a protein closely related to human casein kinase Iepsilon. Cell 94, 97–107.
Konopka, R. J. and Benzer, S. (1971). Clock mutants of Drosophila melanogaster. Proc. Natl. Acad. Sci. U.S.A. 68, 2112–2116.
Kushikata, T., Fang, J., Chen, Z., Wang, Y. and Krueger, J. M. (1998). Epidermal growth factor enhances spontaneous sleep in rabbits. Am. J. Physiol. 275, R509–14.
McLean, D. L. and Fetcho, J. R. (2004). Ontogeny and innervation patterns of dopaminergic, noradrenergic, and serotonergic neurons in larval zebrafish. J. Comp. Neurol. 480, 38–56.
Naumann, E. A., Kampff, A. R., Prober, D. A., Schier, A. F. and Engert, F. (2010). Monitoring neural activity with bioluminescence during natural behavior. Nature Publishing Group 13, 513–520.
Porkka-Heiskanen, T. and Kalinchuk, A. V. (2011). Sleep Medicine Reviews. Sleep Medicine Reviews 15, 123–135.
Prober, D. A., Rihel, J., Onah, A. A., Sung, R. J. and Schier, A. F. (2006). Hypocretin/Orexin Overexpression Induces An Insomnia-Like Phenotype in Zebrafish. Journal of Neuroscience 26, 13400–13410.
Richter, C., Woods, I. G. and Schier, A. F. (2014). Neuropeptidergic control of sleep and wakefulness. Annu. Rev. Neurosci. 37, 503–531.
Rihel, J., Prober, D. A. and Schier, A. F. (2010a). Monitoring sleep and arousal in zebrafish. Methods Cell Biol. 100, 281–294.
Rihel, J., Prober, D. A., Arvanites, A., Lam, K., Zimmerman, S., Jang, S., Haggarty, S. J., Kokel, D., Rubin, L. L., Peterson, R. T., et al. (2010b). Zebrafish behavioral profiling links drugs to biological targets and rest/wake regulation. Science 327, 348–351.
Ryu, S., Mahler, J., Acampora, D., Holzschuh, J., Erhardt, S., Omodei, D., Simeone, A. and Driever, W. (2007). Orthopedia homeodomain protein is essential for diencephalic dopaminergic neuron development. Curr. Biol. 17, 873–880.
Saper, C. B., Scammell, T. E. and Lu, J. (2005). Hypothalamic regulation of sleep and circadian rhythms. Nature 437, 1257–1263.
Siegel, J. M. (2008). Do all animals sleep? Trends in Neurosciences 31, 208–213. Tononi, G. and Cirelli, C. (2014). Perspective. Neuron 81, 12–34.
Turner, M. H., Ullmann, J. F. P. and Kay, A. R. (2012). A method for detecting molecular transport within the cerebral ventricles of live zebrafish ( Danio rerio) larvae. The Journal of Physiology 590, 2233–2240.
Van Buskirk, C. and Sternberg, P. W. (2007). Epidermal growth factor signaling induces behavioral quiescence in Caenorhabditis elegans. Nature Neuroscience 10, 1300–1307. Xie, L., Kang, H., Xu, Q., Chen, M. J., Liao, Y., Thiyagarajan, M., O'Donnell, J., Christensen, D. J., Nicholson, C., Iliff, J. J., et al. (2013). Sleep Drives Metabolite Clearance from the Adult Brain. Science 342, 373–377.
Xu, Y., Padiath, Q. S., Shapiro, R. E., Jones, C. R., Wu, S. C., Saigoh, N., Saigoh, K., Ptacek, L. J. and Fu, Y.-H. (2005). Functional consequences of a CKIdelta mutation causing familial advanced sleep phase syndrome. Nature 434, 640–644.
CHAPTER 2:
Epidermal Growth Factor Receptor Signaling
2.1 Abstract
Epidermal growth factor receptor (EGFR) has many roles in the nervous system,
including differentiation, proliferation, and maintenance of both neurons and glia.
Genetic studies in invertebrates have also shown that EGFR signaling is necessary and
sufficient for normal sleep behavior, though comparable studies in mammals have been
inconclusive. We examined the EGFR system in zebrafish and found that overexpression
of transforming growth factor alpha (TGF-α), an EGFR ligand, increases sleep in
zebrafish larvae and activates EGFR+ cells along the brain ventricle. In contrast, TGF-α
null mutants or wild-type larvae treated with an EGFR antagonist have reduced sleep.
TGF-α-induced sleep is light dependent, and persists in the absence of overt circadian
rhythms. We conclude that EGFR signaling is necessary and sufficient for normal sleep
behavior in zebrafish. The evolutionary conservation of EGFR-mediated quiescence
across phyla suggests an ancient origin for sleep and demonstrates the utility of simple
genetic model organisms in uncovering the fundamental mechanisms that may underlie
2.2 Introduction
Sleep behavior is evolutionarily conserved across diverse animal species, suggesting that
it performs some highly adaptive function (Siegel, 2009), or may be outright necessary
for survival (Rechtschaffen et al., 1983; Shaw et al., 2002). The most parsimonious
hypothesis is that the mechanisms that drive sleep behavior are also conserved, but only a
handful of genes have been found to regulate sleep in both invertebrates and vertebrates
(Cirelli, 2009; Crocker and Sehgal, 2010). Most of these genes encode for components of
the circadian clock, neurotransmitters, or ion channels that modulate neuronal
excitability. An exception is the epidermal growth factor receptor (EGFR), a tyrosine
kinase with numerous roles in the nervous system, including neuronal and glial
differentiation, proliferation, and maintenance (Buonanno and Fischbach, 2001;
Plata-Salamán, 1991). Genetic studies in C. elegans and D. melanogaster have shown that
EGFR signaling is both necessary and sufficient for normal sleep behavior (Van Buskirk
and Sternberg, 2007; Foltenyi et al., 2007). There is also evidence that EGFR signaling is
sufficient to induce sleep in mammals (Kushikata et al., 1998). It remains unclear,
however, whether EGFR is required for normal sleep behavior in vertebrates (Kramer et
al., 2001). To elucidate the role of EGFR in sleep, we turned to the zebrafish, a prolific,
diurnal vertebrate that develops externally from parents into optically transparent larvae.
Zebrafish are particularly amenable to modern genome-editing techniques (Huang et al.,
2011; Hwang et al., 2013; Jao et al., 2013) and pharmacological treatments (Rihel et al.,
2010b), which facilitated our interrogation of the EGFR system.
2.3 TGF-α overexpression increases sleep
To test whether EGFR signaling affects sleep in zebrafish, we overexpressed the
zebrafish ortholog of transforming growth factor alpha (TGF-α), an EGFR ligand, using a
heat shock-inducible transgene: Tg(hs:tgfa). We monitored the sleep/wake behavior of
heterozygous Tg(hs:tgfa) larvae and their wild-type (WT) siblings using a
high-throughput videotracking assay (Prober et al., 2006). Prior to TGF-α overexpression, we
did not observe any difference between Tg(hs:tgfa) and WT siblings. However, after heat
shock, Tg(hs:tgfa) larvae exhibited a dramatic suppression of locomotor activity during
the daytime (Fig 1A,C) and a commensurate increase in daytime and nighttime sleep
(Fig 1B,D). The increase in sleep was due to changes in sleep architecture: TGF-α
overexpression lengthened daytime sleep bout duration by 28-43% compared to WT
controls (Table 1). However, the effect on sleep bout frequency was less clear.
Tg(hs:tgfa) larvae had more frequent sleep bouts than WT siblings on day 5 post-heat
shock, but a comparable number or even less frequent sleep bouts on subsequent days
2.4 Disruption of EGFR signaling decreases sleep
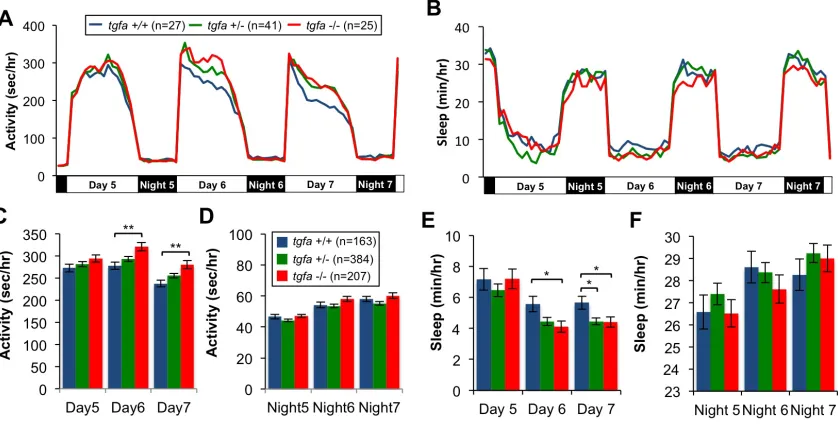
We also generated tgfa -/- zebrafish with a predicted null mutation in the TGF-α gene
(Fig. S1) and found they had the opposite sleep phenotype to that of Tg(hs:tgfa) larvae.
Compared to wild-type tgfa +/+ siblings, tgfa -/- mutant larvae had increased daytime
locomotor activity (Fig. 2A,C) and decreased daytime sleep (Fig. 2B,E). However, we
did not detect a difference between genotypes on day 5. This observation could be due to
developmental compensation in tgfa -/- mutants, or to functional redundancy between
TGF-α and other EGFR ligands, such as epidermal growth factor (EGF). To avoid these
potential confounds, we explored the numerous EGFR antagonists developed as
therapeutics for EGFR-mediated cancers. One antagonist, gefitinib, is a selective EGFR
inhibitor with a long metabolic half-life in rodents (Barker et al., 2001). We found that
WT larvae treated with 5 μM gefitinib at 4 days post fertilization (dpf) had significantly
increased locomotor activity (Fig. 3A,C,D) and decreased sleep (Fig. 3B,E) compared to
DMSO-treated controls during both day and night. The daytime sleep reduction in tgfa -/-
and gefitinib-treated larvae was primarily a result of decreased sleep bout frequency
(Table 1). In contrast, the nighttime sleep reduction in gefitinib-treated larvae was mostly
2.5 EGFR signaling modulates arousal state
To test whether the quiescence observed in Tg(hs:tgfa) larvae after heat shock satisfies
behavioral criteria for sleep (Campbell and Tobler, 1984; Zhdanova, 2006), we delivered
a mechanoacoustic tapping stimuli to Tg(hs:tgfa) larvae and WT siblings to measure
sensory responsiveness. Tg(hs:tgfa) were significantly less responsive than WT siblings
at all tapping intensities (Fig. 4A), while gefitinib-treated WT larvae showed the opposite
phenotype compared to DMSO-treated controls (Fig. 4B). These results suggest that
EGFR inhibition induces a generally heightened arousal state in zebrafish larvae, while
activation of the EGFR signaling pathway leads to a decreased arousal state.
2.6 EGFR inhibition suppresses TGF-α-mediated sleep
Mammalian TGF-α binds exclusively to EGFR but not to other members of the EGFR
tyrosine kinase family (Harris et al., 2003). We therefore hypothesized that gefitinib
treatment would block the effects of TGF-α overexpression. Indeed, Tg(hs:tgfa) larvae
treated with gefinitib were significantly more active after heat shock than DMSO-treated
Tg(hs:tgfa) siblings (Fig. 5A,C). However gefitinib-treated Tg(hs:tgfa) larvae still slept
significantly more than gefitinib-treated WT controls (Fig. 5B,D), perhaps because
gefitinib, which binds reversibly to the EGFR ATP binding site (Ward et al., 1994;
Barker et al., 2001), did not inhibit EGFR completely. We conclude that gefinitib
treatment can suppress TGF-α-mediated sleep. This result suggests that TGF-α
overexpression acts through EGFR, but should be corroborated with additional evidence,
Figure 5. EGFR antagonist treatment suppresses TGF-α-mediated sleep. (A) After heat shock, gefitinib-treated Tg(hs:tgfa) larvae were significantly more active than DMSO-treated
2.7 TGF-α-mediated sleep requires the MAPK/ERK pathway
EGFR can interact with multiple signal transduction pathways, but genetic studies in C.
elegans and D. melanogaster provide differing reports about which pathway is associated
with sleep; lethargus in C. elegans is mediated by the phospholipase C gamma
transduction pathway (Van Buskirk and Sternberg, 2007), while sleep in D. melanogaster
requires the MAPK/ERK pathway (Foltenyi et al., 2007). To test whether the
MAPK/ERK pathway is required for TGF-α-mediated sleep in zebrafish, we acutely
treated Tg(hs:tgfa) larvae with two MEK1/2 antagonists previously demonstrated to be
effective in vivo (Hong et al., 2006). Tg(hs:tgfa) larvae treated with either 3 μM SL327
(Fig. 6A-D) or 15 μM U0126 (Fig. 6E-H) were significantly more active after heat shock
than DMSO-treated Tg(hs:tgfa) larvae, though less active than their drug-treated WT
siblings. SL327 treatment significantly reduced both sleep bout frequency and duration in
Tg(hs:tgfa) larvae, while U0126 treatment only reduced sleep bout frequency (Table 2),
possibly because SL327 had a more potent effect on sleep behavior than U0126 overall
(Fig. 6D,H). Since both MEK1/2 antagonists suppressed the effect of TGF-α
overexpression, we propose that TGF-α-mediated sleep acts, at least partially, through
the MAPK/ERK pathway in zebrafish.
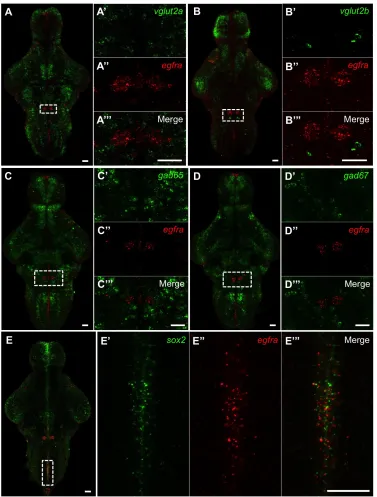
2.8 TGF-α overexpression activates EGFR+ cells along the brain ventricle
We next characterized the zebrafish EGFR system using in situ hybridization (ISH) to
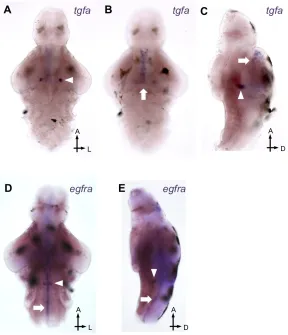
elucidate the cellular basis of TGF-α-mediated sleep. At 5 dpf, tgfa is natively expressed
in bilateral clusters in the midbrain (Fig. 7A,C arrowheads) and in cells along the
diencephalic ventricle (Fig. 7B-C, arrows). Tgfa expression was also detected in the
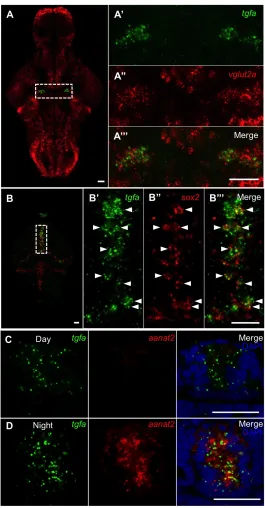
pineal gland (Fig. 8C-D). The bilateral tgfa+ cell clusters co-express vglut2a (Fig.
8A-A’’’), and are therefore likely glutamatergic in nature. In contrast, the ventricular tgfa+
cells did not express glutamatergic markers vglut1, vglut2a, or vglut2b (data not shown),
but did express sox2 (Fig. 8B-B’’’), a gene involved in cellular proliferation and
differentiation. We detected little or no expression of the GABAergic markers gad65 or
gad67 in any tgfa+ cells (data not shown).
Concurrently, egfra is expressed in bilateral clusters in the medial hindbrain (Fig.
7D-E, arrowheads), and along the entire brain ventricle, though expression is strongest
near the rhombencephalic (fourth) ventricle (Fig. 7D-E, arrows). We were unable to
detect either glutamatergic or GABAergic markers in egfra+ cells (Fig. 9A-D’’’). The
egfra+ bilateral clusters also did not express sox2, glyt2, or glial markers gfap and vim
(data not shown). However, egfra+ cells along the rhombencephalic ventricle expressed
sox2 (Fig. 9E-E’’’). Given their anatomical position and molecular profile, the tgfa+ and
egfra+ cells lining the ventricle are most likely ependymal cells, which have been shown
to express a Sox2-EGFP reporter in mice (Lee et al., 2013; Suh et al., 2007).
To determine if egfra+ cells are activated after TGF-α overexpression, we fixed
both Tg(hs:tgfa) larvae and WT siblings after heat shock and examined cfos expression
expressed cfos along the brain ventricle (Fig. 10B-C) in a pattern reminiscent of egfra
expression (Fig. 7D, arrow). Using double fluorescent ISH, we confirmed that TGF-α
overexpression induces cfos expression in egfra+ cells (Fig. 10D-D’’’). Taken together,
these results indicate that TGF-α overexpression induces sleep by activating EGFR,
which is expressed on putative ependymal cells along the brain ventricle.
Figure 8. tgfa is expressed in glutamatergic bilateral clusters, sox2+ cells along the diencephalic ventricle, and the pineal gland. (A-A’’’) Double fluorescent ISH with probes specific for tgfa and vglut2a indicates the bilateral tgfa+ clusters are glutamatergic. (B-B’’’)
tgfa+ cells along the diencephalic ventricle co-express sox2 (arrowheads), suggesting these are
Figure 9. egfra is expressed in bilateral clusters in the hindbrain and sox2+ cells along the ventricle. (A-D’’’) egfra+ cells in the hindbrain express neither glutamatergic markers vglut2a and vglut2b nor GABAergic markers gad65 and gad67 by double fluorescent ISH. (E-E’’’) The
egfra+ cells along the rhombencephalic ventricle express sox2, which suggests they might be
2.9 tgfa expression does not cycle in a circadian manner
In mice, Tgfa expression in the suprachiasmatic nucleus (SCN) has been reported to cycle
in a circadian manner (Kramer et al., 2001). We measured total levels of tgfa mRNA in 5
dpf zebrafish over a 24-hour period using quantitative reverse-transcription PCR
(qRT-PCR), but did not observe a significant change in expression (Fig. 11A). However, if tgfa
expression only cycles in a subset of all tgfa+ cells, the effect on total transcript levels
might be too small to detect by qRT-PCR. As an alternative approach, we fixed WT
zebrafish larvae every 6 hours for 18 hours and measured local levels of tgfa expression
by ISH and densitometry analysis. The bilateral clusters of tgfa+ cells showed no
significant change in expression over time (Fig. 11B-C). These results suggest that levels
2.10 TGF-α-mediated sleep does not require overt circadian rhythms and is
light-dependent
Because TGF-α overexpression induces greater behavioral changes during the day, we
hypothesized that TGF-α-mediated sleep is influenced by either the circadian clock or by
light itself. To distinguish between these possibilities, we first raised zebrafish larvae in
constant light to abolish overt circadian rhythms. Following TGF-α overexpression,
arrhythmic Tg(hs:tgfa) larvae had a significant, long-lasting reduction in locomotor
activity and a commensurate increase in sleep (Fig. 12). We then raised larvae on a
normal light/dark schedule until 4 dpf but shifted them to either constant light or constant
dark after heat shock on day 5. Tg(hs:tgfa) larvae shifted to constant light after heat shock
had significantly reduced locomotor activity and increased sleep, even during subjective
night 5 (Fig. 13A-D). In contrast, Tg(hs:tgfa) larvae shifted to constant dark behaved like
WT controls immediately after heat shock (Fig. 13E-H). If TGF-α-mediated sleep were
dependent on circadian phase, we would expect that Tg(hs:tgfa) larvae shifted to constant
dark would show reduced locomotor activity and increased sleep during subjective day 6,
when in fact the opposite was observed (Fig. 13E-H). TGF-α-mediated sleep therefore
Figure 13. TGF-α-mediated sleep is light dependent. Tg(hs:tgfa) larvae raised in normal light/dark conditions and shifted to constant light following heat shock had significantly decreased locomotor activity (A) and increased sleep (B) compared to WT larvae on day 5 post-heat shock, night 5, day 6, and night 6. Data from a single representative experiment are shown in (A-B), while the combined data from four experiments are quantified in (C-D). However,
2.11 Discussion
Using genetic and pharmacological techniques, we demonstrate that EGFR
signaling is both necessary and sufficient for normal sleep behavior in zebrafish. These
findings are consistent with previous studies in C. elegans and D. melanogaster,
suggesting that the role of EGFR in sleep is evolutionarily ancient. We also provide
insight into the cellular and molecular basis of TGF-α –mediated sleep. Specifically, we
show that TGF-α overexpression activates egfra+ cells along the brain ventricle and
requires MAPK/ERK signaling to induce sleep. We further demonstrate that TGF-α
-mediated sleep is light dependent and does not require overt circadian rhythms. However,
several ostensible differences between EGFR signaling in zebrafish and rodents merit
further discussion.
In hamsters, Tgfa mRNA expression in the SCN varies over time and
intracerebroventricular infusion of TGF-α affects the circadian timing, but not the overall
amount of sleep of animals monitored in constant dark (Kramer et al., 2001). We found
that levels of tgfa mRNA do not fluctuate in zebrafish, either globally or locally (Fig. 11).
However, zebrafish TGF-α expression might be dynamically regulated at the protein
level by proteases that cleave the membrane-bound TGF-α pro-peptide, similar to
Rhomboid/Star processing of EGFR ligands in Drosophila (Foltenyi et al., 2007). Since a
TGF-α-specific antibody has not been reported in zebrafish, we were unable to confirm
this by immunochemistry, but it may be possible to measure levels of soluble TGF-α
peptide over time through CSF extraction followed by mass spectrometry (Chang and
Sive, 2012). These experiments are ongoing. We also found that TGF-α overexpression
are nocturnal, TGF-α might promote sleep in rodents when paired with light. Indeed,
multiple rodent studies show an increase in behavioral quiescence after TGF-α infusion
under standard LD conditions (Kramer et al., 2001; Snodgrass-Belt et al., 2005; Gilbert
and Davis, 2009), but sleep after TGF-α infusion was only measured by
electroencephalography (EEG) and electromyography (EMG) in constant dark (Kramer
et al., 2001). Additional sleep EEG/EMG recordings of rodents infused with TGF-α
during LD or constant dim light are therefore required. To further elucidate the
interaction between TGF-α and circadian rhythms in zebrafish, we are currently testing
whether TGF-α overexpression affects molecular components of the circadian clock
using a period3:luciferase reporter line, and monitoring the locomotor activity of tgfa -/-
larvae entrained in LD and shifted to constant light to determine whether tgfa null
mutants have altered circadian behavior in free running conditions.
Though EGFR binds to multiple ligands in mammals (Harris et al., 2003), some
ligands, such as EGF and TGF-α, bind exclusively to EGFR and not to related tyrosine
kinase receptors. We demonstrated that genetic inactivation of TGF-α in zebrafish results
in a modest but significant decrease in daytime sleep after day 5 (Fig. 2). We also found
that treatment with the EGFR antagonist gefitinib dramatically decreased sleep during
both day and night (Fig. 3). To corroborate this effect, wedesigned a truncated form of
EGFR previously shown to act as a dominant negative in mammalian cell culture
(Kashles et al., 1991), but we were unable to demonstrate that the truncated EGFR
variant had any dominant negative activity in vivo (data not shown). Surprisingly, it is
unclear whether EGFR is required for normal sleep behavior in rodents. Behavioral
reproducible difference in locomotor activity compared to congenic littermate controls
(Mrosovsky et al., 2005; Roberts et al., 2006). Furthermore, no analysis of sleep behavior
in waved-2 mice, either by behavioral assays or EEG/EMG recording, has been reported.
This study is therefore the first demonstration that EGFR signaling is required for normal
sleep behavior in a vertebrate. We are currently testing the behavioral phenotype of
Zebrafish experiments and husbandry followed standard protocols (Westerfield, 1993) in
accordance with Caltech Institutional Animal Care and Use Committee guidelines.
Transgenic zebrafish
To generate the Tg(hs:tgfa) transgenic line, we amplified the TGF-α open reading frame
(ORF) from 5 dpf larval zebrafish cDNA using a nested PCR approach. We used outer
primers 5’-‐CGCGTGCCTTCATCTTTATT-3’, 5’-TCCCACTGCCCATATTGAAC-3’
and inner primers 5’-ATATCCCGGGCCACCATGATGTATCGTGCTTTTTGG-3’,
5’-GGCGTCTAGATCAAACCACTGTTTCTGAGTTAC-3’. The entire TGF-α ORF
was subcloned downstream of a heat shock induciblepromoter (Halloran et al., 2000) in a
the Tg(hs:tgfa) overexpression plasmid with I-SceI endonuclease into zebrafish embryos
at the 1-cell stage, raised the injected larvae, and screened their offspring for transgenic
insertions by ISH.
To generate TGF-α loss-of-function mutants, we used plasmids obtained from
Addgene to create TALENs (Reyon et al., 2012) that recognize the following sites:
5’-TGATGTATCGTGCTTT-3’ and 5’-TTCTCACCGGTGAGTACA-3’. We isolated a
mutant line with a 7 bp deletion (ORF nucleotides 25-31: 5’-ACAATAT-3’) that shifts
the reading frame after the eighth amino acid and introduces an early stop codon
downstream, truncating the pro-peptide from 189 to 61 amino acids in length (Fig. S1).
The mutant TGF-α pro-peptide is predicted to lack essential features, including the signal
peptide, protease cleavage sites, and the epidermal growth factor-like domain (Harris et
al., 2003).
The EGFR dominant negative was designed to include the entire N-terminal and
transmembrane domains, but a severely shortened C-terminal domain, as described
previously (Kashles et al., 1991). We first amplified the complete EGFR ORF from 5 dpf
larval cDNA by nested PCR, using the primers 5’-ACAAAGCCTGGAACGAAGAG-3’,
5’-CCACTGGTCTAAAATAAGGTCATAAA-3’, and
5’-‐CCGATAGCTTACAAACG-CAAA-3’, 5’-TAAGGTCAAATGTGAACACCTGAAT-3’. We isolated a 3756 bp band
by gel purification and amplified the EGFR dominant negative fragment with the primers
5’-ATATCCCGGGCCACCATGGCAGGACCAACTGAAATC-3’ and
5’-‐GGCGTCT-AGACTACCTCCGGATGTGGCG-3’. The EGFR dominant negative coding sequence
was subcloned into the same overexpression vector as the Tg(hs:tgfa) plasmid and
Behavioral experiments
Videotracker behavioral experiments were performed as previously described (Gandhi et
al., 2015; Rihel et al., 2010a). Larvae were raised at 28.5°C with 14 h of light and 10 h
darkness until at least 4 days post fertilization. Individual larvae were loaded into the
wells of a 96-well plate (7701-1651, Whatman) and sealed with a transparent adhesive
film (4311971, Applied Biosystems) to prevent evaporation. Plates were not sealed if
drug or DMSO controls were added. Each 96-well plate was continuously monitored by
infrared camera in a custom Zebrabox videotracker (Viewpoint Life Sciences)
illuminated with infrared and visible light LEDs and held at a temperature between
28.5-29.5°C by recirculated water. Animals were allowed to acclimate to videotracker
conditions one night; behavioral activity was scored onwards. To administer heat shock,
plates were removed from the videotracker and immersed in a 37°C water bath for 1 h.
For drug experiments, gefitinib (13166, Cayman Chemical), SL327 (1969, Tocris
Bioscience), and U0126 (1144, Tocris Bioscience) were dissolved in DMSO and diluted
in E3 embryo medium to 5 μM, 3 μM, and 15 μM concentrations, respectively. Identical
concentrations of DMSO were administered as a negative vehicle control in the same
96-well plate. After dissolving in DMSO, unused U0126 or gefitinib can be aliquoted and
stored in the dark at -20°C, but SL327 should be used immediately. All drugs were
initially tested across a broad range of concentrations to ensure the administered dosage
was below toxic levels.
Behavioral data were analyzed using custom PERL and Matlab (version R2014a,
as a period of one or more minutes with less than 0.1 sec of movement, after which larvae
have an increased arousal threshold (Prober et al., 2006). Since many behavioral
parameters are not normally distributed, we used a non-parametric Mann-Whitney U test,
also known as the Wilcoxon rank-sum test, to determine whether two groups were
significantly different, and one- or two-way ANOVA to test for differences between three
or more groups. All statistical tests were performed using Prism 6 (GraphPad).
Arousal threshold assay
The arousal threshold assay was performed as described previously (Gandhi et al., 2015).
Tg(hs:tgfa) or gefitinib-treated WT larvae were loaded into a 96-well plate on day 5 and
placed in a modified videotracker. To induce TGF-α overexpression, the plate of
Tg(hs:tgfa) larvae was immersed in a 37°C water bath for 1 h and allowed to recover at
28.5C for 2-3 h before entering the videotracker. An automated solenoid driver delivered
taps to the plate from 12:30 am to 7:30 am on night 5 at 1 min intervals. Fourteen
different tapping intensities were delivered randomly, with 30 trials at each intensity. The
response of larvae to stimuli was monitored using the videotracking software and
subsequently analyzed in Matlab, Excel, and Prism 6.
In situ hybridization (ISH)
Samples were fixed in 4% paraformaldehyde for 12-16 h at room temperature. ISH was
performed using digoxigenin (DIG)- or 2,4-dinitrophenol (DNP)-labeled antisense
riboprobes as previously described (Thisse and Thisse, 2008), except all samples were
ImagerM1 microscope. Fluorescent ISH was performed using the TSA Plus DNP System
(PerkinElmer). Fluorescent images were acquired on an upright Zeiss LSM 780 confocal
microscope and analyzed using Fiji (Schindelin et al., 2012).
Quantitative reverse-transcription PCR (qRT-PCR)
We raised WT larvae on a normal 14:10 h light:dark schedule until 6am on day 5. Total
RNA was isolated using Trizol reagent (15596-026, Life Technologies) from three
biological replicates (25 larvae each), collected every 6 hours for 42 hours. We then
generated cDNA (Superscript III First-Strand Synthesis System, Invitrogen) and
amplified transcripts using SYBR green master mix (4364346, Life Technologies).
Transcripts of tgfa were amplified with primers 5’-GTGTGTGGTGGGCAGTGTC-3’
and 5’-CCAACAGGAGAGGGTGTGAC-3’, while the eef1a reference gene was
amplified with 5’-CAGCTGATCGTTGGAGTCAA-3’ and
5’-TGTATGCGCTGACTT-CCTTG-3’. Each qRT-PCR reaction was run in triplicate on an ABI PRISM 7900HT
Sequence Detection System (Applied Biosystems). Relative fold-change in expression
was calculated using the 2−ΔΔCt
References
Barker, A. J., Gibson, K. H., Grundy, W., Godfrey, A. A., Barlow, J. J., Healy, M. P., Woodburn, J. R., Ashton, S. E., Curry, B. J., Scarlett, L., et al. (2001). Studies leading to the identification of ZD1839 (IRESSA): an orally active, selective epidermal growth factor receptor tyrosine kinase inhibitor targeted to the treatment of cancer. Bioorg. Med. Chem. Lett. 11, 1911–1914.
Buonanno, A. and Fischbach, G. D. (2001). Neuregulin and ErbB receptor signaling pathways in the nervous system. Curr. Opin. Neurobiol. 11, 287–296.
Campbell, S. S. and Tobler, I. (1984). Animal sleep: a review of sleep duration across
Crocker, A. and Sehgal, A. (2010). Genetic analysis of sleep. Genes & Development 24, 1220–1235.
Foltenyi, K., Greenspan, R. J. and Newport, J. W. (2007). Activation of EGFR and ERK by rhomboid signaling regulates the consolidation and maintenance of sleep in Drosophila. Nature Neuroscience 10, 1160–1167.
Gandhi, A. V., Mosser, E. A., Oikonomou, G. and Prober, D. A. (2015). Melatonin is required for the circadian regulation of sleep. Neuron.
Gilbert, J. and Davis, F. C. (2009). Behavioral effects of systemic transforming growth factor-alpha in Syrian hamsters. Behav. Brain Res. 198, 440–448.
Halloran, M. C., Sato-Maeda, M., Warren, J. T., Su, F., Lele, Z., Krone, P. H., Kuwada, J. Y. and Shoji, W. (2000). Laser-induced gene expression in specific cells of transgenic zebrafish. Development 127, 1953–1960.
Harris, R. C., Chung, E. and Coffey, R. J. (2003). EGF receptor ligands. Exp. Cell Res. 284, 2–13.
Hong, C. C., Peterson, Q. P., Hong, J.-Y. and Peterson, R. T. (2006). Artery/vein specification is governed by opposing phosphatidylinositol-3 kinase and MAP kinase/ERK signaling. Curr. Biol. 16, 1366–1372.
Huang, P., Xiao, A., Zhou, M., Zhu, Z., Lin, S. and Zhang, B. (2011). Heritable gene targeting in zebrafish using customized TALENs. Nature Publishing Group 29, 699–700.
T., Yeh, J.-R. J. and Joung, J. K. (2013). Efficient genome editing in zebrafish using a CRISPR-Cas system. Nat. Biotechnol. 31, 227–229.
Jao, L.-E., Wente, S. R. and Chen, W. (2013). Efficient multiplex biallelic zebrafish genome editing using a CRISPR nuclease system. Proc. Natl. Acad. Sci. U.S.A. 110, 13904–13909.
Kashles, O., Yarden, Y., Fischer, R., Ullrich, A. and Schlessinger, J. (1991). A dominant negative mutation suppresses the function of normal epidermal growth factor receptors by heterodimerization. Mol. Cell. Biol. 11, 1454–1463.
Kramer, A., Yang, F. C., Snodgrass, P., Li, X., Scammell, T. E., Davis, F. C. and Weitz, C. J. (2001). Regulation of daily locomotor activity and sleep by hypothalamic EGF receptor signaling. Science 294, 2511–2515.
Kushikata, T., Fang, J., Chen, Z., Wang, Y. and Krueger, J. M. (1998). Epidermal growth factor enhances spontaneous sleep in rabbits. Am. J. Physiol. 275, R509–14.
Lee, H. J., Wu, J., Chung, J. and Wrathall, J. R. (2013). SOX2 expression is upregulated in adult spinal cord after contusion injury in both oligodendrocyte lineage and ependymal cells. J. Neurosci. Res. 91, 196–210.
Mrosovsky, N., Redlin, U., Roberts, R. B. and Threadgill, D. W. (2005). Masking in waved-2 mice: EGF receptor control of locomotion questioned. Chronobiol. Int. 22, 963– 974.
Plata-Salamán, C. R. (1991). Epidermal growth factor and the nervous system. Peptides 12, 653–663.
Prober, D. A., Rihel, J., Onah, A. A., Sung, R. J. and Schier, A. F. (2006). Hypocretin/Orexin Overexpression Induces An Insomnia-Like Phenotype in Zebrafish. Journal of Neuroscience 26, 13400–13410.
Rechtschaffen, A., Gilliland, M. A., Bergmann, B. M. and Winter, J. B. (1983). Physiological correlates of prolonged sleep deprivation in rats. Science 221, 182–184.
Reyon, D., Khayter, C., Regan, M. R., Joung, J. K. and Sander, J. D. (2012). Engineering designer transcription activator-like effector nucleases (TALENs) by REAL or REAL-Fast assembly. Curr Protoc Mol Biol Chapter 12, Unit 12.15.
Rihel, J., Prober, D. A. and Schier, A. F. (2010a). Monitoring sleep and arousal in zebrafish. Methods Cell Biol. 100, 281–294.
Rihel, J., Prober, D. A., Arvanites, A., Lam, K., Zimmerman, S., Jang, S., Haggarty, S. J., Kokel, D., Rubin, L. L., Peterson, R. T., et al. (2010b). Zebrafish behavioral profiling links drugs to biological targets and rest/wake regulation. Science 327, 348–351.
D. W. (2006). Wildtype epidermal growth factor receptor (Egfr) is not required for daily locomotor or masking behavior in mice. J Circadian Rhythms 4, 15.
Schindelin, J., Arganda-Carreras, I., Frise, E., Kaynig, V., Longair, M., Pietzsch, T., Preibisch, S., Rueden, C., Saalfeld, S., Schmid, B., et al. (2012). Fiji: an open-source platform for biological-image analysis. Nat Meth 9, 676–682.
Schmittgen, T. D. and Livak, K. J. (2008). Analyzing real-time PCR data by the comparative CT method. Nat Protoc 3, 1101–1108.
Shaw, P. J., Tononi, G., Greenspan, R. J. and Robinson, D. F. (2002). Stress response genes protect against lethal effects of sleep deprivation in Drosophila. Nature 417, 287– 291.
Siegel, J. M. (2009). Sleep viewed as a state of adaptive inactivity. Nat. Rev. Neurosci. 10, 747–753.
Snodgrass-Belt, P., Gilbert, J. L. and Davis, F. C. (2005). Central administration of transforming growth factor-alpha and neuregulin-1 suppress active behaviors and cause weight loss in hamsters. Brain Research 1038, 171–182.
Suh, H., Consiglio, A., Ray, J., Sawai, T., D'Amour, K. A. and Gage, F. H. (2007). In vivo fate analysis reveals the multipotent and self-renewal capacities of Sox2+ neural stem cells in the adult hippocampus. Cell Stem Cell 1, 515–528.
Thisse, C. and Thisse, B. (2008). High-resolution in situ hybridization to whole-mount zebrafish embryos. Nat Protoc 3, 59–69.
Van Buskirk, C. and Sternberg, P. W. (2007). Epidermal growth factor signaling induces behavioral quiescence in Caenorhabditis elegans. Nature Neuroscience 10, 1300–1307.
Ward, W. H., Cook, P. N., Slater, A. M., Davies, D. H., Holdgate, G. A. and Green, L. R. (1994). Epidermal growth factor receptor tyrosine kinase. Investigation of catalytic mechanism, structure-based searching and discovery of a potent inhibitor. Biochem. Pharmacol. 48, 659–666.
Westerfield, M. (1993). The Zebrafish Book. A guide for the laboratory use of zebrafish (Danio rerio). 4th edn. Eugene, OR: University of Oregon Press.
Supplemental Figures
CHAPTER 3:
3.1Abstract
Loss of neurons that express the neuropeptide hypocretin (Hcrt) has been implicated in
narcolepsy, a debilitating disorder characterized by excessive daytime sleepiness and
cataplexy. Cell replacement therapy using Hcrt-expressing neurons generated in vitro is a
potentially useful therapeutic approach, but factors sufficient to specify Hcrt neurons are
unknown. Using zebrafish as a high-throughput system to screen for factors that can
specify Hcrt neurons in vivo, we identified the LIM homeobox transcription factor Lhx9
as necessary and sufficient to specify Hcrt neurons. We found that Lhx9 can directly
induce hcrt expression and identified two potential Lhx9 binding sites in the zebrafish
hcrt promoter. Akin to its function in zebrafish, we found that Lhx9 is sufficient to
specify Hcrt-expressing neurons in the developing mouse hypothalamus. Our results
elucidate an evolutionarily conserved role for Lhx9 in Hcrt neuron specification that
improves our understanding of Hcrt neuron development and may enable a novel
3.2Introduction
The hypocretin (Hcrt, also known as orexin) neuropeptide is conserved among
vertebrates and plays key roles in regulating sleep, metabolism, feeding, anxiety, reward,
and addiction (Bonnavion and Lecea, 2010; Tsujino and Sakurai, 2009). Hcrt is
particularly important in promoting arousal, as the loss of Hcrt neurons is thought to
cause narcolepsy (Peyron et al., 2000; Thannickal et al., 2000), a disorder characterized
by daytime sleepiness, fragmented sleep-wake states, and cataplexy. Narcolepsy affects
approximately 1 in 2,000 individuals, but treatments are limited to symptom management
(Dauvilliers et al., 2007). Despite the importance of the Hcrt system, little is known about
the developmental processes that give rise to Hcrt neurons. A recent study found that
mice lacking the LIM domain homeobox transcription factor Lhx9 had fewer Hcrt
neurons (Dalal et al., 2013), suggesting that Lhx9 is required to specify a subset of Hcrt
neurons. However, overexpression of Lhx9 in adult mice or in a mouse neuroblastoma
cell line had no effect on Hcrt cell number or expression. Therefore, the role of Lhx9 in
Hcrt neuron specification remains unclear and the set of factors sufficient to specify Hcrt
neurons remains unknown. Identifying these factors would help elucidate how a key
neural circuit that governs sleep is established, and could lead to novel therapies
for narcolepsy.
The zebrafish Danio rerio is a powerful genetic model of vertebrate development
that provides several advantages for studying Hcrt neuron specification. First, the
hypothalamus is remarkably conserved (Blackshaw et al., 2010; Machluf et al., 2011;
Tessmar-Raible et al., 2007), suggesting that developmental mechanisms identified in
mammalian Hcrt system is functionally and anatomically conserved in zebrafish (Chiu
and Prober, 2013; Elbaz et al., 2013). But while the rodent hypothalamus contains
thousands of Hcrt neurons, larval and adult zebrafish contain only approximately 10 and
40 Hcrt neurons, respectively (Faraco et al., 2006; Kaslin et al., 2004), making zebrafish
a more tractable system to study Hcrt neuron development. Second, the external
development and transparency of zebrafish embryos facilitate the observation of
developing Hcrt neurons. Third, high-throughput genetic gain- and loss-of-function
assays allows for efficient screens to identify developmental regulators. We exploited
these features of zebrafish to identify genes that regulate Hcrt neuron specification.
3.3Microarray analysis identifies transcripts enriched in Hcrt neurons
Previous studies showed that the number of Hcrt neurons in zebrafish and rodents
increases as animals develop and mature to adulthood (Faraco et al., 2006; Kaslin et al.,
2004; Sawai et al., 2010). We reasoned that cell-autonomous factors required to specify
Hcrt neurons might still be expressed in Hcrt neurons shortly after they are specified. To
identify these factors, we generated transgenic zebrafish that express monomeric red
fluorescent protein (mRFP) in Hcrt neurons and enhanced green fluorescent protein
(EGFP) in neurons that express the hypothalamic neuropeptide QRFP (Fig. S1). QRFP
has been implicated in regulating locomotor activity (Takayasu et al., 2006), feeding
(Chartrel et al., 2003; Takayasu et al., 2006), and nociception (Yamamoto et al., 2009) in
rodents, and sleep/wake behaviors in zebrafish (C. Chiu, A. Chen and D. Prober,
Expression of hcrt and qrfp (si:ch211-185o22.2, incorrectly annotated as
lincRNA) is first detected in zebrafish embryos at 24 hours post-fertilization (hpf) in
bilateral hypothalamic nuclei of 4-6 cells (Fig. 1A,B), which expand to 10-15 cells by
120 hpf (Fig. 1C,D). Hcrt and QRFP are expressed in neighboring neurons throughout
development, but are never co-expressed within the same cells (Fig. 1B,D). To identify
genes with enriched expression in Hcrt neurons, we dissociated pools of 100-300
Tg(hcrt:mRFP, qrfp:EGFP) embryos at 26 hpf into single cells and isolated EGFP- and
mRFP-expressing neurons by fluorescence activated cell sorting (FACS) (Fig. 1E, S2).
FACS gates for EGFP and mRFP populations were set using wild-type embryos
(0/10,000 EGFP+ or mRFP+ events). In a representative experiment, we obtained 250
EGFP+ cells and 528 mRFP+ cells from 150 Tg(hcrt:mRFP, qrfp:EGFP) double
heterozygous embryos. To verify the fidelity of FACS, we visually screened for
fluorescence in sorted cells (Fig. 1F). In the sorted qrfp:EGFP population, we observed
EGFP in 99/117 cells (85%) but no mRFP (0/117). In the sorted hcrt:mRFP population,
we observed mRFP in 110/146 cells (75%) but no EGFP (0/146). These values likely
underestimate the purity of the sorted cells because FACS is more sensitive than
visual inspection.
We extracted total mRNA from each cellular fraction and used cDNA
microarrays to compare gene expression in Hcrt and QRFP neurons. We also compared
gene expression in Hcrt neurons to expression in neurons labeled by a pan-neuronal
marker, Tg(elavl3:EGFP), and to expression in subtypes of sensory neurons:
Figure 1. Isolation of hcrt- and qrfp-expressing neurons from zebrafish embryos. (A-D) hcrt
encodes an RNA binding protein that is expressed in most post-mitotic neurons (Park et
al., 2000). trpa1b encodes a transient receptor potential (TRP) channel that is activated by
chemical irritants (Prober et al., 2008). p2rx3b encodes an ATP-gated ion channel in
non-peptidergic nociceptors (Kucenas et al., 2006). islet1 (isl1) encodes a LIM/homeobox
transcription factor that is expressed in sensory neurons and motoneurons (Higashijima et
al., 2000). We used an isl1 enhancer that drives expression in a subset of sensory neurons
(Sagasti et al., 2005). The Tg(trpa1b:EGFP) and Tg(isl1:Gal4VP16, 14xUAS:EGFP)
lines express EGFP in largely non-overlapping subsets of trigeminal and Rohon-Beard
sensory neurons (Pan et al., 2012). p2rx3b is expressed in all cells labeled in
Tg(trpa1b:EGFP) embryos and in a quarter of cells labeled in Tg(isl1:Gal4VP16,
14xUAS:EGFP) embryos. These samples allowed five separate pairwise comparisons of
Hcrt neurons with different purified neuron populations (Fig. S2), which provided our
study with greater statistical power than previous studies that compare Hcrt neurons to a
single outgroup (Cvetkovic-Lopes et al., 2010; Dalal et al., 2013). An additional study
examined changes in gene expression across multiple brain regions after the onset of
narcolepsy (Honda et al., 2009); however, this approach is unlikely to identify
developmentally-relevant transcripts. We focused on 19 highly ranked genes that encode
transcription factors or secreted proteins (Table 1, Table 2), as both classes of proteins
have well-established roles in neural development (Blackshaw et al., 2010; Wilson and
Houart, 2004). As expected, hcrt was the most highly enriched gene in Hcrt neurons
(Table 2). The complete microarray dataset is available through ArrayExpress, accession
Table 1. Transcription factors enriched in Hcrt neurons.
sox1a NM_001002483 70 Yes Hypothalamus, telencephalon, hindbrain, lens, lateral line
Yes
nr4a2 NM_001002406 36 Yes Telencephalon, hindbrain No
mybbp1a NM_001002042 25 Yes
cited2 NM_001044982 14 No Hypothalamus,
telencephalon, hindbrain Yes
*Fold increase indicates the expression level of a gene in Hcrt neurons relative to its expression in the other
neuronal subtypes analyzed by microarray.
Table 2. Secreted proteins enriched in Hcrt neurons.
cart4 NM_001082932 130 No Hypothalamus, ventral
hindbrain Yes
igsf21 NM_001034184 85 Yes Hypothalamus, ventral
hindbrain Yes
trh NM_001012365 45 No Hypothalamus, ventral
hindbrain Yes
3.4Expression patterns of candidate genes validate microarray results
High quality in situ hybridization (ISH) images were available in the ZFIN database for 7
candidate genes (Fig. S3). We determined the expression patterns of the remaining 12
genes using ISH on 24 hpf embryos (Fig. 2, S3). We found that 11 of 14 genes encoding
transcription factors and 5 of 5 genes encoding secreted proteins are expressed in a
similar or overlapping domain to Hcrt neurons. Some genes, such as the transcription
factor lhx9, are expressed in all Hcrt cells throughout early development (Fig. S4). The
Figure 2. Examples of expression patterns of Hcrt neuron-enriched genes. (A, C, E) ISH performed on 24 hpf embryos using probes specific for hcrt, hmx2, and lhx9. (B, D, F) A 1.25 μm confocal section of fluorescent ISH (red) and hcrt:EGFP immunofluorescence(green). All
hcrt:EGFP neurons express hmx2 and lhx9. hmx2 expression extends ventrally (C, D) and
lhx9 is expressed in broader domains of the telencephalon and diencephalon (E, F), as well as the hindbrain and spinal cord (not shown). (G) Mean ± s.e.m. number of cells in white boxed regions in (A,C,E). n indicates number of brains. Scale = 10 μm.
3.5 Lhx9 is sufficient to specify Hcrt neurons
To determine whether any candidate gene is sufficient to induce specification of Hcrt
neurons, we cloned each gene downstream of a heat shock inducible promoter in a vector
containing Tol2 transposase sites, and injected the plasmid together with tol2 transposase
mRNA into zebrafish embryos at the 1-cell stage. As a result, the plasmid inserts into the
genome of a random subset of cells. We transiently overexpressed each gene by
performing a heat shock at 24 hpf (Fig. 3A). This approach provides an efficient,
inducible method for overexpressing different candidate genes in 10-20% of cells (Fig.
3C). Quantification of hypothalamic Hcrt neurons using ISH at 120 hpf showed no
significant differences between larvae overexpressing candidate genes and controls (Fig.
S5). However, 14% of larvae overexpressing lhx9 contained additional, ectopic Hcrt
expression in the medial hindbrain (7/50 larvae, Fig. 3E,F). These larvae had 2.7 ectopic
Hcrt cells on average, a 17% increase in the total number of Hcrt neurons. No other
candidate gene was sufficient to specify ectopic Hcrt neurons. Like endogenous
hypothalamic Hcrt neurons, ectopic Hcrt neurons expressed vesicular glutamate
transporter 1 (vglut1) and prodynorphin (pdyn) (Fig. 4). vglut1 is widely expressed in the
hypothalamus and hindbrain; however, its expression is particularly strong in Hcrt
neurons (Fig. 4A,B). Hcrt neurons also exhibit intense, punctate pdyn labeling (Fig.
4D,E) that likely indicates sites of transcription (Hanisch et al., 2012; Kosman et al.,
2004). We did not detect significant expression of vglut2a or vglut2b in Hcrt neurons
(Figs S8, S9). lhx9 overexpression generated more cells in the medial hindbrain with
strong vglut1 expression or punctate pdyn expression than ectopic Hcrt cells (Fig. 4C, F),
Figure 3. Transient lhx9 overexpression induces ectopic Hcrt neurons. (A) Zebrafish embryos were injected with tol2 transposase mRNA and a plasmid in which a heat shock (HS)-inducible promoter regulates the expression of a candidate gene (hs:gene x). (B, C) Anterior views of 26 hpf embryos after ISH show endogenous hcrt expression (B) and mosaic expression of gene x one hour after heat shock (C). Approximately 10-20% of cells overexpress gene x. White box in (B,C) indicates the hypothalamus. (D) Control embryos injected with a hs:EGFP
Figure 4. Hypothalamic and ectopic Hcrt neurons share biomarkers. Confocal projections of 120 hpf Tg(hcrt:EGFP) larval brains containing endogenous and ectopic Hcrt neurons labeled with an anti-EGFP antibody and fluorescent ISH probes specific for vglut1 (A,B) and pdyn