Optimization of Process Parameters in Machining of Alloy
Steel Using Nano Fluids
A.Venkata Vishnu
1, Jijo Sam
2, K Praveen kumar
3, D Praveen
4, B Vishnu
5, G Aravind
6Asst.Professor1, Asst.Professor 2 ,Asst.Professor,3 ,Asst.Professor,4 ,Asst.Professor,5 ,Asst.Professor,6 1Department of Mechanical Engineering, NNRG, Hyd, Telangana, India Student, Department of Mechanical
Engineering, NNRG, Hyd, Telangana, India
Abstract
In machining process a lot of heat is developed due to the friction between tool and work piece, which will potentially damage the cutting tools as well as the work piece. To reduce the friction, heat transfer between tool and workpiece and to remove metal particles away from the cutting zone normally lubricants/cutting fluids are employed in metal cutting industries during machining operation. The objective of the present paper is to find out the set of optimal conditions for the selected process parameters, using a nano fluid. Taguchi method is used to determine the optimum cutting parameters viz. cutting speed, feed rate, depth of cut and type of tool at three different levels. The experiments are carried out using L9 (34)
orthogonal array and the work piece selected is Alloy Steel. Nano fluids have novel properties that make them potentially useful in heat transfer medium at cutting zone.
Keyword:
- Nano Fluid, Taguchi Method, Alloy steel, Turning cutting speed, feed rate, depth of cut and type of tool,etc.
1.
INTRODUCTION:Application of Nano fluid lubrication in cutting has proved to be feasible alternative to cutting fluids, if it can be applied properly. If the friction at the machining zone can be minimized by providing effective lubrication, the heat generated can be reduced to some extent. If a suitable lubricant can be successfully applied in the machining zone, it leads to process improvement. Several studies related to the lubrication properties of Nano fluids are carried out over the past several decades. The growing demand for higher productivity, product quality and overall economy in manufacturing by machining, insists high material removal rate and high stability and long life of the cutting tools. But machining with high cutting velocity, feed rate and depth of cut is inherently associated with generation of large amount of heat and high cutting temperature. Such high cutting temperature not only reduces dimensional accuracy and tool life but also impairs the surface integrity of the product by inducing tensile residual stresses, surface and subsurface micro-cracks in addition to rapid oxidation and corrosion.
2.
EXPERIMENTAL SETUP:
The Literature survey helped in proper selection of the material and suitable method [1-8]. Taguchi Robust Design Methodology is used to determine the optimum conditions for the selected control parameters. Orthogonal Array and Signal to Noise
Ratio are employed to study the performance characteristics for the selected process parameters. The turning operations (facing) are carried out on CNC lathe at Balanagar, Hyderabad and the machine used is WASINO LJ-63m CNC Turning Machine shown in fig.no.1.
2.1. Selection of Work Material:-
2.2. Selection of Insert:
[image:2.612.299.500.211.398.2]The cutting inserts used for machining are VNMG, TNMG and CNMG carbide tools of KORLEY Company, which are Gold coated,and uncoated Carbide tools.
Fig. No: 1 CNC Lathe Fig. No. 2: EN353 Alloy Steel
Fig. No. 3 Rockwell hardness machine
2.3. Selection of Lubricant
Selection of cutting fluid is important in order to maintain better tool life, less cutting forces, lower power consumption, high machining accuracy and better surface integrity etc. Here Nano fluid, is used as cutting fluid under .
2.4. Preparation of Nano Fluids
In the present work Boric acid (H3BO3) Nano particles are
mixed with water, as a base fluid used is water, to make H3BO3
Nanofluid. Five grams of H3BO3, Nano particles and directly
3. EXPERIMENTAL DESIGN
The four control factors Cutting Speed (A), Feed Rate (B) andDepth Of Cut(C) and type of tool(D) are selected with three levels and the corresponding orthogonal array L9
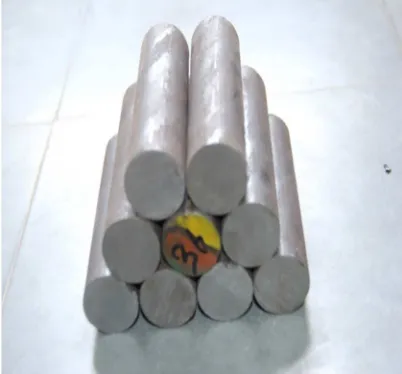
(34) is chosen and are tabulated in Table No.2. Alloy Steel bars
of 32mm diaX200mm length are prepared for conducting the experiment. Using different levels of the
Process parameters as per the experimental design shown in table no.2, the specimens have been machined using conventional lathe accordingly; the Hardness of the material is measured precisely.
Table No. 1: Control Factors & Levels for Flooded
Factors Speed (A) Feed (B) Depth Of Cut (C)
Type of tools (D)
/Levels (rpm) (mm/min) (mm)
1 1000 0.1 0.1 T-I
2 1500 0.2 0.3 T-II
[image:3.612.66.517.372.676.2]3 2000 0.3 0.5 T-III
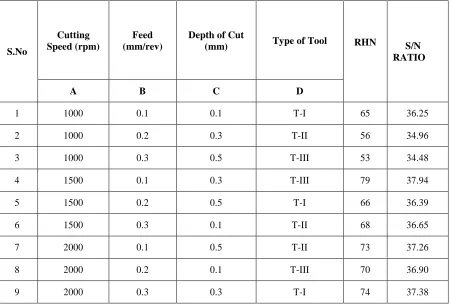
Table No. 2. Experimental Design with corresponding results & S/N ratios
S.No
Cutting Speed (rpm)
Feed (mm/rev)
Depth of Cut
(mm) Type of Tool RHN S/N
RATIO
A B C D
1 1000 0.1 0.1 T-I 65 36.25
2 1000 0.2 0.3 T-II 56 34.96
3 1000 0.3 0.5 T-III 53 34.48
4 1500 0.1 0.3 T-III 79 37.94
5 1500 0.2 0.5 T-I 66 36.39
6 1500 0.3 0.1 T-II 68 36.65
7 2000 0.1 0.5 T-II 73 37.26
8 2000 0.2 0.1 T-III 70 36.90
9 2000 0.3 0.3 T-I 74 37.38
4. RESULTS & DISCUSSIONS:
Hardness is a characteristic of a material, not a fundamental physical property. It is defined as the
simply put, when using a fixed force (load) and a given indenter, the smaller the indentation, the harder the material.
Hardness is measured precisely with the help of a Rockwell hardness tester equipment and the results are tabulated in table no 2. For each experiment the corresponding S/N values are also tabulated. Optimization of Hardness is carried out using Taguchi method. Confirmatory test have also been conducted to validate optimal results.
The best condition for cutting speed is level 3 (37.18), for feed is level 1 (37.15), for depth of cut is level 2 (36.76) and type of tool is level 1 (36.67). Thus, the optimum conditions chosen were: A3-B1-C2-D1. A confirmation test is performed with the obtained optimum cutting, the Hardness is measured and the S/N ratio is calculated for the flooded condition. The conformation test results are tabulated in the table no 5.
Table No 3: Summary of S/N Ratios for flooded
Factor Level 1 Level 2 Level 3
Speed(A) 36.38 36.99 37.18
Feed(B) 37.15 36.08 36.17
Depth of Cut(C) 36.6 36.76 36.04
[image:4.612.75.481.618.696.2]Type of tool(D) 36.67 36.29 36.49
Table No 4: Optimum Set of Control Factors for flooded condition
Factors /Levels Speed (A) Feed (B) Depth Of Cut(C) Type of tool (D)
(rpm) (mm/min) (mm)
Optimum Value 2000 0.1 0.3 T-I
From table no. 4 the following calculations are done, for all the cases the predicted value is calculated in the same procedure.
ηpredicted= Y+ (A3-Y) + (B1-Y) + (C2-Y) + (D1-Y)
= A3+B1+C2+D1-3Y
= [(37.18) + (37.15) + (36.76) + (36.67)] – [3X (36.46)]
ηpredicted= 38.38
Therefore, the predicted average for optimum condition of hardness is 38.38.
5.
CONCLUSIONS
:
A confirmation test is performed with the obtained optimum cutting parameters for cutting speed is level 3 (37.18), for feed is level 1 (37.15), for depth of cut is level 2 (36.76) and type of tool is level 1 (36.67). The
Hardness value is measured and the S/N ratio is calculated for this condition. The conformation test and the predicted values are tabulated in the table no 5 & 6.
Hardness Values S/N RATIO
76 37.62
Table No 5: Conformation Test Results
η predicted 38.38
The objective of the present paper is to find out the set of optimum conditions in order to improve Hardness, using Taguchi methodology considering the turning parameters for the Alloy Steel material. Based on the results of the present experimentation the following conclusions are drawn:
In the present experimentation the optimum speed under flooded conditions is obtained using Taguchi Robust Design Methodology is 2000 rpm. Similarly the results obtained for feed and depth of cut are 0.1mm/min and 0.3mm respectively. The corresponding Type of tool is T-I.
The S/N ratio of predicted value and verification test values are valid when compared with the optimum values. It is found that S/N ratio value of verification test is within the limits of the predicted value and the objective of the work is full filled.
REFERENCES
[1] Leskover, p; Grum, J. (1986). The metallurgical aspect of machining, Annals of CIRP 35/1, 537-550
[2] A .Venkata Vishnu, K B G Tilak, Manik Reddy, “Optimization of Process Parameters for Surface Roughness in CNC Turning of EN-36 Material Using Taguchi Robust Design Methodology”, International Journal of Core
Engineering & Management (IJCEM), ICCEMT-2015, ISSN: 2348-9510, Special issue, December-2015. pp: 89-104
[3] Nirav M. Kamdar, Prof. Vipul K. Patel, “Experimental Investigation of Machining Parameters of EN36 Steel”,
International Journal of Engineering Research and Applications (IJERA) ISSN: 2248-9622. Vol. 2, Issue 3, May-Jun 2012, pp.1833-1838.
[4] Kaushal Pratap Singh and Girish Dutt Gautam:“Selection of Optimum Machining Parameters for EN36 Alloy Steel in CNC Turning Using Taguchi Method” International Journal of Scientific & Engineering Research, Volume
5, Issue 3, ISSN 2229-5518 – March 2004
[5] Manan Kulshreshtha: “Analysis of the Effect of Machining Parameters on Surface Roughness of EN 36 Nickel
Steel”, International Journal of Advanced Information Science and Technology (IJAIST) ISSN: 2319:2682 Vol.16, No.16, August 2013.
[6] A .Venkata Vishnu, G. Guruvaiah Naidu, K B G Tilak, J.Ramakrishna, “Application of Taguchi Method in the Optimization of Turning Parameters for Material Removal Rate of En-36 Material”, International Journal of
Advance Engineering and Research Development E-ISSN (O): 2348-4470 P-ISSN (P): 2348-6406, Volume 2, Issue 8, August-2015.
[7] Ballal, Inamdar and Patil P.V. “Application Of Taguchi Method For Design Of Experiments In Turning Gray Cast Iron ” International Journal of Engineering Research and Applications (IJERA) Vol. 2, Issue 3, May-Jun 2012, pp.1391-1397.
[8] G. Guruvaiah Naidu, A.Venkata Vishnu, G.Janardhana Raju “Optimization of Process Parameters for Surface Roughness in Milling of EN-31 Steel Material Using Taguchi Robust Design Methodology”, International Journal of Mechanical And Production Engineering ISSN: 2320-2092, Vol.2 Issue 9, September-2014.
[9] A.Venkata Vishnu, K B G Tilak, G. Guruvaiah Naidu, Dr.G.Janardhana Raju “Optimization of Different Process Parameters of Aluminium Alloy 6351 in CNC Milling Using Taguchi Method”, International Journal of Engineering
Research and General Science, ISSN: 2091-2730,Nepal, Vol.3 Issue 2, March-April-2015.
[10] Lathkar, G., S; Kharde, R. R; Basu, S. K. (2001). Some experiments in machining grease based solid lubricants, Journal of the Institution of Engineers, (India), vol. 82, 01- 06
[11] Edemir, A. (1991). Tribological properties of boric acid and boric acid forming surfaces, Part I. Crystal Chemistry and Mechanism of self lubrication of boric acid, Lubrication Engineering. Vol. 47, 168-178
[12] HMT "Production Technology", Tata McGraw Hill, 2004.
[13] Phillip j. Ross "Taguchi Techniques for Quality Engineering", Tata McGraw Hill, Second Edition, 2005. [14] A.Venkata Vishnu1 G.Guruvaiah Naidu S.Sai Reddy
Experimental Investigation of Turning of Steel Alloy Under Sae40+Boric Acid (IJSRD/Conf/RTIME/2016/009).
[15] A.Venkata Vishnu “An Investigation on Comparison of Vegetable Oil and Nano Fluids Coolants in Turning of En 19 Alloy Steel”, International Journal of Pure and Applied Research in Engineering and Technology IJPRET, 2017 (UGC Approved); Volume 6 (4): November 2017, pp: 1-15. [16] A.Venkata Vishnu, G.Kiran Kumar, “Analysis of
surface roughness in turning using nano fluids: Prediction
model and cutting parameters optimization”, IJRASET (UGC Approved) Volume 5, Issue XII, December 2017,pp 340-347.