Quantitative Trait Locus Mapping Based on Resampling in a Vast Maize Testcross
Experiment and Its Relevance to Quantitative Genetics for Complex Traits
Chris C. Scho
¨n,* H. Friedrich Utz,
†Susanne Groh,
‡Bernd Truberg,
§Steve Openshaw**
and Albrecht E. Melchinger
†,1*State Plant Breeding Institute and†Institute of Plant Breeding, Seed Science and Population Genetics, University of Hohenheim, 70593 Stuttgart, Germany,‡Pioneer Ge´ne´tique, 68740 Nambsheim, France,§Pioneer Hi-Bred Northern Europe GmbH, 48268 Greven,
Germany and**Syngenta Seeds, Stanton, Minnesota 55018
Manuscript received June 9, 2003 Accepted for publication October 31, 2003
ABSTRACT
From simulation studies it is known that the allocation of experimental resources has a crucial effect on power of QTL detection as well as on accuracy and precision of QTL estimates. In this study, we used a very large experimental data set composed of 976 F5maize testcross progenies evaluated in 19
environ-ments and cross-validation to assess the effect of sample size (N), number of test environments (E), and significance threshold on the number of detected QTL, the proportion of the genotypic variance explained by them, and the corresponding bias of estimates for grain yield, grain moisture, and plant height. In addition, we used computer simulations to compare the usefulness of two cross-validation schemes for obtaining unbiased estimates of QTL effects. The maximum, validated genotypic variance explained by QTL in this study was 52.3% for grain moisture despite the large number of detected QTL, thus confirming the infinitesimal model of quantitative genetics. In both simulated and experimental data, the effect of sample size on power of QTL detection as well as on accuracy and precision of QTL estimates was large. The number of detected QTL and the proportion of genotypic variance explained by QTL generally increased more with increasingNthan with increasingE. The average bias of QTL estimates and its range were reduced by increasingNandE. Cross-validation performed well with respect to yielding asymptotically unbiased estimates of the genotypic variance explained by QTL. On the basis of our findings, recommenda-tions for planning of QTL mapping experiments and allocation of experimental resources are given.
D
URING the past 15 years a large number of studies computer simulations (Utz and Melchinger 1994; Beavis1998;Go¨ ringet al.2001;Allisonet al. 2002), have identified molecular markers linked toquan-which demonstrated especially for small samples that titative trait loci (QTL) involved in the inheritance of
estimates of the proportion of genotypic variance ex-agronomically important traits. These QTL generally
plained by QTL were severely inflated irrespective of explained a significant proportion of the phenotypic
the statistical method used for analysis. Reasons are that variance of the respective trait and, therefore, gave rise
QTL effects are generally estimated from the same data to an optimistic assessment of the prospects of
marker-set used for model selection and factors such as epistasis assisted selection (MAS; for review seeLynchandWalsh
and QTL⫻environment interactions additionally bias 1998). On the basis of results from these studies, MAS
upward. For marker-assisted breeding this has severe programs were initiated, leading to controversial results.
consequences: (i) power calculations for experiments While some authors succeeded in applying MAS to
im-trying to replicate earlier findings in independent sam-prove their breeding populations (e.g.,YousefandJuvik
ples are based on false assumptions and, therefore, are 2001) or even clone QTL controlling quantitative traits
subject to error; (ii) weights given to individual marker-(e.g.,Fridmanet al. 2000), others reported that no
sub-trait associations as components of selection indices stantial genetic progress was achieved by using MAS
could be severely biased and have a large sampling error; (e.g.,OpenshawandFrascaroli1997) or that only a
(iii) prospects of MAS are overrated; and (iv) prospects fraction of the putative QTL actually contributed to the
of fine mapping and cloning of a QTL might be mis-inheritance of the trait of interest in a selected
pop-judged if very small or spurious QTL are chosen on ulation (e.g.,Bouchezet al. 2002).
account of their overestimated effects. An explanation for the latter results could be found
The effect of experimental dimensions such as sample in theoretical studies (LandeandThompson1990) and
size and number of test environments on the power of QTL detection as well as accuracy and precision of QTL estimates has been investigated in simulation studies, 1Corresponding author:Institute of Plant Breeding, Seed Science and
generally with the assumption of few (ⱕ10) segregating Population Genetics, University of Hohenheim, 70593 Stuttgart,
Ger-many. E-mail: [email protected] QTL. On the basis of simulations with 40 segregating
in centimeters on a plot basis as the distance from the soil
QTL,Beavis(1998) raised the question of whether the
level to the uppermost leaf in 16 of the 19 environments.
infinitesimal model, upon which quantitative genetics
RFLP marker genotyping and linkage map construction:
is based (Fisher 1918), could be confirmed if larger DNA extraction, restriction enzyme digestions, gel electropho-experimental populations were evaluated. He also rec- resis, transfer of DNA to nylon membranes, and DNA hybrid-ommended the use of resampling techniques to obtain izations were performed by standard procedures (Sambrook
et al.1989). Each F4 plant was represented by 20 bulked F5
asymptotically unbiased estimates of QTL effects. First
plants. Observed genotype frequencies at each marker locus
results with experimental data have been reported by
were checked for deviations from Mendelian segregation
ra-Bennewitzet al. (2002) for bootstrapping andUtz et tios and allele frequency 0.5 using a2test. Appropriate type al. (2000) for cross-validation. However, when testing I error rates were determined by the sequentially rejective the efficiency of resampling techniques in experimental Bonferroni test (Holm 1979). High-quality molecular data were produced for 976 of the 990 analyzed F4plants and 172
studies a limitation has been their relatively small sample
restriction fragment length polymorphism (RFLP) markers.
size. Consequently, the question remained, how
effi-Therefore, the construction of the linkage map and
subse-ciently resampling techniques could be applied to large quent QTL analyses are based on 976 genotypes. The software populations. Here, data from a vast experimental study package GMENDEL 3.0 (Holloway and Knapp 1993) was composed of almost 1000 F5 maize testcross progenies used for map construction.
Agronomic data analyses:All quantitative genetic
parame-were used to: (1) estimate the number of QTL involved
ters were estimated on the basis of the 976 testcross progenies
in expression of grain yield, grain moisture, and plant
of F5lines for which high-quality molecular data were available.
height; (2) assess the effect of sample size, heritability, Each site-year combination was treated as an environment in and significance threshold on the power of QTL detec- the analysis. Trait values were adjusted for block effects. For tion, the proportion of the genotypic variance explained each environment, block effects were calculated as the devia-tion of the 55 F5testcrosses in that block from the mean of
by the detected QTL, and the corresponding bias in
all F5testcrosses. An analysis of variance (ANOVA) combined
estimates from experimental data; (3) analyze the
be-across environments was computed. Components of variance
havior of cross-validation-derived estimates for number were estimated considering all effects in the statistical model of QTL, genotypic variance explained, and the magni- as random. Estimates of variance components2
ge
[genotype-tude of bias across an array of environmental and geno- by-environment (G ⫻ E) interaction variance confounded with experimental error] and2
g(genotypic variance) of
test-typic subpopulations; and (4) give recommendations
cross progenies of F5lines and their standard errors (SE) were
about the sample size and number of environments
calculated as described bySearle(1971, p. 475). Heritabilities
to be used in QTL mapping experiments for complex (h2) on a testcross progeny-mean basis were estimated as
quantitative traits. In addition, we used computer
simu-lations to test the usefulness of cross-validation for ob- hˆ2⫽ ˆ2g
(ˆ2
ge/E)⫹ ˆ2g
, (1)
taining unbiased estimates of QTL effects.
where E is the number of environments. Exact 95% confi-dence intervals (C.I.) ofhˆ2were calculated according toKnapp
MATERIALS AND METHODS et al.(1985). Heritabilites on a plot basis (h2
plot) were estimated
usingE⫽1 in Equation 1.
Plant materials:Two elite dent inbred lines, subsequently QTL analyses:QTL mapping and estimation of their effects referred to as P1 and P2, were used as parents. They belonged were performed with software PLABQTL (Utz and Mel-to the same heterotic pool but were known Mel-to be genetically chinger1996), employing composite interval mapping by the diverse with a coefficient of coancestry (Falconer and regression approach (HaleyandKnott 1992) in combina-Mackay1996) of 0.21. Randomly chosen F2plants from the tion with the use of cofactors (JansenandStam1994;Zeng
cross P1 ⫻ P2 were selfed to produce 990 independently 1994). An additive genetic model was chosen for the analysis of derived F5(F4:5) lines. Testcross seed was produced by con- testcross progenies as described byUtzet al.(2000). Cofactors
trolled hand pollinations using each of the 990 F5 lines as were selected by stepwise regression according to Miller
male parent and crossing to an unrelated inbred tester line (1990, p.49). Two different levels of significance were used: from a complementary heterotic pool. Check inbreds
includ-ing parents P1 and P2 as well as the F1between P1 and P2 1. Cofactors were chosen with an “F-to-enter” and an
were also crossed to the inbred tester. All plant materials used “F-to-delete” value of 12.4 and testing for presence of a in this study are proprietary to Pioneer Hi-Bred International. putative QTL in an interval by the likelihood-ratio test was
Field experiments:The testcross progenies were evaluated performed using a LOD threshold of 3.21. The experi-in 1994 and 1995 experi-in 7 and 12 locations, respectively. The mentwise type I error was determined to be Pe ⬍ 0.02, experiments were located in Illinois (3 locations), Indiana using 1000 permutation runs (Doerge and Churchill (2), Iowa (3), Kansas (1), Nebraska (2), and Italy (1). In each 1996).
of the 19 environments the experimental design consisted of 2. F-to-enter andF-to-delete values were set to 3.5 and the 18 blocks with 60 entries. Each block contained testcrosses of LOD threshold to 2.5. The latter combination corresponds 55 F5lines, P1, P2, their F1, and two checks. Trials were per- to an experimentwise type I error ofPe⬍0.35. Estimates
formed with one replication per environment. Two-row plots of QTL positions were obtained at the position, where the (8.2 m2) were machine planted (5.5–7.0 plants m⫺2) and
har-LOD score assumed its maximum in the region under
vested as grain trials with a combine. consideration.
Data were recorded for grain yield in megagrams per
hect-are, adjusted to 155 g kg⫺1grain moisture, and grain moisture The proportion of the phenotypic variance explained by
QTL was determined by the estimator R2
adj as described by
TABLE 1
Number of possible genotypic subpopulations⫻environmental subpopulations⫻randomizations as well as the actual number of data sets (in parentheses) used for cross-validation for each of 12 possible
combinations of sample size (N) and number of test environments (E) for experimental data and six possible combinations for simulated data
N
E 976 488 244 122
Experimental data
19 or 161 2⫻1⫻60 4⫻1⫻30 8⫻1⫻15
(1) (120) (120) (120)
4 1⫻4⫻30 2⫻4⫻15 4⫻4⫻8 8⫻4⫻4
(120) (120) (128) (128)
2 1⫻8⫻15 2⫻8⫻8 4⫻8⫻4 8⫻8⫻2
(120) (128) (128) (128)
N
E 488 122
Simulated data
16 10⫻1⫻16 40⫻1⫻4
(160) (160)
4 10⫻4⫻4 40⫻4⫻1
(160) (160)
2 10⫻8⫻2 40⫻8⫻1
(160) (320)
Abbreviations are as follows for all tables: CV, cross-validation; CV/GE, cross-validation accounting for genotypic and environmental sampling; DS, data set; ES, estimation set; LOD, likelihood odds ratio; MAS, marker-assisted selection;PED, experimental data reference population; PSD, simulated data reference population;
QTL, quantitative trait locus/loci; TS, test set.
Utzet al.(2000). The proportion of the genotypic variance of their effects and means across environments of the fifth explained by all detected QTL was estimated from the ratio independent sample were used as the test data set (TS). The TS was used to validate QTL detected in the ES and to obtain asymptotically unbiased estimates of QTL effects and the
geno-pˆ⫽Rˆ 2 adj
hˆ2 . (2)
typic variance explained by QTL. For each DS 5 different ES and corresponding TS are possible. The randomization step Both parameters,R2
adjandh2, are estimated with an
experi-of assigning genotypes to the five subsamples was re-mental error and estimates ofpcan exceed 100% or become
peated 24 times, resulting in 120 different ES and correspond-negative. We did not restrict estimates ofpto the parameter
ing TS per DS. The CV described in this article (subsequently space [0, 100], because additional bias is introduced if
esti-denoted as “standard CV”) deviates slightly from the CV de-mates are constrained to lie within theoretical boundaries
scribed byUtzet al.(2000), accounting for genotypic sam-(Allisonet al. 2002).
pling, where the ES and TS comprised all but one environment
Subdivision and analysis of experimental data:From the
from the DS. experimental reference population PED (N ⫽ 976, E ⫽ 19;
The following parameters were estimated: grain yield and grain moisture) orPED(N⫽976,E⫽16; plant
height) an array of (a) genotypic subpopulations of sizeN(N⫽ The heritability of each trait for each DS (hˆ2
DS) and averaged
976, 488, 244, 122) and (b) environmental subpopulations of
over all DS (h2
DS) for a givenPED(N,E).
sizeE(E⫽19 or 16, 4, 2) was sampled without replacement.
The number of QTL (mˆDS) and the proportion of the genotypic
After randomization of the genotypes and environments in
variance explained by QTL (pˆDS) in each DS as well as their PED(N,E), this procedure was repeated 2–60 times to result arithmetic mean over all DS (m
DS andpDS) for a given PED
in a total of 120 or 128 different data sets (DS) perPED(N,E) (N,E).
except forPED(976, 19/16), where only 1 DS exists (Table 1). The number of QTL (m
ˆES) and the proportion of the genotypic
Within eachPED (N,E) estimation of quantitative genetic variance explained by QTL in each ES (
pˆES), their arithmetic
parameters such as variance components and heritabilities as
well as QTL analyses were performed for each DS individually mean over all ES for a given DS (m …
ESand p
…
ES), and their
grand arithmetic mean over all DS (mESandpES) for a given
at two levels of significance as described earlier. Fivefold
cross-PED(N,E).
validation (fivefold CV;Hjorth1994) accounting for
geno-The proportion of the genotypic variance explained by QTL typic sampling was applied. Each DS was randomly subdivided
in each TS (pˆTS), the arithmetic mean over all TS for a given
into five genotypic samples without replacement. Means across
all environments of four genotypic samples were used as an DS (…pTS), the grand arithmetic mean over all DS (pTS) for
estimation data set (ES) for localization of QTL and estimation a givenPED(N,E), and the median (p˜TS) and 12.5% [p
…
the grand arithmetic mean over all DS (pSD:ES) for a givenPSD
(12.5%)] and 87.5% […pTS(87.5%)] quantiles of the
propor-(N,E) were calculated. tion of the genotypic variance for all DS of a given PED
In CV with experimental data, the magnitude of the bias (N,E).
of QTL estimates is determined from the difference pES⫺
The magnitude of the bias in estimates of the genotypic
vari-pTS. However, in fivefold CV, estimation of QTL is based on
ance explained by QTL due to genotypic sampling
calcu-20% fewer individuals than in DS and, therefore, power of lated as the difference between average estimates ofp
ob-QTL detection is reduced, affecting the estimation of the tained from ES and corresponding TS (pˆES⫺pˆTS), averaged
number of QTL, p, and the bias. For the simulated data, the QTL genotypes are (partly) known and an estimate of over all ES and TS for a given DS (…pES ⫺ p
…
TS), the grand
arithmetic mean over all DS (pES⫺pTS) for a givenPED(N,
the truly accountable proportion of the genotypic variance
E), and the median and 12.5 and 87.5% quantiles of the
(pSD:DSandpSD:ES) can be obtained. Consequently, an estimate
bias for all DS of a givenPED(N,E).
of the bias of QTL effects due to model selection in DS can For DS withhˆ2
DS⬍0.002 the parameterspˆES,pˆTS, and the bias be calculated from the differencepDS⫺pSD:DS. The
unbiased-were set to zero due to the problem of dividing by a number ness ofpTScan be derived from the congruency betweenpTS
close to zero. and pSD:ES. To be useful for assessing the prospects of MAS,
Simulation data set:In the QTL analysis of the experimental pTSshould be of similar size aspSD:DSdespite the 20% fewer
dataPED(976, 16) with LOD 3.21, 21 QTL for plant height individuals in ES as compared to DS.
were detected, explaining an estimated 56.1% of the genotypic Consistency of QTL estimates across subpopulations:QTL variance. On the basis of the linkage map with 172 RFLP consistency across subpopulations was assessed. All QTL de-markers and assuming the estimated positions and effects of tected for plant height in the experimental reference popula-these 21 QTL to be the true QTL parameters, a simulated tionPED(976, 16) with LOD 3.21 were assumed as reference
reference population PSD (N ⫽4880, E⫽ 16) consisting of QTL. Around their position on the genome, 20-cM intervals
4880 F4 individuals was generated using software PLABSIM (10 cM downstream and upstream) were constructed.
Subse-(Frischet al.2000). The genotypic value of each F4individual quently, QTL mapping results of all DS within a givenPSD(N,
was determined by the known effects at the 21 QTL and a E) andPED(N,E) were scanned with LOD 3.21 and the number
random normal deviate accounting for 43.9% of the genotypic of QTL positioned within one of the 21 intervals and of the variance attributable to undetected QTL. Moreover, for each same sign as the reference QTL (matching) was counted. The number of newly occurring QTL (not matching) was also individual, 16 random normal deviates were generated for
assessed. The same analysis for determining matching and simulation ofG⫻Einteractions plus experimental error
un-nonmatching QTL was performed for all DS of a given PED
der the assumption ofh2⫽0.3318 for a single environment,
(N, E) on the basis of LOD 2.5 with an extended set of 30 resulting in 16 phenotypic values per F4genotype withh2⫽
QTL detected in the reference populationPED(976, 16) with
0.8882 for 16 environments.
a LOD threshold of 2.5.
Subdivision and analysis of simulated data:The simulated reference populationPSD(4880, 16) was partitioned into 10
or 40 genotypic subpopulations of sizeN⫽488 or 122,
respec-tively. Environmental subpopulations of sizeE⫽16, 4, and 2 RESULTS
were also generated. After randomization of the genotypes
and environments in PSD (N, E), this partitioning was con- Analysis of the experimental populationPED(976, 19/
ducted 1–16 times to result in a total of 160 DS perPSD (N, 16):Molecular data:Three chromosomal regions on chro-E) except forPSD(122, 2) with 320 possible DS (Table 1).
mosomes 2, 5, and 8 showed allele and genotype
fre-In general, estimation of quantitative genetic parameters
quencies deviating highly significantly from Mendelian
such as variance components and heritabilities as well as QTL
expectations (P ⬍0.0001). The 172 RFLP marker loci
mapping and QTL parameter estimation (mDS, mES, pDS, pES,
and pTS) were conducted as described for the experimental spanned a map distance of 1818 cM with an average
subpopulations, but with simulated data only one threshold interval length of 11.2 cM. One hundred percent of for declaring significant QTL (LOD⫽2.5 andF-to-enter⫽ the genome was located within a 20-cM distance to the 3.5) was used. Two CV schemes, standard CV and a second CV
nearest marker.
analysis accounting for genotypic and environmental sampling
Trait means, variances, and heritabilities:Climatic
condi-simultaneously (CV/GE) as described byUtz et al.(2000),
were performed for all DS within each of the sixPSD(N,E). tions were favorable for maize production in all
environ-Twenty CV/GE runs were conducted for each DS. ments. Phenotypic correlations between environments
For each DS QTL positions and effects estimated with com- based on performance of the testcrosses of the 976 F
5
posite interval mapping were used to predict the genotypic
progenies varied between 0.03 and 0.24 for grain yield,
value of each of the 4880 F4individuals from the simulated
between 0.09 and 0.65 for grain moisture, and between
reference population on the basis of its marker genotype (GˆDS).
Pearson’s correlation coefficientr(SnedecorandCochran 0.22 and 0.44 for plant height. For all three traits, the
1989, p. 177) was calculated for the predicted and the known, nonsignificant orthogonal contrast between the average simulated genotypic value of the 4880 F4individuals (G) and testcross performance of the two parental lines and the
the proportion of the genotypic variance attributable to
simu-testcross mean of the F5lines indicated the absence of
lated QTL was estimated aspˆSD:DS⫽rˆ2adj(GˆDS,G). Subsequently,
epistasis (Table 2), supporting an additive model for
the arithmetic mean over all DS (pSD:DS) was calculated.
Analogously, for each of the two CV schemes QTL positions QTL analyses. The range in testcross performance of
and effects estimated in ES were used to predict the genotypic F5 lines considerably transgressed the testcross means value of each of the 4880 F4individuals from the simulated of the parents andˆ2
gwas significantly greater than zero
reference population on the basis of its marker genotype (GˆES).
(P ⬍ 0.01). Heritability on a progeny-mean basis was
Likewise, the proportion of the genotypic variance attributable
high (hˆ2 ⱖ 0.89) for grain moisture and plant height
to simulated QTL was estimated aspˆSD:ES⫽rˆ2adj(GˆES,G).
TABLE 2
First- and second-degree statistics for maize testcross progenies of parent lines (P1 and P2) and 976 F5lines
from cross P1⫻P2 for grain yield and grain moisture evaluated in 19 environments and plant height evaluated in 16 environments
Parameter Entry nos. Grain yield (Mg ha⫺1) Grain moisture (g kg⫺1) Plant height (cm)
Testcross meansa
P1 21 10.78⫾0.10b 196.2⫾1.37 266.5⫾2.33
P2 18 10.94⫾0.12 211.7⫾1.61 274.8⫾2.43
P 39 10.85⫾0.08 203.4⫾1.07 270.8⫾1.68
F5lines 976 10.66⫾0.01 205.4⫾0.24 270.7⫾0.20
Range of F5lines 9.46–11.80 178.3–230.9 251.5–290.8
Variance components 2
g 0.080⫾0.006** 51.47⫾2.53** 34.78⫾1.77**
2
ge 0.861⫾0.009 85.19⫾0.91 70.00⫾0.82
Heritability
h2
plot 0.085 0.38 0.33
h2 0.64 0.92 0.89
95% C.I.conh2 0.60, 0.67 0.91, 0.93 0.88, 0.90
**Significant at the 0.01 probability level.
aP⫽TC mean of P1 and P2. bStandard errors are attached. cConfidence interval.
a plot basis was 0.38 and 0.33 for grain moisture and served for grain yield and LOD 2.5 as compared to LOD 3.21.
plant height, respectively, and 0.085 for grain yield.
QTL analyses:Results from QTL analyses in the experi- Analysis of experimental subpopulations: Heritability estimateson an entry-mean basis were calculated for each mental population PED (976, 19/16) are presented in
Table 3 for both significance thresholds. Increasing the DS within a given PED (N, E). The average estimates
(h2
DS) ranged from 17.3% [PED(976, 2)] to 63.8% [PED
LOD and F-to-enter threshold (decreasing the type I
error rate) decreased the power of QTL detection, as (976, 19)] for grain yield, from 54.0% [PED(488, 2)] to
92.0% [PED (976, 19)] for grain moisture, and from
reflected by the number of detected QTL (mˆDS) and the
proportion of genotypic variance explained by them 48.4% [PED(244, 2)] to 88.8% [PED(976, 16)] for plant
height. For all traits,hˆ2
DSshowed a wide range across DS
in the DS (pˆDS) and averaged over ES (p
…
ES) for all traits.
especially for smallNandE(data not shown). For grain Averages over TS (…pTS) were between 3.1% (grain yield)
and 7.7% (plant height) higher for LOD 2.5 than for yield, DS withhˆ2
DS ⬍0.002 were observed forPED(244,
4),PED(122, 4), and allPED(N, 2).
LOD 3.21. Fivefold standard CV revealed no major
dif-Power of QTL detectionwas affected by the trait under ference in absolute bias (…pES ⫺ p
…
TS) between the two
thresholds of QTL detection for grain moisture and study, the significance threshold, the sample size, and the number of environments (Table 4). The average plant height; however, a slightly increased bias was
ob-TABLE 3
Number of QTL (mˆDS) detected in the experimental populationPED(N⫽976,E⫽19/16), the proportion of
the genotypic variance explained by QTL (%) in the data set (pˆDS) and averaged over estimation
sets (…pES) and test sets (p
…
TS), as well as the bias (p
…
ES⫺ p
…
TS) using fivefold standard
cross-validation for two significance levels of QTL detection
LOD 2.5 andF-to-enter⫽3.5 LOD 3.21 andF-to-enter⫽12.4
Parameter Grain Grain Plant Grain Grain Plant
estimated yield moisture height yield moisture height
mˆDS(no.) 18 32 30 8 23 21
pˆDS 42.9 61.9 60.8 36.1 57.5 56.1
p
…
ES 42.8 59.9 58.1 35.2 55.7 51.0
p
…
TS 29.8 52.3 49.8 26.7 49.0 42.1
TABLE 4
Number of QTL detected in estimation sets averaged over data sets (mES) and the range (Min. m
…
ES⫺Max.
m
…
ES) of the number of QTL detected in estimation sets for each of 12 possible combinations of sample
size (N) and number of test environments (E) of experimental data using fivefold standard cross-validation and two significance levels for grain yield, grain moisture, and plant height
LOD 2.5 andF-to-enter⫽3.5 LOD 3.21 andF-to-enter⫽12.4
E N: 976 488 244 122 976 488 244 122
Grain yield
19 15.3 8.9 6.4 6.2 7.4 3.4 1.6 0.5
5.7–12.4 3.4–10.3 2.9–9.8 2.0–5.1 0.3–3.3 0.0–2.3
4 8.2 4.8 3.8 4.4 3.9 1.7 0.6 0.2
4.1–13.7 2.3–8.8 1.5–7.7 1.2–9.4 1.4–7.3 0.1–4.6 0.0–2.3 0.0–1.7
2 6.0 3.5 2.9 4.0 3.0 1.0 0.3 0.1
1.6–10.3 0.5–7.9 0.7–6.4 1.1–8.2 0.1–7.0 0.0–4.5 0.0–1.6 0.0–1.7
Grain moisture
19 28.3 19.2 12.8 9.7 18.4 9.3 3.2 0.7
14.1–23.5 8.3–16.6 6.1–14.7 6.5–12.3 0.5–5.6 0.0–3.2
4 22.6 15.2 10.3 8.3 14.6 7.1 2.2 0.6
19.7–26.3 11.1–20.2 5.3–14.7 4.3–13.0 12.0–19.9 4.1–11.7 0.3–4.9 0.0–2.0
2 19.2 12.6 8.7 7.6 12.5 5.6 1.7 0.5
13.0–23.8 7.9–16.7 4.3–13.9 2.1–13.0 7.5–17.7 1.7–9.8 0.0–5.2 0.0–2.0
Plant height
16 26.4 17.6 12.0 9.1 14.8 8.4 3.6 1.0
14.6–22.9 8.2–17.1 5.5–13.7 6.3–10.3 1.6–5.8 0.0–2.9
4 19.0 12.5 8.7 7.2 10.8 5.9 2.0 0.6
15.2–24.2 7.9–16.6 4.3–14.7 4.1–12.8 8.8–13.0 4.0–8.8 0.2–4.6 0.0–2.1
2 14.5 9.1 6.5 6.1 8.3 3.9 1.1 0.4
7.7–19.7 2.1–14.5 2.7–12.1 2.5–11.2 5.3–10.9 1.1–6.4 0.0–3.3 0.0–2.0
number of QTL in ES (mES) was highest for grain mois- from expectations, in some cases the average bias even
increased from smaller to larger subpopulations. This ture in PED (976, 19) with LOD 2.5 (28.3) and lowest
for PED (122, 2) and grain yield with LOD 3.21 (0.1). can be attributed to the fact that (i) for small
subpopula-tions, more ES with 0 detected QTL occurred and (ii) With increasingNandE,mESincreased for all traits and
both significance levels, except for grain yield with more forE⫽2, samples with no significant genotypic variance (hˆ2
DS⫽0) were observed, in which casepˆESandpˆTSwere
QTL detected for PED(122, 2, and 4) as compared to
PED(244, 2, and 4) with LOD 2.5. In small samples only zero, resulting in zero bias.
The mean (pTS), median (p˜TS), and 12.5 and 87.5%
few QTL were detected for LOD 3.21; on averagemESⱕ
1.0 with N ⫽ 122 for all traits and numbers of test quantiles […pTS (12.5%), p
…
TS(87.5%)] of the proportion
of the genotypic variance explained in TS is shown for environments. With LOD 3.21, only in few DS were⬎10
QTL detected even for large samples. ForN⫽122 most each combination ofPED(N,E) and LOD 2.5 in Figure
2. Results with LOD 3.21 were similar and are therefore DS yielded ES with no detected QTL (…mES⫽0).
The average proportion of the genotypic variance explained not shown. For grain moisture and plant height, varia-by the detected QTLin TS (pTS) generally increased with tion of p
…
TS among DS was increased for small N. For
grain yield andE ⫽ 4 and E ⫽ 2, however, N had no increasingNfor all traits and both significance
thresh-olds (Figure 1) and was always greater for LOD 2.5 than clear effect on the range of…pTS. Increasing the number
of test environments generally decreased the range of for LOD 3.21. The number of test environments had
only a small effect on bothpTSand the bias (pES⫺pTS). p
…
TS. The mean (pTS) and the median (p˜TS) proportions
of genotypic variance explained by QTL were in good A dramatic increase in bias could be observed for small
N, LOD 2.5, and grain yield. As a consequence,pESwas agreement except for grain yield andE⫽ 2 and 4.
A similar picture was observed when analyzing the greatest for small N and grain yield with an estimated
average bias close to 100% forPED(122, 2). For grain variation in the bias (p
…
ES ⫺ p
…
TS) among DS for a given PED(N,E) (Figure 3). For smallN andE, the variation
moisture and plant height and LOD 2.5,pESwas almost
constant for allPED(N,E). For LOD 3.21, average bias of bias was large for grain yield and LOD 2.5. Estimates
Figure 1.—Proportion of the genotypic variance explained by detected QTL in estimation sets averaged over all data sets (pES) for
12 combinations of experimental dataPED(N,E), using fivefold
stan-dard cross-validation and two sig-nificance levels for grain yield, grain moisture, and plant height. Individual columns are parti-tioned into the genotypic variance explained in test sets (pTS, solid
bottom) and the bias calculated as the differencepES⫺ pTS (shaded
top).
largely overestimated proportion of genotypic variance of estimated QTL positions lying within a 20-cM interval of the simulated QTL (matching) increased with in-explained in ES divided by a small heritability estimate.
The range of the 12.5 and 87.5% quantiles was consider- creasingNandEin DS analyzed with composite inter-val mapping and in ES analyzed with standard CV and ably reduced for LOD 3.21 as compared to LOD 2.5.
CV/GE. With N ⫽ 122 and E ⫽ 2, on average only As shown for…pTS, the mean bias and the median bias
across DS differed considerably for grain yield andE⫽ 2.5 simulated QTL (4.7 ⫻ 0.53) were detected with composite interval mapping. The proportion of geno-2. For LOD geno-2.5, the median bias decreased with
increas-ingN andE for all traits and combinations of PED (N, typic variance explained by QTL estimated in DS (pDS)
was generally greater than the proportion of the geno-E) according to expectations. However, with LOD 3.21
the median and the mean bias increased fromN⫽122 typic variance attributable to simulated QTL (pSD:DS),
revealing considerable bias of QTL estimation (7.6– toN⫽244 for all three traits due to a high number of
ES with 0 detected QTL. 37.4%), especially for the small sample size. The num-ber of matching QTL was smaller for the two CV
Analysis of simulated subpopulations: Results for
plant height in each of the sixPSD(N,E) are given in schemes than for composite interval mapping due to the
20% smaller population size and/or reduced number of Table 5. Heritability estimates agreed well with those
underlying the simulated values. In none of the 160 DS environments in ES as compared to DS. As a conse-quence, estimates of the bias increased from composite samples (320 forN⫽122,E⫽2) could all 21 QTL be
Consistency of QTL estimates across experimental subpopulations: The 21 intervals of size 20 cM con-structed around the QTL detected for plant height in the DS ofPED(976, 16) with LOD 3.21 did not overlap.
On average, the number of detected QTL matching the reference QTL was increased considerably for DS with largeN[PED(976,E)] as compared to the smaller
sub-populations [e.g.,PED(122,E)] (Table 6). The number
of unmatched QTL was increased to a much smaller extent from smaller to larger populations, indicating a higher ratio of true:false QTL for the larger subpopula-tions. Doubling the number of environments did not improve the ratio of true:false QTL as much as doubling the number of testcross progenies in the subpopulation. Similar results were obtained with 30 intervals of size 20 cM constructed around QTL detected in DS of PED
(976, 16) with a LOD threshold of 2.5.
DISCUSSION
Influence of sample size and number of test
environ-ments: To our knowledge, phenotypic and molecular
data on testcross progenies of 976 F5lines evaluated in
19 environments is by far the largest QTL mapping experiment ever published in plants. The dimensions of the experiment had been designed to meet assumptions from a simulation study performed byBeavis (1998), who had inferred that with 40 QTL with additive effects of equal size, a heritability of 63%, and a sample of 1000 F2 progenies it should be possible to obtain a power
of QTL detection ofⵑ60% and consequently explain ⵑ60% of the genotypic variance with QTL. With the high-density genetic map used in this study (average interval length 11.2 cM), the power of QTL detection was expected to be even higher compared to the simula-tion study byBeavis(1998) because of the higher herita-bility (92%vs.63%) and the different population type
Figure 2.—Mean (–), median (o), and 12.5 and 87.5%
(testcross progenies of F5linesvs.F2 progenies).
How-quantiles of the proportion of the genotypic variance
ever, the maximum, validated genotypic variance
ex-plained in test sets [pTS,p˜TS, p
…
TS (12.5%), and p
…
TS (87.5%)]
calculated for individual data sets for 12 combinations of ex- plained by QTL in this study was 52.3% for grain
mois-perimental dataPED(N,E) using fivefold standard cross-valida- ture (Table 3), which is fairly small considering the
tion and LOD 2.5 for grain yield, grain moisture, and plant expenditures that had to be undertaken for testing al-height.
most 1000 unselected testcross progenies in 19 environ-ments. A substantial bias was found for estimates of the proportion of genotypic variance explained by the detected QTL even with N ⫽ 976, irrespective of the pTS) and were greatest for CV/GE andPSD(122, 2). For
all combinations of NandE a better agreement ofpTS trait, the heritability, and the significance threshold.
This corroborates results from the study by Beavis withpSD:ESandpSD:DSwas found for standard CV than for
CV/GE. For standard CV, a close agreement between (1998), who pointed out that the bias of QTL estimates could not be ignored even for N ⬎ 500. Results ob-pTS andpSD:ESand only a slight decrease in magnitude
frompTStopSD:DS(⬍5%) for all combinations ofN and tained with simulated data in this study support these
findings. WithN⫽488 andE⫽16 an absolute bias of Eindicated thatpTScan be used as an unbiased estimate
of the genotypic variance explained by QTL with finite 7.6% was observed when estimatingpDS, indicating that
QTL mapping results need to be interpreted with cau-population sizes. For CV/GE andN⫽122,pTSdeviated
markedly frompSD:ESandpSD:DS, indicating that more re- tion and strategies are needed for their validation.
In simulated and experimental data, the effect of search is needed to examine the small sample properties
Figure3.—Mean (–), median (o), and 12.5 and 87.5% quantiles of the bias (…pES ⫺ p
…
TS) calculated for individual data sets
for 12 combinations of experimental dataPED(N,E), using fivefold standard cross-validation and two significance levels for grain
yield, grain moisture, and plant height.
As expected, the number of detected QTL generally tion sizes, presumably because few QTL showed signifi-cant interactions with environments. As pointed out by increased with increasing sample size. The comparison
of subpopulations with the same plot capacities for phe- Moreauet al. (1998) andKnappandBridges (1990), it is therefore advisable in a MAS program to increase notypic evaluation revealed that increasing the number
of progenies generally increased the power of QTL de- population size rather than the number of test environ-ments or replications for most traits unless plot heritabil-tection (mES) and the proportion of the genotypic
vari-ance explained by QTL (pTS) and reduced the bias more ities are very low and/or the expenditures for molecular
analyses of additional genotypes are much higher than efficiently than did increasing the number of test
envi-ronments. For grain yield and LOD 2.5, however, the those for additional testing of phenotypes.
When increasing the population size from N ⫽488 number of detected QTL was higher when doubling
plot capacities fromPED(122, 2) toPED(122, 4) as com- toN⫽976, the increase in the proportion of genotypic
variance explained by QTL (pTS) per additionally tested
pared toPED(244, 2), probably due to the fact that the
estimated average heritability for grain yield andE⫽2 genotype was always smaller as compared to increasing Nfrom 244 to 488. This diminishing return per addi-(h2
DS⬍0.18) was too low for detecting significant QTL
popula-TABLE 5
Heritability, average number of detected QTL (mDSandmES), proportion of detected QTL matching simulated
QTL (%), and proportion of genotypic variance explained by QTL (pin %) for plant height calculated using composite interval mapping (CIM) and two cross-validation schemes (standard CV and
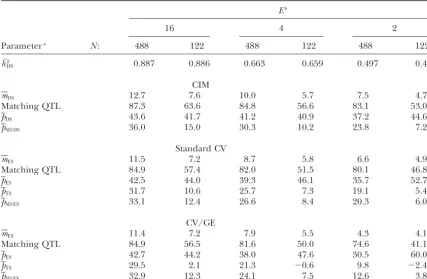
CV/GE) averaged over 160 or 320 simulated data sets (DS) for six combinations of sample size (N) and number of test environments (E)
Eb
16 4 2
Parametera N: 488 122 488 122 488 122
hˆ2
DS 0.887 0.886 0.663 0.659 0.497 0.489
CIM
mDS 12.7 7.6 10.0 5.7 7.5 4.7
Matching QTL 87.3 63.6 84.8 56.6 83.1 53.0
pDS 43.6 41.7 41.2 40.9 37.2 44.6
pSD:DS 36.0 15.0 30.3 10.2 23.8 7.2
Standard CV
mES 11.5 7.2 8.7 5.8 6.6 4.9
Matching QTL 84.9 57.4 82.0 51.5 80.1 46.8
pES 42.5 44.0 39.3 46.1 35.7 52.7
pTS 31.7 10.6 25.7 7.3 19.1 5.4
pSD:ES 33.1 12.4 26.6 8.4 20.3 6.0
CV/GE
mES 11.4 7.2 7.9 5.5 4.3 4.1
Matching QTL 84.9 56.5 81.6 50.0 74.6 41.1
pES 42.7 44.2 38.0 47.6 30.5 60.0
pTS 29.5 2.1 21.3 ⫺0.6 9.8 ⫺2.4
pSD:ES 32.9 12.3 24.1 7.5 12.6 3.8
aFor details of parameter estimation seematerials and methods. Matching QTL (%) are given as the
proportion of detected QTL found within a 20-cM interval flanking one of the 21 simulated QTL.
bE⫽16 corresponds toh2⫽0.888,E⫽4 toh2⫽0.665, andE⫽2 toh2⫽0.489.
(Lynch and Walsh, 1998). In addition, Bost et al. tionPED(976, 19/16) is shown in Figure 4. The largest
genetic effect was detected for grain moisture (␣max ⫽
(2001) pointed out that genetic factors, such as enzyme
variation in metabolic pathways, can lead to anL-shaped 0.49ˆP). The median genetic effect was small (0.1ˆP⬍
␣˜ ⬍ 0.2ˆP) and the distributions were skewed toward
distribution of QTL effects for a given quantitative trait.
The distribution of the standardized genetic effects smaller values (L-shaped) for all traits. These findings corroborate the hypothesis that polygenic traits are reg-found for QTL in the experimental reference
popula-TABLE 6
Number of matching and nonmatching (in parentheses) QTL for plant height with respect to the QTL detected in the experimental reference populationPED(976, 16) with two levels of significance averaged across
data sets for each of 12 possible combinations of sample size (N) and number of test environments (E) of experimental data
LOD 2.5 andF-to-enter⫽3.5 LOD 3.21 andF-to-enter⫽12.4
E N: 976 488 244 122 976 488 244 122
16 30.0 17.4 (2.4) 11.0 (3.0) 6.5 (3.3) 21.0 8.6 (1.6) 3.8 (1.1) 1.0 (0.6)
4 19.7 (1.9) 11.7 (2.5) 6.8 (2.6) 4.3 (2.8) 10.5 (2.2) 5.9 (1.6) 2.3 (0.9) 0.5 (0.4)
relation dropped to r ⫽ 0.57 for N ⫽ 488 and even more forN⫽122 (r⫽0.37), indicating that especially for smallN quite a few QTL detected in ES were false positives and did not contribute topTS.
Influence of significance threshold: Knapp (1998) suggested using a conservative significance threshold to improve the accuracy of the selection index in MAS. As expected, the power of QTL detection was increased in experimental data with LOD 2.5 andF-to-enter⫽ 3.5 as compared to LOD 3.21 andF-to-enter⫽12.4. It was surprising, however, that increasing the type I error rate
Figure4.—Boxplot with median, extremes, and quartiles also increasedp
TSfor all three traits and most
combina-of standardized absolute QTL effects estimated from the ex- tions of
PED(N,E). The effect was also reflected in the
perimental reference populationPED(976, 19/16), using two
higher percentage of QTL matching those of the
refer-significance thresholds for grain yield, grain moisture, and
ence population for LOD 2.5 as compared to LOD 3.21
plant height. The number of detected QTL is given below
the box. (Table 6). This corroborates results described by
Moreauet al. (1998), who found for lowh2(⬍0.2) that
increasing the type I error rate can lead to a higher ulated by a large number of genes with small effects that relative efficiency of MAS because the power of QTL follow approximately a geometric distribution. Hence, it detection increased more than the risk of detecting seems questionable if simulation studies on QTL map- false positives. However, for higher estimates ofh2they
ping and MAS assuming 5–10 QTL with equal effects reported this relationship to be vice versa. Reasons for of up to or⬎1.0Pare reflecting the true inheritance the discrepancies between their simulation study and
of polygenic quantitative traits such as grain yield. our results could be the assumption of only few segregat-Depending on the genetic architecture of the trait ing QTL (5 and 10) in the study byMoreauet al. (1998) and its environmental stability, the extra input of re- as compared to a much higher number in our study. sources for explaining a small additional proportion of With few QTL and a high heritability, the power of the genotypic variance by markers can be vast (MAS for QTL detection seems sufficiently high even with a more QTL with effects of 0.1Pand even more, so their clon- conservative threshold.
ing seems an idle undertaking). Therefore, trait-specific The choice of significance threshold depends on the strategies for MAS have to be developed. MAS seems goals of the breeder and the cost of marker analyses. For promising only if alleles with large effects are segregat- construction of an ideal genotype a more conservative ing for the trait of interest. Falconer and Mackay threshold should be chosen to minimize the risk of false (1996) gave examples for such traits in animal breeding. positives. As shown here, for complex quantitative traits They pointed out that a “large” effect in this context the number of putative QTL is very large, but due to would be 0.5–1.0P. In plant breeding experiments, theL-shaped distribution of detected QTL effects each
QTL with effects of this size have been reported. How- additional marker linked to a putative QTL would pro-ever, results from QTL studies indicating the presence duce diminishing returns but equal costs. Hence, even of major genes with large effects have to be interpreted if a large population was available from which to select with caution due to the problem of model selection. In optimal genotypes, the optimal number of putative QTL a large number of published QTL studies with small to be used for genotype construction would be much sample size (100⬍N⬍200) a considerable proportion smaller than the total number of QTL detected in a of the genotypic variance could be explained by few mapping experiment of reasonable sample size, espe-QTL (LynchandWalsh1998). Probably few of these cially when considering more than one trait simultane-QTL would hold in a MAS program what they promised. ously.
As can be shown from the experimental data presented When constructing a selection index for combined here, pES was almost constant for grain moisture and markassisted and phenotypic selection, the type I
er-plant height for all combinations ofPED(N,E) and LOD ror rate determines the stop criterion for including
addi-2.5 but for small N most ofpES must be attributed to tional markers in the model. Depending on marker
bias and not to the effects of real QTL. These findings costs and the magnitude of the detected QTL effects, were also corroborated by results from simulated data i.e., the genetic architecture of the trait, an optimum on plant height. When performing a linear regression type I error rate should exist. If marker costs are ne-of the proportion ne-of genotypic variance explained in glected, the experimentwise type I error ofPe ⱕ 0.35
ES on the number of detected QTL, the correlation (r) used in this study for grain yield, grain moisture, and betweenpES andmES was relatively high, amounting to plant height yielded a higher efficiency of MAS than r⫽0.74 forPSD(488, 4) andr⫽0.80 forPSD(122, 4). did the more conservative threshold of Pe ⱕ 0.02. In
cor-mum type I error rate to be used for the construction evaluating the prospects of MAS. When MAS for a spe-cific trait is tested, the success of MAS is predicted on of a selection index, because only two different
signifi-cance thresholds have been used. However, we believe the basis of results from a QTL mapping study generally performed with one or few segregating populations and that the choice of type I error rate warrants further
research. compared to the actual selection gain achieved in
an-other independent population from the same or a
dif-Variation of cross-validation-derived estimates ofpTS
ferent cross subjected to MAS. The difference between
and bias:As pointed out earlier, estimates ofh2 DS, p
…
TS, and
the bias varied tremendously among DS. Most authors the predicted and the realized selection gain corre-use the coefficient of determination from regressionR2 sponds to the difference between …p
ES and p
…
TS in this
study and therefore must be attributed to the bias of or R2
adj (Draper and Smith 1981) to present results
from QTL mapping studies and give an indication of estimating the genotypic variance explained in the QTL mapping experiment. As can be seen in Figure 3, there the phenotypic variance explained by markers.
How-ever, the proportion of the phenotypic variance ex- are quite a few DS with bias of 100%, where QTL ex-plaining a large proportion of the genotypic variance plained by markers is a function of the allocation of
resources and the trait under study. To obtain results could be identified in ES but no gain from selection would be realized in the TS sample. This was especially comparable across experiments with a varying number
of test environments, different sample sizes, and differ- pronounced for grain yield. In other DS, however, a considerable proportion of the variance explained by ent traits, the proportion of genotypic variance
ex-plained (p) is more appropriate. For each DS and each markers in ES could also be found in TS and would result in gain from selection if the TS had been used trait, the heritability was calculated and used for
ob-taining estimates of pTS (pˆTS ⫽ Rˆadj2 /hˆ2DS). Because Rˆ2adj for MAS. With LOD 3.21 there were quite a few DS
with zero bias for all traits, indicating that the entire andhˆ2
DS are both subject to sampling errors, estimates
ofpTSbeyond theoretical boundaries [0, 100] can occur. genotypic variance explained in the mapping
experi-ment would be useful in selection. This has to be inter-To warrant accurate estimation ofpTS, values of pˆTS
ex-ceeding theoretical boundaries were accepted (Allison preted with caution, however, because it could be the result of ES with 0 QTL detected. With LOD 2.5 and et al. 2002). In the experimental data of this study,
esti-mates ofh2
DSfor grain yield and grain moisture showed grain moisture and plant height it can be seen that the
minimum bias for most combinations of N andE was a large variation among DS as a consequence of
sam-pling. For grain yield with a plot heritability of h2 ⫽ ⵑ10%. This means that, depending on the sample used
for mapping, the maximum amount of genotypic vari-0.085, even four test environments (E⫽4) were
insuffi-ance explained by markers usable for selection would cient to obtain estimates of …pTS within theoretical
boundaries [0, 100] in all DS when the population size be only 10% less than the genotypic variance explained in the mapping experiment. These findings explain the was low (N⫽ 122). If individual DS with extreme
esti-controversial results from published experiments on mated values of…pTS occur, the mean over all DS (pTS)
MAS. Those MAS experiments that were successful is affected and the distribution of…pTSis skewed toward
larger values. This circumstance is reflected in the differ- might have estimated QTL effects with little or no bias in the mapping experiment. Those that were not suc-ence between the mean (pTS) and the median (p˜TS)
pro-portion of genotypic variance explained by QTL for cessful might have had biased QTL estimates or many false positive QTL due to sampling. IncreasingN and grain yield and smallNandE(Figure 2). On the basis
of these findings we conclude that cross-validation yields E helps to reduce the average bias and its range and, thus, provides a more realistic assessment of the pros-best results when a minimum sample size (N ⬎ 200)
and a minimum number of test environments (E⬎4) pects of MAS. Moreover, it also increasespTSand
conse-quently the efficiency of MAS as compared to pheno-are available for analysis. Hence, QTL experiments need
to be designed with special consideration of the popula- typic selection.
Choice of resampling method:The necessity for cor-tion size and the number of test environments
de-pending on the genetic architecture and the heritability rection of bias in estimates of QTL effects has been shown in this study and has been pointed out by several of the trait.
The sampling error of the heritability estimates also researchers performing simulation studies on QTL map-ping and the relative efficiency of MAS as compared to affected estimates of the magnitude of the bias. Since
the same estimate of h2
DS is used for calculation of pˆES phenotypic selection.Beavis(1994) suggested the use
of resampling methods for a realistic assessment of the andpˆTS, the difference between the genotypic variance
explained in ES as compared to TS was also inflated for prospects of MAS and to obtain unbiased estimates of QTL effects and of the proportion of genotypic variance DS with low h2
DS estimates, but the effect was not as
pronounced as for estimates of pTS. As expected, the explained by QTL. On the basis of experimental results
Utzet al.(2000) proposed three different cross-valida-population size had an effect not only on the average
study, the properties of cross-validation-derived esti- questionable whether⬎60% of the genotypic variance can be explained by markers with reasonable input be-mates of the genotypic variance explained by QTL have
been investigated using computer simulation data. For cause only QTL with small effects are likely to be segre-gating while at QTL with large effects favorable alleles the trait plant height, 21 QTL (list of QTL can be
re-trieved from http://www.maizegdb.org) were assumed are expected to be fixed. As a consequence, pure MAS for complex traits without additional phenotypic selec-to be the “true” QTL explaining 56% of the genotypic
variance. Six combinations of varying population size tion does not seem promising.
The proportion of genotypic variance that can be and number of test environments were evaluated. The
good agreement between estimates ofpTSandpSD:ESindi- explained by markers is trait specific. On the basis of our
results, some general recommendations can be given for cated that standard CV yielded almost unbiased
esti-mates of the true genotypic variance explained by QTL QTL mapping studies to maximize the proportion of genotypic variance explained:
(p) even for moderate sample sizes. Standard fivefold CV showed slightly lower power for QTL detection in
i. With limited resources, adding more genotypes is ES as compared to DS due to the 20% fewer individuals
more efficient than replicating the same genotypes. used for QTL estimation but on average the loss of
ii. Depending on the trait of interest, a minimum num-power in QTL estimation from DS to ES was reflected
ber of environments is necessary (E⬎ 4 with unre-in only a slight underestimation ofpSD:DSbypTS. In CV/
plicated trials) to allow for reliable estimation ofh2.
GE the underestimation of the true genotypic variance
iii. Optimization of the population size to be used in explained by QTL was more pronounced, especially for
QTL mapping experiments has to be trait specific smallNandE. This can be attributable to QTL⫻
envi-depending on the genetic architecture and plot her-ronment interactions. The sum of all estimated QTL⫻
itability of the trait as well as the total resources environment interaction effects adds up to zero and,
available. Increasing population size from 488 to therefore, these estimates are not stochastically
inde-976 was beneficial and had a relatively large effect pendent. With few test environments, the correlation
on the amount of genotypic variance explained, al-between effects cannot be ignored.
though the impact of increasing the population size A comparison of our results from CV with other
re-was more dramatic for smallerN. sampling methods yielded similar findings (Melchinger
iv. The choice of significance threshold depends on et al. 2003). The first 100 sampled DS were analyzed
the population size and also on the trait of interest. with three different bootstrapping (BS) methods: (i)
If the aim of a study is to identify the few large standard BS with bias correction as inEfronand
Tib-QTL regulating a limited proportion of the genetic shirani(1993), (ii) bias estimation as inBreimanand
variance, a more conservative threshold is recom-Spector(1992), and (iii) leave-one-out BS or 0.368 BS
mended because the frequency of QTL detection as in Efron (1983). Results from all three methods
is correlated with the size of QTL effects and the showed underestimation of the true genotypic variance
reliability of finding the large QTL is improved. explained by QTL similar to CV/GE. In addition to its
preferable statistical properties, standard CV is compu- For traits regulated by a few QTL with large (⬎0.2
P)
tationally less resource demanding than CV/GE and effects, for which phenotypic selection is expensive or BS. We therefore recommend standard CV for analysis hampered due to rare occurrence in the field, MAS can of QTL mapping data to obtain asymptotically unbiased be efficiently used. The finesse of the breeder will be estimates of the true QTL effects and the genotypic to find the optimum allocation of resources for de-variance explained by markers. tecting QTL and to obtain a realistic assessment of the
Recommendations for QTL mapping experiments: genotypic variance explained by them for combining
Our results from cross-validation of experimental data MAS with phenotypic selection. agreed well with the results from simulation
experi-ments on MAS (Beavis1998;Moreauet al.1998) con-cerning the effect of population size, number of test
LITERATURE CITED
environments, and LOD threshold. When performing
Allison, D. B., J. R. Fernandez, H. Moonseong, Z. Shankuan, C.
QTL mapping experiments to identify QTL and assess
Etzel et al., 2002 Bias in estimates of quantitative-trait-locus
the prospects of MAS, attention must be given to the
effect in genome scans: demonstration of the phenomenon and genetic architecture of a quantitative trait. For resistance a method-of-moments procedure for reducing bias. Am. J. Hum.
Genet.70:575–585. or quality traits, a model assuming few (⬍10) QTL with
Beavis, W. D., 1994 The power and deceit of QTL experiments:
relatively large effects and high probability of explaining
lessons from comparative QTL studies. 49th Annual Corn and a considerable proportion of the genotypic variance Sorghum Industry Research Conference. ASTA, Washington, DC,
pp. 250–266. with markers might be suitable. For polygenic traits like
Beavis, W. D., 1998 QTL analyses: power, precision and accuracy,
grain yield, however, Fisher’s (1918) infinitesimal
pp. 145–162 in Molecular Dissection of Complex Traits, edited by model seems more realistic especially when analyzing A. H.Paterson. CRC Press, Boca Raton, FL.
Bennewitz, J., N. ReinschandE. Kalm, 2002 Improved confidence
intervals in quantitative trait loci mapping by permutation boot- Knapp, S. J., andW. C. Bridges, 1990 Using molecular markers to estimate quantitative trait locus parameters: power and genetic strapping. Genetics160:1673–1686.
variances for unreplicated and replicated progeny. Genetics126:
Bost, B., D. de Vienne, F. Hospital, L. MoreauandC. Dillmann,
769–777. 2001 Genetic and nongenetic bases for theL-shaped
distribu-Knapp, S. J., W. W. StroupandW. M. Ross, 1985 Exact confidence
tion of quantitative trait loci effects. Genetics157:1773–1787.
intervals for heritability on a progeny mean basis. Crop Sci.25:
Bouchez, A., F. Hospital, M. Causse, A. GallaisandA.
Charcos-192–194.
set, 2002 Marker-assisted introgression of favorable alleles at
Lande, R., and R. Thompson, 1990 Efficiency of marker-assisted
quantitative trait loci between maize elite lines. Genetics162:
selection in the improvement of quantitative traits. Genetics124:
1945–1959.
743–756.
Breiman, L., andP. Spector, 1992 Submodel selection and
evalua-Lynch, M., andB. Walsh, 1998 Genetics and Analysis of Quantitative
tion in regression. TheX-random case. Int. Stat. Rev.60:291–319.
Traits.Sinauer Associates, Sunderland, MA.
Doerge, R. W., andG. A. Churchill, 1996 Permutation tests for
Melchinger, A. E., H. F. UtzandC. C. Scho¨ n, 2003 New
develop-multiple loci affecting a quantitative character. Genetics142:
ments in the biometric analysis of complex traits. Proceedings 285–294.
of 12th Meeting of the EUCARPIA Section Biometrics in Plant
Draper, N. R., andH. Smith, 1981 Applied Regression Analysis, Ed.
Breeding. September 3–5, 2003, A Corun˜a, Spain (in press). 2. Wiley & Sons, New York.
Miller, A. J., 1990 Subset Selection in Regression. Chapman & Hall,
Efron, B., 1983 Estimating the error rate of a prediction rule: im- London.
provement on cross-validation. J. Am. Stat. Assoc.78(382): 316– Moreau, L., A. Charcosset, F. Hospital and A. Gallais, 1998 330. Marker-assisted selection efficiency in populations of finite size.
Efron, B., andR. J. Tibshirani, 1993 An Introduction to the Bootstrap. Genetics148:1353–1365.
Chapman & Hall, New York. Openshaw, S., andE. Frascaroli, 1997 QTL detection and
marker-Falconer, D. S., andT. F. C. Mackay, 1996 Introduction to Quantita- assisted selection for complex traits in maize. 52nd Annual Corn
tive Genetics. Longman, London. and Sorghum Industry Research Conference. ASTA, Washington,
Fisher, R. A., 1918 The correlation between relatives on the supposi- DC, pp. 44–53.
tion of Mendelian inheritance. Trans. R. Soc. Edinb.52:399–433. Sambrook, J., E. F. FritschandT. Maniatis, 1989 Molecular
Clon-Fridman, E., T. PlebanandD. Zamir, 2000 A recombination hot- ing: A Laboratory Manual. Cold Spring Harbor Laboratory Press,
spot delimits a wild-species quantitative trait locus for tomato Cold Spring Harbor, NY.
sugar content to 484 bp within an invertase gene. Proc. Natl. Searle, S. R., 1971 Linear Models. Wiley & Sons, New York. Acad. Sci. USA97(9): 4718–4723. Snedecor, G. W., andW. G. Cochran, 1989 Statistical Methods. Iowa
Frisch, M., M. BohnandA. E. Melchinger, 2000 Plabsim: software State University Press, Ames, IA.
Utz, H. F., andA. E. Melchinger, 1994 Comparison of different
for simulation of marker-assisted backcrossing. J. Hered. 91:
approaches to interval mapping of quantitative trait loci, pp. 86–87.
195–204 inBiometrics in Plant Breeding: Applications of Molecular
Go¨ ring, H. H. H., J. D. TerwilligerandJ. Blangero, 2001 Large
Markers.Proceedings of the Ninth Meeting of the EUCARPIA Section
upward bias in estimation of locus-specific effects from
genome-Biometrics in Plant Breeding, edited by J. W.Van Ooijenand J. wide scans. Am. J. Hum. Genet.69:1357–1369.
Jansen. July 6–8, 1994, CPRO-DLO, Wageningen, The
Nether-Haley, C. S., andS. A. Knott, 1992 A simple regression method
lands. for mapping quantitative trait loci in line crosses using flanking
Utz, H. F., and A. E.Melchinger, 1996 PLABQTL: a program for markers. Heredity69:315–324.
composite interval mapping of QTL. J. Quant. Trait Loci2(1):
Hjorth, J. S.U., 1994 Computer Intensive Statistical Methods. Validation
1–5.
Model Selection and Bootstrap.Chapman & Hall, London.
Utz, H. F., A. E. Melchinger andC. C. Scho¨ n, 2000 Bias and
Holloway, J. L., andS. J. Knapp, 1993 G-MENDEL 3.0 Software for
sampling error of the estimated proportion of genotypic variance
the Analysis of Genetic Markers and Maps. Oregon State University,
explained by quantitative trait loci determined from experimen-Corvallis, OR.
tal data in maize using cross validation and validation with
inde-Holm, S., 1979 A simple sequentially rejective multiple test
proce-pendent samples. Genetics154:1839–1849. dure. Scand. J. Stat.6:65–70.
Yousef, G. G., andJ. A. Juvik, 2001 Comparison of phenotypic and
Jansen, R. C., andP. Stam, 1994 High resolution of quantitative marker-assisted selection for quantitative traits in sweet corn.
traits into multiple loci via interval mapping. Genetics136:1447– Crop Sci.41:645–655.
1455. Zeng, Z-B., 1994 Precision mapping of quantitative trait loci.
Genet-Knapp, S. J., 1998 Marker-assisted selection as a strategy for increas- ics136:1457–1468.
ing the probability of selecting superior genotypes. Crop Sci.38: