ISSN(Online): 2319-8753 ISSN (Print): 2347-6710
I
nternational
J
ournal of
I
nnovative
R
esearch in
S
cience,
E
ngineering and
T
echnology
(A High Impact Factor, Monthly, Peer Reviewed Journal) Visit: www.ijirset.com
Vol. 6, Issue 10, October 2017
Assimilative Capacity and Air Quality Index
Studies of the Atmosphere in Hebbal
Industrial Area, Mysuru
Prakash, B. M. 1, Shobhan Majumder 2, Mahadeva Swamy, M. 3, Mahesh, S. 4
Environmental Officer, Karnataka State Pollution Control Board (KSPCB), Mysuru, Karnataka, India.1
M.Tech Research Scholar, Department of Environmental Engineering, Sri Jayachamarajendra College of Engineering,
Mysuru, Karnataka, India 2
Professor, Department of Environmental Engineering, Sri Jayachamarajendra College of Engineering,
Mysuru, Karnataka, India.3, 4
ABSTRACT: Industrialization and increase in density of vehicle are being the major concerns of air pollution in urban areas. Focused on assimilative capacity of the atmosphere and determination of air quality index (AQI) of industrial areas are of more concern in the allocation of new industries in the existing industrial areas of towns and cities. Air quality monitoring studies were conducted from November, 2016 to June, 2017 at Hebbal industrial area, Mysuru, Karnataka, India. The wind rose plots during winter indicated the predominant wind was blowing from E (90°) and ENE (68°) and during summer wind was blowing from SW (225°) and WSW (248°) towards NE (45°) and ENE (68°). A maximum wind speed of 7.77 m/s was observed during monsoon season. The results of Ambient Air Quality Monitoring Studies (AAQMS) at Hebbal Industrial area showed, during winter season PM10 and PM2.5 concentrations
were found to be 177.3 and 64.2 μg/m3, respectively at Location 1, which was more than the National Ambient Air
Quality Standard (NAAQS) of 100 and 60 μg/m3, respectively. NOx and SO2 concentrations at Hebbal industrial area,
were found to be within NAAQS of 80 μg/m3. The average ventilation coefficient (VC) observed to be highest during
summer season (7631 m2/s at 16:00 h) followed by winter (5009 m2/s at 15:00 h) and lowest during monsoon season (4114 m2/s at 16:00 h). Assimilative capacity for PM10, PM2.5, NOx and SO2 during summer and monsoon seasons were noticed to be within the permissible limits. During winter season Air Quality Index (AQI) was found to be ‘moderate’ at location 1 and 2, due to high pollution load, implying a ‘poor’ air quality during winter season. However, during summer AQI was found to be ‘satisfactory’ at all the locations and in monsoon season AQI at location 2 and 3 was found to be ‘good’ due to the occurrence of precipitation and unstable atmospheric conditions.
KEYWORDS:Diurnal variation,Assimilative capacity, Ventilation coefficient, Pollution potential, Air Quality Index. I. INTRODUCTION
ISSN(Online): 2319-8753 ISSN (Print): 2347-6710
I
nternational
J
ournal of
I
nnovative
R
esearch in
S
cience,
E
ngineering and
T
echnology
(A High Impact Factor, Monthly, Peer Reviewed Journal) Visit: www.ijirset.com
Vol. 6, Issue 10, October 2017
pollutants such as, ozone, nitrogen dioxide and phosgene, which are poorly soluble in water, can induce lung vascular leakage and inflammation [10,22]. The major source of sulfur dioxide (SO2) into the atmosphere is from combustion of fossil fuels in the power plants and other industrial facilities [5,35]. Inhalation of SO2, chlorine and ammonia induce undesirable changes in the nasopharyngeal region and upper airways in humans due to their high water solubility [21,26,28,46]. Further, sources of particulate matter (PM) include emissions from power plants, large industries, vehicular emission, domestic fuel burning [39], which causes adverse effects on human health such as, lung disease, increased cancer risk, and increased risk of cell mutations [6,7,9,18,19,27].
Meteorological parameter is one of the important factors that control the air pollution in terms of dilution, mixing and dispersion of air pollutants [12,14,23,30]. The assimilative capacity of air environment is defined as the maximum amount of pollution load that can be discharged without violating the best designated use of the air resource in the planning region [12]. Singh et al. (1990) have analysed the dispersion of SO2, suspended particulate matter (SPM) and NOx pollutants over Delhi city, India [41]. Assimilative capacity of the atmosphere was also studied by Nandankar (1999) for Lucknow city, India [31]. Earlier various researchers have calculated ventilation coefficient and pollution load to understand the assimilative potential of the atmosphere such as, Padmanabhamurty and Mandal, 1979 (Delhi) [33]; Manju et al., 2002 (Manali) [30]; Goyal et al., 2003 (Delhi) [13]; Krishna et al., 2004 (Visakhapatnam) [23]; Goyal et al., 2005 (Gangtok) [11]; Goyal and Rao, 2007 (Kochi) [14]; Thepanondh and Jitbantoung, 2014 (Dawai) [44] and Thawonkaew et al., 2016 (Thailand) [43]. Rao et al. (2015) found maximum VC during pre-monsoon followed by monsoon, post-monsoon and winter season in Visakhapatnam [37]. On the other hand, Sarella and Khambete (2015) showed moderately polluted air quality index for Vapi city, Gujarat, India [38]. Chaurasia et al. (2013) have reported that, AQI was found to be ‘moderate’ in terms of PM10 and PM2.5 concentration at selected receptor points in Bhopal city [8]. Kumar and Kriti (2016) have stated, AQI of Jaipur City, Rajasthan, India was found to be ‘poor’ in terms of PM10 concentration [24]. The analysis of air quality in Delhi city, India, showed a gradual deterioration in terms AQI values from 2005 onwards [29]. Thilagaraj et al. (2014) have reported, Kilpauk is being the most polluted place in Chennai city which is based on AQI values [45]. Mysuru is experiencing a deteriorated ambient air quality due to industrialization and vehicular fleet. Based on the vehicle growth during the last few years, it is observed that, the vehicle growth in Mysore city is about 8 to 9 % p.a. and 2-wheelers constitute more than 75 % of total vehicular population. The total number of vehicles which was about 6000 in 1970 increased to 1.45 lakhs in 1996, 3.55 lakhs in 2005 and the current vehicle population is 6.5 lakhs (2014). In most of the air pollutant dispersion studies very few researchers have worked on the identification of Assimilative Capacity and Air Quality Index (AQI) of Mysuru city. Hence, the aim of the present study is to determine the Ambient Air Quality (AAQ) and Air Quality Index (AQI) of Hebbal industrial area and also to identify the assimilative capacity based on Ventilation Coefficient (VC) and pollution potential.
II. STUDY AREA
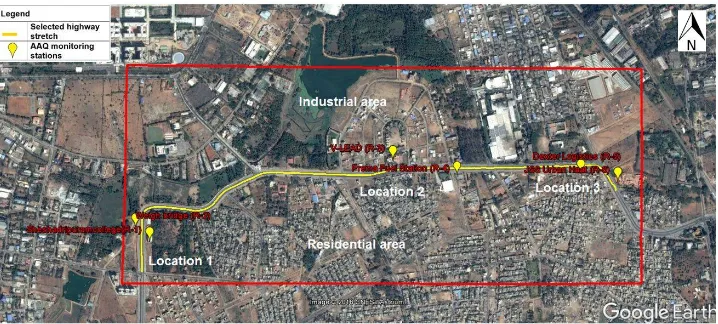
The cleanest city of the South-Western state of Karnataka i.e., Mysuru is geographically located at 12° 18' N and 76° 39' E. Major industrial areas are located in North-Western part of Mysuru, within radius of 7 km from the city centre and the industrial area is well connected by State Highway (SH) and broad ring roads [34]. The Hebbal industrial area is located North-West part of the study area. Three monitoring stations along the highway (Figure 1) with 1 km interval were selected for Ambient Air Quality Monitoring (AAQM) with 6 receptor points these include: Seshadripuram College (R1), Weigh Bridge (R2), V-LEAD Institute (R3), Prema Fuel Station (R4), Dexter Logistics (R5) and JSS Urban Haat (R6).
III. MATERIALS AND METHODS
Meteorological data
ISSN(Online): 2319-8753 ISSN (Print): 2347-6710
I
nternational
J
ournal of
I
nnovative
R
esearch in
S
cience,
E
ngineering and
T
echnology
(A High Impact Factor, Monthly, Peer Reviewed Journal) Visit: www.ijirset.com
Vol. 6, Issue 10, October 2017
seasons from the website www.wunderground.com [51], which were used for plotting diurnal and seasonal variation of meteorological parameters.
Fig. 1. Study area showing the AAQM locations along the highway passing through the industrial area of Mysuru.
Ambient air quality monitoring (AAQM)
Ambient Air Quality (AAQ) was monitored from November, 2016 to June, 2017, considering winter, summer and monsoon seasons at three identified locations with six receptor points along the highway passing through industrial area of Mysuru city for PM10, PM2.5, NOx and SO2 air pollutants. The monitored air pollutant concentrations were used to calculate the assimilative capacity in terms of pollution potential and as well as air quality index of the study area.
Assimilative capacity of the atmosphere
Assimilative capacity refers to the ability of the environment to carry the pollutants without adverse effects on the environment or on users of its resources. Manju et al. (2002) have stated that, assimilative capacity of the atmosphere determines the maximum pollutant load that can be discharged into the atmosphere without violating the best-designed use of air resources in the planning region [30]. The assimilative capacity of the atmosphere can be determined using two approaches. The first approach is based on ventilation coefficient, which can be calculated by meteorological parameters and the second approach is based on pollution potential due to the presence of various air pollution sources in the study area. The pollution potential indicates the capacity of the atmosphere to dilute the pollutants and the resulting effects on quality of air [13].
Assimilative capacity based on ventilation coefficient
In the present study assimilative capacity of the environment was calculated by ventilation coefficient approach, using eqn. (1).
Ventilation coefficient (m2/s) = Wind speed (m/s) x MMD (m) (1)
The United State National Meteorological Centre and Atmospheric Environment Services, Canada, has classified that, the assimilative capacity of the atmosphere will be considered as ‘low’ if the ventilation coefficient is < 6000 m2/s (during afternoon), mean wind speeds < 4 m/s and mixing depths < 500 m (during morning) [15,42].
Assimilative capacity based on pollution potential
ISSN(Online): 2319-8753 ISSN (Print): 2347-6710
I
nternational
J
ournal of
I
nnovative
R
esearch in
S
cience,
E
ngineering and
T
echnology
(A High Impact Factor, Monthly, Peer Reviewed Journal) Visit: www.ijirset.com
Vol. 6, Issue 10, October 2017
Available assimilation potential = Permissible standard – Pollutant concentration (2)
Air Quality Index (AQI)
The AQI is an index for reporting daily air quality. It indicates about air quality of any location and associated health effects due to the air quality. The AQI focuses on health effects that may experience within a few hours or days after breathing polluted air. In the present study AQI was calculated using eqn. (3).
P PLO
LO PLOPHI LO HI
P C B I
B B
I I
I
* (3)
Where, IP is AQI for pollutant “P”, CP is the actual ambient concentration of pollutant “P”, BPHI is the upper end breakpoint concentration that is greater than or equal to CP, BPLO is the lower end breakpoint concentration that is less than or equal to CP, ILO is the sub index or AQI value corresponding to BPLO, IHI is the sub index or AQI value corresponding to BPHI.
IV. RESULTS AND DISCUSSION
Meteorological data
Dispersion of air pollutants depend upon various meteorological factors, hence, the hourly meteorological data were collected and used to plot monthly and seasonal variation of wind velocity, temperature, relative humidity.
Seasonal variation of temperature and relative humidity
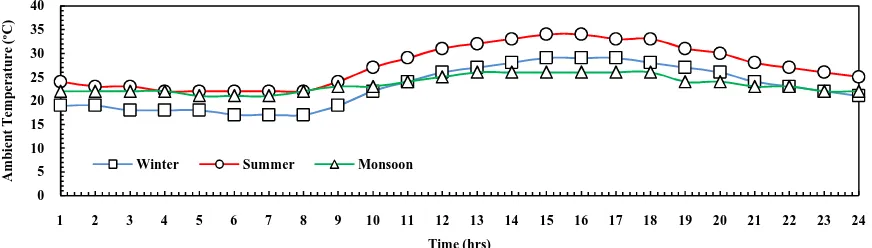
Ambient temperature and relative humidity data were collected for winter, summer and monsoon seasons for the study area. Temperature was found to be minimum at 03:00 to 07:00 h (Figure 2) and it gradually increased and reached peak at 14:00 to 16:00 h and there onwords decreased in all the seasons. A maximum temperature of 37°C was observed during summer and a minimum temperature of 15°C was noticed during winter season. Average temperature was varying from 24°C to 28°C during the entire study period. Further, maximum relative humidity (RH) was found to be 96% during pre-monsoon and a minimum of 19% was noticed during winter season. RH was maximum at 02:00 to 07:00 h and it gradually decreased and reached the minimum at 14:00 to 17:00 h and then started increasing (Figure 3). However, during monsoon not much variation of temperature and RH were observed. It was also observed that temperature and RH were inversely proportional to each other.
Seasonal variation of Mean Mixing Depth (MMD) and stability class of atmosphere
The variation of MMD was mainly due to variations in ambient temperature as well as wind speed. However, from the diurnal variation of MMD (Figure 4) it was found that, MMD was very low i.e., less than 100 m during morning / late night hours from 01:00 h to 07:00 h. Highest MMD value was observed between 13:00 h to 16:00 h, which found to be 1808 m, 1417 m and 1137 m, during summer, winter and monsoon seasons, respectively. The lower values of mixing height during late night and early morning hours could be due to the occurrence of ground based inversions that hamper dispersion [33]. Atmospheric stability (Pasquill classification, A – F / 1-6) are compiled by using wind speed, cloud cover and solar insulation following Turner’s (1969) table [47]. Stability class 5 (E) and 6 (F) prevailed from 22:00 h to 06:00 h during winter and monsoon seasons (Figure 5). Atmospheric stability gradually changed to unstable condition (1-2) from 06:00 h on-words due to sunrise which increases the atmospheric temperature. The air mass reached the highly unstable class at midday when wind speed was maximum indicating high MMD and better mixing of pollutants during daytime. However, during night time atmosphere became stable which indicated a poor mixing during late night time.
Seasonal variation of wind speeds and wind directions
ISSN(Online): 2319-8753 ISSN (Print): 2347-6710
I
nternational
J
ournal of
I
nnovative
R
esearch in
S
cience,
E
ngineering and
T
echnology
(A High Impact Factor, Monthly, Peer Reviewed Journal) Visit: www.ijirset.com
Vol. 6, Issue 10, October 2017
was found to be minimum at 01:00 to 07:00 h and it gradually increased due to sunrise and reached peak values at 14:00 to 17:00 h and there on-words started decreasing during winter and summer seasons. However, during monsoon season, wind velocities were found to be maximum, indicating dispersion of pollutants. A maximum wind speed of 7.77 m/s was noticed during monsoon season and a minimum wind speed of 0.55 m/s was noticed during winter season.
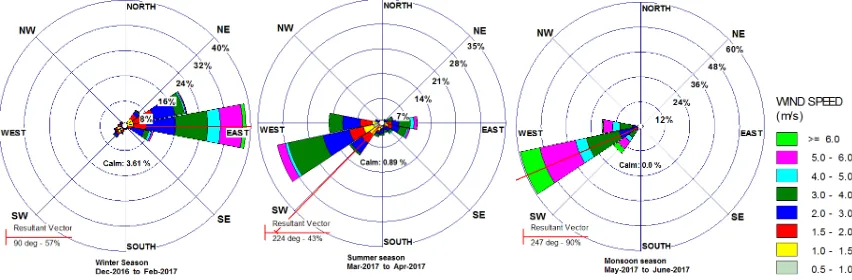
The wind rose plots for winter season (Figure 7) showed the predominant wind was blowing from E (90°) and ENE (68°) directions. The average wind velocity was observed 2–3 m/s during December, 2016. However, during January and February average wind speeds were found to be 3–4 m/s. The resultant vector of wind directions for winter season to summer season showed, wind direction was changing from E direction to WSW direction. However, from the wind rose plots of summer season (Figure 7) it was observed that, predominant wind was blowing from SW (225°) and WSW (248°) towards NE (45°) and ENE (68°) directions, respectively. The average wind speed of 1.5-3 m/s was observed during March and 3–4 m/s was observed during April. The resultant vector of wind directions for summer season to monsoon season (Figure 7) showed wind direction was changing from SW direction to WSW direction.
Fig. 2. Diurnal variation of ambient temperature during winter, summer and monsoon seasons over Mysuru city.
Fig. 3. Diurnal variation of relative humidity during winter, summer and monsoon seasons over Mysuru city.
Fig. 4. Diurnal variation of mixing heights during winter, summer and monsoon seasons over Mysuru city.
0 5 10 15 20 25 30 35 40
1 2 3 4 5 6 7 8 9 10 11 12 13 14 15 16 17 18 19 20 21 22 23 24
A
m
b
ie
n
t
T
em
p
er
a
tu
re
(
ºC
)
Time (hrs)
Winter Summer Monsoon
0 20 40 60 80 100
1 2 3 4 5 6 7 8 9 10 11 12 13 14 15 16 17 18 19 20 21 22 23 24
R
el
a
ti
v
e
H
u
m
id
it
y
(
%)
Time (hrs)
Winter Summer Monsoon
0 500 1000 1500 2000
1 2 3 4 5 6 7 8 9 10 11 12 13 14 15 16 17 18 19 20 21 22 23 24
M
ix
in
g
H
ei
g
h
t
(m
)
Time (hrs)
ISSN(Online): 2319-8753 ISSN (Print): 2347-6710
I
nternational
J
ournal of
I
nnovative
R
esearch in
S
cience,
E
ngineering and
T
echnology
(A High Impact Factor, Monthly, Peer Reviewed Journal) Visit: www.ijirset.com
Vol. 6, Issue 10, October 2017
Fig. 5. Diurnal variation of atmospheric stability class during winter, summer and monsoon seasons over Mysuru city.
Fig. 6. Diurnal variation of wind speeds during winter, summer and monsoon seasons over Mysuru city.
Fig. 7. Windrose plots for winter, summer and monsoon season over Mysuru city.
Ambient air quality monitoring (AAQM)
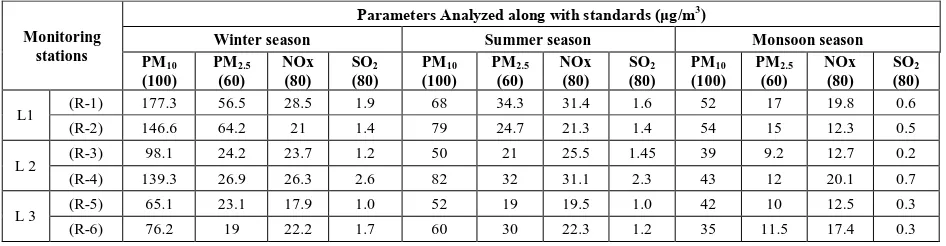
The AAQM was conducted for 8 hours from 10.00 am to 06.00 pm for the pollutants such as, PM10, PM2.5, NOx and SO2. The observed pollutant concentration during winter, summer and monsoon seasons are presented in Table 1. NOx and SO2 concentrations in all the receptor points monitored were found to be within the permissible
limits of National Ambient Air Quality Standards (NAAQS) [32] of 80 μg/m3. However, PM10 concentration at location
1 was found to be exceeding the NAAQS [32] of 100 μg/m3 during winter season. Further, PM2.5 concentration was
also found to be within NAAQS [32] of 60 μg/m3 at all the receptor points except during winter season at location 1.
The Ambient Air Quality (AAQ) study conducted by Prakash et al. (2015 and 2016) in the industrial area of Mysuru
0 1 2 3 4 5 6
1 2 3 4 5 6 7 8 9 10 11 12 13 14 15 16 17 18 19 20 21 22 23 24
S
ta
b
il
it
y
c
la
ss
(
1
-6
)
Time (hrs)
Winter Summer Monsoon
0.0 1.0 2.0 3.0 4.0 5.0 6.0 7.0 8.0
1 2 3 4 5 6 7 8 9 10 11 12 13 14 15 16 17 18 19 20 21 22 23 24
Wi
n
d
s
p
ee
d
(
m
/s
)
Time (hrs)
Winter Summer
ISSN(Online): 2319-8753 ISSN (Print): 2347-6710
I
nternational
J
ournal of
I
nnovative
R
esearch in
S
cience,
E
ngineering and
T
echnology
(A High Impact Factor, Monthly, Peer Reviewed Journal) Visit: www.ijirset.com
Vol. 6, Issue 10, October 2017
have also observed similar results for PM10 and PM2.5 of exceeded pollutant concentration during winter season due to calm atmospheric condition [34,35].
Table 1: Results of Ambient Air Quality Monitored data during winter, summer and monsoon season.
Monitoring stations
Parameters Analyzed along with standards (μg/m3)
Winter season Summer season Monsoon season
PM10 (100)
PM2.5 (60)
NOx (80)
SO2 (80)
PM10 (100)
PM2.5 (60)
NOx (80)
SO2 (80)
PM10 (100)
PM2.5 (60)
NOx (80)
SO2 (80)
L1 (R-1) 177.3 56.5 28.5 1.9 68 34.3 31.4 1.6 52 17 19.8 0.6
(R-2) 146.6 64.2 21 1.4 79 24.7 21.3 1.4 54 15 12.3 0.5
L 2 (R-3) 98.1 24.2 23.7 1.2 50 21 25.5 1.45 39 9.2 12.7 0.2
(R-4) 139.3 26.9 26.3 2.6 82 32 31.1 2.3 43 12 20.1 0.7
L 3 (R-5) 65.1 23.1 17.9 1.0 52 19 19.5 1.0 42 10 12.5 0.3
(R-6) 76.2 19 22.2 1.7 60 30 22.3 1.2 35 11.5 17.4 0.3
Carrying capacity based on ventilation coefficient (VC)
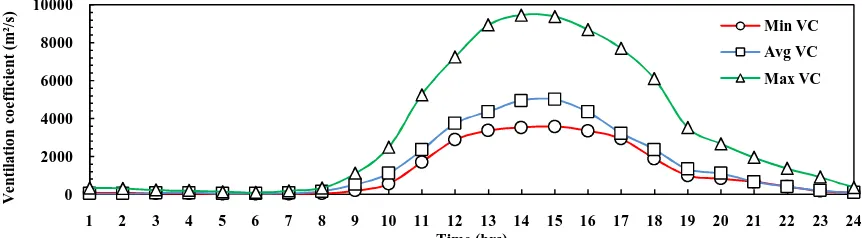
The ventilation coefficient (VC) is directly proportional to the carrying capacity / assimilative potential of the atmosphere and had been calculated using MMD and wind speeds (Eqn. 1) during winter, summer and monsoon seasons. The hourly computed VC showed a similar diurnal trend in all the three seasons. The United State National Meteorological Centre has classified that, the assimilative capacity of the atmosphere will be considered as ‘low’ if the ventilation coefficient is < 6000 m2/s, mean wind speeds < 4 m/s and mixing depths < 500 m [15,42]. In the present investigation ventilation coefficient was computed and found to be very low (< 2000 m2/s) during early morning (01:00 – 09:00 h) and evening / late night hours (20:00 – 24:00 h), which indicated a high pollution potential or low assimilative capacity during these periods (Figures 8-10). During winter season (Figure 8), VC was found to be maximum of 9447 m2/s (at 14:00 h). However, during low wind period, VC was found to be < 6000 m2/s throughout the day. Further, during summer season (Figure 9) maximum VC was found to be 12053 m2/s, indicating a better dispersion capacity of the atmosphere. Maximum VC during monsoon season (Figure 10) was found to be 8132 m2/s. The average ventilation coefficient (Figures 8-10) was found to be highest in summer season (7631 m2/s at 16:00 h) followed by winter (5009 m2/s at 15:00 h) and lowest in monsoon season (4114 m2/s at 16:00 h). This indicates low pollution potential or high assimilative capacity in summer season as compared to winter and monsoon seasons. Afternoon VCs were found to be higher (> 5500 m2/s) during winter, summer and monsoon seasons, but only for a couple of hours (14:00 – 17:00 h), implying low pollution potential and better assimilative capacity of the atmosphere. Thus, it can be concluded that, the VC simply provides a broad indication of the dispersion potential in terms of low (< 2000 m2/s), medium (2000 – 6000 m2/s) or high (> 6000 m2/s) of the atmosphere. But it does not give any idea about the amount of emission loads that can be assimilated in the given airshed of the region. Viswanadham and Kumar have stated that, with the increase in solar radiation (as the day advances) VC also increases and reached a maximum value during afternoon hours [48]. However, Goyal and Rao (2007) at Kochi region found that, maximum VC was estimated as 7920 m2/s (at 15:00 h) in summer followed by 6192 m2/s (at 16:00 h) in winter, 3076 m2/s (at 14:00 h) in the monsoon and 4645 m2/s (at 16:00 h) in post-monsoon season [14].
Carrying capacity based on emission loads
ISSN(Online): 2319-8753 ISSN (Print): 2347-6710
I
nternational
J
ournal of
I
nnovative
R
esearch in
S
cience,
E
ngineering and
T
echnology
(A High Impact Factor, Monthly, Peer Reviewed Journal) Visit: www.ijirset.com
Vol. 6, Issue 10, October 2017
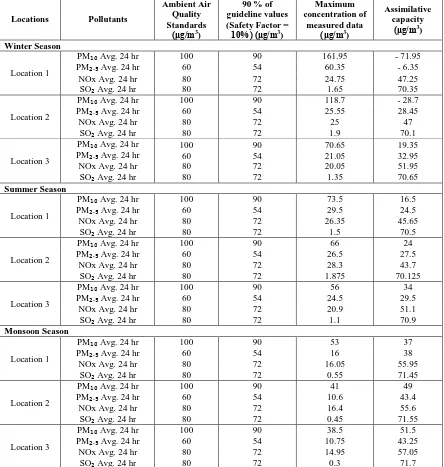
observed during the sampling time in winter season. However, PM2.5 was found to be exceeding limiting value of 60 μg/m3 during winter season at location 1. Further, pollutants such as NOx and SO2 were found to be within 90 % of guideline values at all the locations during winter season. On the other hand, SO2 concentrations were found to be lowest because of low emission rate of SO2 from the industries as well as from vehicles. Hence, maximum assimilative
capacity of more than 70 μg/m3 was found for SO2. Assimilative capacity studies during summer season (Table 2)
reflected all pollutants were within 90 % of guideline values at all the locations. The assimilative capacity of PM10 was found to be poor at Location 1 and 2 due to fugitive emissions during summer season.
Fig. 8. Diurnal variation of minimum, average and maximum ventilation coefficient during winter season over Mysuru city.
Fig. 9. Diurnal variation of minimum, average and maximum ventilation coefficient during summer season over Mysuru city.
Fig. 10. Diurnal variation of minimum, average and maximum ventilation coefficient during monsoon season over Mysuru city. 0 2000 4000 6000 8000 10000
1 2 3 4 5 6 7 8 9 10 11 12 13 14 15 16 17 18 19 20 21 22 23 24
V e n ti la ti o n c o e ffi c ie n t (m ²/ s) Time (hrs) Min VC Avg VC Max VC 0 2000 4000 6000 8000 10000 12000 14000
1 2 3 4 5 6 7 8 9 10 11 12 13 14 15 16 17 18 19 20 21 22 23 24
V e n ti la ti o n c o e ffi c ie n t (m ²/ s) Time (hrs) Min VC Avg VC Max VC 0 2000 4000 6000 8000 10000
1 2 3 4 5 6 7 8 9 10 11 12 13 14 15 16 17 18 19 20 21 22 23 24
ISSN(Online): 2319-8753 ISSN (Print): 2347-6710
I
nternational
J
ournal of
I
nnovative
R
esearch in
S
cience,
E
ngineering and
T
echnology
(A High Impact Factor, Monthly, Peer Reviewed Journal) Visit: www.ijirset.com
Vol. 6, Issue 10, October 2017
Table 2: Assimilative capacity of the atmosphere during winter, summer and monsoon seasons.
Locations Pollutants
Ambient Air Quality Standards
(μg/m3)
90 % of guideline values (Safety Factor = 10%) (μg/m3)
Maximum concentration of
measured data (μg/m3)
Assimilative capacity
(μg/m3)
Winter Season
Location 1
PM₁₀ Avg. 24 hr 100 90 161.95 - 71.95 PM₂.₅ Avg. 24 hr 60 54 60.35 - 6.35
NOx Avg. 24 hr 80 72 24.75 47.25
SO₂ Avg. 24 hr 80 72 1.65 70.35
Location 2
PM₁₀ Avg. 24 hr 100 90 118.7 - 28.7
PM₂.₅ Avg. 24 hr 60 54 25.55 28.45
NOx Avg. 24 hr 80 72 25 47
SO₂ Avg. 24 hr 80 72 1.9 70.1
Location 3
PM₁₀ Avg. 24 hr 100 90 70.65 19.35
PM₂.₅ Avg. 24 hr 60 54 21.05 32.95
NOx Avg. 24 hr 80 72 20.05 51.95
SO₂ Avg. 24 hr 80 72 1.35 70.65
Summer Season
Location 1
PM₁₀ Avg. 24 hr 100 90 73.5 16.5
PM₂.₅ Avg. 24 hr 60 54 29.5 24.5
NOx Avg. 24 hr 80 72 26.35 45.65
SO₂ Avg. 24 hr 80 72 1.5 70.5
Location 2
PM₁₀ Avg. 24 hr 100 90 66 24
PM₂.₅ Avg. 24 hr 60 54 26.5 27.5
NOx Avg. 24 hr 80 72 28.3 43.7
SO₂ Avg. 24 hr 80 72 1.875 70.125
Location 3
PM₁₀ Avg. 24 hr 100 90 56 34
PM₂.₅ Avg. 24 hr 60 54 24.5 29.5
NOx Avg. 24 hr 80 72 20.9 51.1
SO₂ Avg. 24 hr 80 72 1.1 70.9
Monsoon Season
Location 1
PM₁₀ Avg. 24 hr 100 90 53 37
PM₂.₅ Avg. 24 hr 60 54 16 38
NOx Avg. 24 hr 80 72 16.05 55.95
SO₂ Avg. 24 hr 80 72 0.55 71.45
Location 2
PM₁₀ Avg. 24 hr 100 90 41 49
PM₂.₅ Avg. 24 hr 60 54 10.6 43.4
NOx Avg. 24 hr 80 72 16.4 55.6
SO₂ Avg. 24 hr 80 72 0.45 71.55
Location 3
PM₁₀ Avg. 24 hr 100 90 38.5 51.5
PM₂.₅ Avg. 24 hr 60 54 10.75 43.25
NOx Avg. 24 hr 80 72 14.95 57.05
SO₂ Avg. 24 hr 80 72 0.3 71.7
ISSN(Online): 2319-8753 ISSN (Print): 2347-6710
I
nternational
J
ournal of
I
nnovative
R
esearch in
S
cience,
E
ngineering and
T
echnology
(A High Impact Factor, Monthly, Peer Reviewed Journal) Visit: www.ijirset.com
Vol. 6, Issue 10, October 2017
PM10concentration at all the selected receptors in iron ore mining region of Goa were observed far below the
permissible limit of 60 μg/m3. However, Goyal and Rao (2007) [14] reported highest SO2 concentrations were observed
in the industrial area of Kochi, India, followed by commercial and residential areas, reflecting a lowest assimilative capacity in the industrial area.
Air Quality Index (AQI)
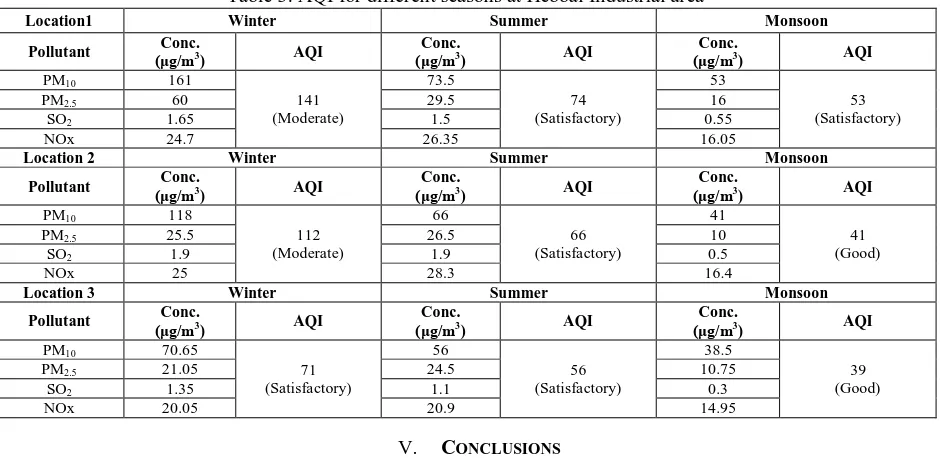
National Air Quality Index (AQI) transforms complex air quality data of eight pollutants into a single number (index value), nomenclature and colour. In the present study AQI for different seasons at Hebbal industrial area were determined are presented in Table 3. During winter season AQI was found to be ‘Moderate’ (141) at location 1. ‘Moderate’ AQI may cause breathing discomfort to the people with lung, heart disease, children and older adults. Unusually sensitive people should consider reducing prolonged or heavy exertion. However, during summer season AQI was found to be ‘Satisfactory’ at all the locations (74 at location 1; 66 at location 2 and 56 at location 3). ‘Satisfactory’ AQI may cause minor breathing discomfort to sensitive people. Further, during monsoon season at location 2 and 3, AQI was found to be ‘good’, which implies minimal impact to human health and a good air quality. The reason for ‘good’ AQI may be due to precipitation, which scavenged all the pollutants to the ground level. Chaurasia et al. (2013), Maji et al. (2015) and Kumar and Kriti (2016) have also reported “moderate to poor” AQI in terms of PM10 and PM2.5 concentrations in Bhopal, Delhi and Jaipur City, respectively [8,24,29].
Table 3: AQI for different seasons at Hebbal Industrial area
Location1 Winter Summer Monsoon
Pollutant Conc.
(μg/m3) AQI
Conc.
(μg/m3) AQI
Conc.
(μg/m3) AQI
PM10 161
141 (Moderate)
73.5
74 (Satisfactory)
53
53 (Satisfactory)
PM2.5 60 29.5 16
SO2 1.65 1.5 0.55
NOx 24.7 26.35 16.05
Location 2 Winter Summer Monsoon
Pollutant Conc.
(μg/m3) AQI
Conc.
(μg/m3) AQI
Conc.
(μg/m3) AQI
PM10 118
112 (Moderate)
66
66 (Satisfactory)
41
41 (Good)
PM2.5 25.5 26.5 10
SO2 1.9 1.9 0.5
NOx 25 28.3 16.4
Location 3 Winter Summer Monsoon
Pollutant Conc.
(μg/m3) AQI
Conc.
(μg/m3) AQI
Conc.
(μg/m3) AQI
PM10 70.65
71 (Satisfactory)
56
56 (Satisfactory)
38.5
39 (Good)
PM2.5 21.05 24.5 10.75
SO2 1.35 1.1 0.3
NOx 20.05 20.9 14.95
V. CONCLUSIONS
ISSN(Online): 2319-8753 ISSN (Print): 2347-6710
I
nternational
J
ournal of
I
nnovative
R
esearch in
S
cience,
E
ngineering and
T
echnology
(A High Impact Factor, Monthly, Peer Reviewed Journal) Visit: www.ijirset.com
Vol. 6, Issue 10, October 2017
morning (01:00 – 09:00 h) and evening/night hours (20:00 – 24:00 h), indicating a high pollution potential or low assimilative capacity of the atmosphere during these periods. During winter season PM10 concentration was exceeding 90 % of guideline values at location 1 and 2, which implies a negative assimilative potential of the study area. However, during summer and monsoon seasons assimilative capacity for PM10, PM2.5, NOx and SO2 found to be well within the permissible limits of NAAQS. During winter season AQI was found to be ‘Moderate’ (141) at location 1 and 2, due to high pollution load of PM10 (> 100 μg/m3). During summer season AQI was found to be ‘Satisfactory’ at all the locations. However, during monsoon season at location 2 and 3, AQI was found to be ‘Good’ due to the occurrence of precipitation.
ACKNOWLEDGEMENTS
The authors would like to acknowledge KSPCB-Mysuru, M/s. Ganesh Consultancy, Mysuru, India, for providing their laboratory facilities. We are also thankful to Seshadripuram College, V-LEAD Institute, and JSS Urban Haat, Mysuru, for facilitating during field monitoring.
REFERENCES
[1] Andria, G., Cavone, G. and Lanzolla, A. M. L., “Modelling study for assessment and forecasting variation of urban air pollution”,
Measurement, Vol. 41, pp. 222 – 229, 2008.
[2] Baldasano, J. M., Valera, E. and Jimenez, P., “Air quality data from large cities”, The Science of the Total Environment, Vol. 307, pp. 141 –
165, 2003.
[3] Banerjee, T., “Assessment and model performance evaluation of air quality at Integrated Industrial Estate-Pantnagar”, Doctor of Philosophy
Thesis, Department of Environmental Science, G. B. Pant University of Agriculture and Technology, Pantnagar, India, 2010.
[4] Banerjee, T., Barman, S. C. and Srivastava, R. K., “Application of air pollution dispersion modeling for source-contribution assessment and
model performance evaluation at integrated industrial estate – Pantnagar”, Environmental Pollution, Vol. 159, pp. 865 – 875, 2011.
[5] Bhanarkar, A. D., Goyal, S. K., Sivacoumar, R. and Rao, C. V. C., “Assessment of contribution of SO2 and NO2 from different sources in
Jamshedpur region, India”, Atmospheric Environment, Vol. 39, pp. 7745 – 7760, 2005.
[6] California Air Resources Board (CARB), “Initial Statement of Reasons for Rulemaking”, California Air Resources Board, Sacramento, 1998.
[7] California Air Resources Board (CARB), EMFAC 2002 model, 2002.
[8] Chaurasia, S., Dwivedi, P., Singh, R. and Gupta, A. D., “Assessment of ambient air quality status and air quality index of Bhopal city (Madhya
Pradesh), India”, Int. J. Curr. Sci., Vol. 9, pp. 96 – 101, 2013.
[9] Englert, N., “Fine particles and human health—a review of epidemiological studies”, Toxicology Letters, Vol. 149, pp. 235 – 242, 2004.
[10] Gift, J. S., McGaughy, R., Singh, D. V. and Sonawane, B., “Health assessment of phosgene: approaches for derivation of reference
concentration”, Regul. Toxicol. Pharmacol., Vol. 51, pp. 98 – 107, 2008.
[11] Goyal, P, Anand, S. and Gera, B. S., “Assimilative capacity and pollution dispersion studies for Gangtok City”, Atmos Environ, Vol. 40, pp.
1671 – 1682, 2005.
[12] Goyal, P., Anand, S. and Gera, B. S., “Assimilative capacity and pollutant dispersion studies for Gangtok city”, Atmospheric Environment,
Vol. 40, pp. 1671 – 1682, 2006.
[13] Goyal, P., Krishna, R. T. V. B. P. S. and Anand, S., “Assimilative capacity and dispersion of pollutants in Delhi”, Proc Indian NatlSciAcad,
Vol. 69, pp. 775 – 784, 2003.
[14] Goyal, S. K. and Rao, C. V. C., “Assessment of atmospheric assimilation potential for industrial development in an urban environment: Kochi
(India)”, Science of the Total Environment, Vol. 376, pp. 27 – 39, 2007.
[15] Gross, E., “The National Air Pollution Forecast Programme”, ESSA Technical Memo., WBTM-NMC 47, US Department of Commerce, 1970.
[16] Gurjar, B. R., Butler, T. M., Lawrence, M. G. and Lelieveld, J., “Evaluation of emissions and air quality in megacities”, Atmospheric
Environment, Vol. 42, pp. 1593 – 1606, 2008.
[17] Guttikunda, S. K., Carmichael, G. R., Calori, G., Eck, C. and Woo, J. H., “The contribution of megacities to regional sulfur pollution in Asia”,
Atmospheric Environment, Vol. 37, pp. 11 – 22, 2003.
[18] Health Effects Institute (HEI), “Diesel Exhaust, A Critical Analysis of Emissions, Exposure, and Health Effects”, Health Effects Institute,
Diesel Epidemiology Working Group, Boston, MA, 1995.
[19] Health Effects Institute (HEI), “Research Directions to Improve Estimates of Human Exposure and Risk from Diesel Exhaust”, Health Effects
Institute, Diesel Epidemiology Working Group, Boston, MA, 2002.
[20] Kansal, A., Khare, M. and Sharma, C. S., “Air quality modelling study to analyse the impact of the World Bank emission guidelines for
thermal power plants in Delhi”, Atmospheric Pollution Research, Vol. 2, pp. 99 – 105, 2011.
[21] Kilburn, K. H., Hudson, A. R., Halprin, G. M., McKenzie, W. N. and Merchant, J. A., “Two patterns for bronchial damage from inhaled
materials”, Chest, Vol. 65, pp. 61S – 62S, 1974.
[22] Kodavanti, U. P., Ledbetter, A. D., Thomas, R. F., Richards, J. E., Ward, W. O., Schladweiler, M. C. and Costa, D. L., “Variability in
ISSN(Online): 2319-8753 ISSN (Print): 2347-6710
I
nternational
J
ournal of
I
nnovative
R
esearch in
S
cience,
E
ngineering and
T
echnology
(A High Impact Factor, Monthly, Peer Reviewed Journal) Visit: www.ijirset.com
Vol. 6, Issue 10, October 2017
[23] Krishna, R. T. V. B. P. S., Reddy, M. K., Reddy, R. C. and Singh, R. N., “Assimilative capacity and dispersion of pollutants due to industrial
sources in Visakhapatnam bowl area”, Atmospheric Environment, Vol. 38, pp. 6775 – 6787, 2004.
[24] Kumar, S. S. and Kriti, S., “Ambient Air Quality Status of Jaipur City, Rajasthan, India”, International Research Journal of Environment
Sciences, Vol. 5, pp. 43 – 48, 2016.
[25] Lelieveld, J., Crutzen, P. J., Ramanathan, V., Andreae, M.O., Brenninkmeijer, C. A. M., Campos, T., Cass, G. R., Dickerson, R. R., Fischer,
H., de Gouw, J. A., Hansel, A., Jefferson, A., Kley, D., de Laat, A. T. J., Lal, S., Lawrence, M. G., Lobert, J. M., Mayol-Bracero, O. L., Mitra, A. P., Novakov, T., Oltmans, S. J., Prather, K. A., Reiner, T., Rodhe, H., Scheeren, H. A., Sikka, D. and Williams, J., “The Indian Ocean Experiment: Widespread Air Pollution from South and Southeast Asia”, Science, Vol. 291, pp. 1031 – 1036, 2001.
[26] Li, W. L. and Pauluhn, J., “Comparative assessment of the sensory irritation potency in mice and rats nose-only exposed to ammonia in dry
and humidified atmospheres”, Toxicology, Vol. 276, pp. 135 – 142, 2010.
[27] Lightly, J. S., Veranth, J. M. and Sarofin, A. F., “Combustion aerosols: factors governing their size and composition and implications to
human health”, Journal of the Air and Waste Management Association, Vol. 50, pp. 1565 – 1618, 2000.
[28] Luo, S., Trübel, H., Wang, C. and Pauluhn, J., “Phosgene- and chlorine-induced acute lung injury in rats: comparison of cardiopulmonary
function and biomarkers in exhaled breath”, Toxicology, Vol. 326, pp. 109 – 118, 2014.
[29] Maji, S., Ahmed, S. and Siddiqui, W. A., “Air quality assessment and its relation to potential health impacts in Delhi, India”, Current Science,
Vol. 109, pp. 902 – 909, 2015.
[30] Manju, N., Balakrishnan, R. and Mani, N., “Assimilative capacity and pollutant dispersion studies for the industrial zone of Manali”,
Atmospheric Environment, Vol. 36, pp. 3461 – 3471, 2002.
[31] Nandankar, P. K., “Assimilative capacity of the atmosphere at Lucknow with respect to air pollution”, Mausam, Vol. 50, pp. 263 – 268, 1999.
[32] National Ambient Air Quality Standards (NAAQS), “Central Pollution Control Board Notification, the Gazette of India”, Extraordinary, New
Delhi, 2009.
[33] Padmanabhamurty, B. and Mandal, B. B., “Climatology of inversions, mixing depth and ventilation coefficients at Delhi”, Mausam, Vol. 30,
pp. 473 – 478, 1979.
[34] Prakash, B. M., Mahadevaswamy, M., Mahesh, S. and Sharadhini, S. R., “Air Quality Assessment along the Highway Due to Vehicular
Emissions and Validation of Air Quality Monitored Data with the CALINE4 Model”, International Journal of Innovative Research in Science, Engineering and Technology, Vol. 4, pp. 8369 – 8376, 2015.
[35] Prakash, B. M., Mahadevaswamy, M., Mahesh, S. and Vishala, N., “Prediction of Air Pollutants Dispersion Emitted from Point and Line
Sources along the Highway Passing Through Industrial Area of Mysuru - AERMOD and CALINE4 Models”, International Journal of Innovative Research in Science, Engineering and Technology, Vol. 5, pp. 14497 – 14508, 2016.
[36] Ramanathan, V., Crutzen, P. J., Lelieveld, J., Mitra, A. P., Althausen, D., Andersons, J., Andreae, M. O., Cantrell, W., Cass, J. R., Chung, C.
E., Clarke, A. D., Coakley, J. A., Collins, W. D., Conant, W. C., Dulac, F., Heintzenberg, J., Heymsfield, A. J., Holben, B., Howell, S., Hudson, J., Jayaraman, A., Kiehl, J. T., Krishnamurti, T. N., Lubin, D., McFarquhar, G., Novakov, T., Ogren, J. A., Podgorny, I. A., Prather, K., Priestley, K., Prospero, J. M., Quinn, P. K., Rajeev, K., Rasch, P., Rupert, S., Sadourny, R., Satheesh, S. K., Shaw, G. E., Sheridan, P. and Valero, F. P. J., “Indian Ocean Experiment: An integrated analysis of the climate forcing and effects of the great Indo-Asian haze”, Journal of Geophysical Research, Vol. 106, pp. 28371 – 28398, 2001.
[37] Rao, S. S., Rajamani, N. S. and Reddi, E. U. B., “Dispersal Conditions and Assimilative Capacity of Air Environment at Gajuwaka Industrial
Hub in Visakhapatnam”, IJSRSET, Vol. 1, pp. 5 – 15, 2015.
[38] Sarella, G. and Khambete, A. K., “Ambient Air Quality Analysis using Air Quality Index – A Case Study of Vapi”, International Journal for
Innovative Research in Science & Technology, Vol. 1, pp. 68 – 71, 2015.
[39] Sharma, S. and Chandra, A., “Simulation of Air Quality using an ISCST3 Dispersion Model”, Clean – journal, Vol. 36, pp. 118 – 124, 2008.
[40] Singh, G. and Perwez, A., “Estimation of Assimilative Capacity of the Airshed in Iron Ore Mining Region of Goa”, Indian Journal of Science
and Technology, Vol. 8, pp. 1 – 6, 2015.
[41] Singh, M. P., Goyal, P., Panwar, T. S., Agarwal, P., Nigam, S. and Bagchi, N., “Predicted and observed concentrations of SO2, SPM and NOx
over Delhi”, Atmospheric Environment, Vol. 24A, pp. 783 – 788, 1990.
[42] Stack-Pole, J. D., “The Air Pollution Potential Forecast Programme”, ESSA Tech., Memo, WBTM-NMC 43, 1967.
[43] Thawonkaew, A., Thepanondh, S., Sirithian, D. and Jinawa, L., “Assimilative capacity of air pollutants in an area of the largest petrochemical
complex in Thailand”, International Journal of GEOMATE, Vol. 11, pp. 2162 – 2169, 2016.
[44] Thepanondh, S. and Jitbantoung, N., “Assimilative Capacity Analysis of Air Pollutants over the Dawai Industrial Complex”, International
Journal of Environmental Science and Development, Vol. 5, pp. 161 – 164, 2014.
[45] Thilagaraj, P., Ravinder, R. and Kesavan, R., “A Study on Air Pollution and its Impact on Human Health in Chennai City”, IOSR Journal of
Mechanical and Civil Engineering, pp. 1 – 5, 2014.
[46] Tuck, S. A., Barbón, D. R., Campbell, H., McGovern, T., Quintana, H. K. and Martin, J. G., “Time course of airway remodelling after an acute
chlorine gas exposure in mice”, Respiratory Research, Vol. 9, pp. 1 – 16, 2008.
[47] Turner, D. B., “Workbook of Atmospheric Dispersion Estimates”, Washington, DC, 1969.
[48] Viswanadham, D. V. and Kumar, A. K. G., “Diurnal, monthly and yearly variation of mixing heights and ventilation coefficient for Cochin”,
Indian Journal of Environmental Protection, Vol. 9, pp. 38 – 47, 1989.
[49] Wang, T., Ding, A. J., Blake, D. R., Zahorowski, W., Poon, C. N. and Li, Y. S., “Chemical Characterization of the Boundary Layer Outflow of
Air Pollution to Hong Kong During February-April 2001”, J. Geophys. Res., Vol. 108, pp. 8-1 – 8-15, 2003.
[50] Wang, T., Poon, C. N., Kwok, Y. H. and Li, Y. S., “Characterizing the Temporal Variability and Emission Patterns of Pollution Plumes in the
Pearl River Delta of China”, Atmos. Environ., Vol. 37, pp. 3539 – 3550, 2003.