This content has been downloaded from IOPscience. Please scroll down to see the full text.
Download details:
IP Address: 152.1.53.109
This content was downloaded on 12/08/2016 at 18:48
Please note that terms and conditions apply.
Nonaffine deformation under compression and decompression of a flow-stabilized solid
View the table of contents for this issue, or go to the journal homepage for more J. Stat. Mech. (2016) 084003
J.
St
at.
Mec
h.
(
201
6
)
084003
Nonane deformation under
compression and decompression
of a flow-stabilized solid
Carlos P Ortiz, Robert Riehn and Karen E Daniels
Department of Physics, North Carolina State University, Raleigh, NC 27695, USA
E-mail: [email protected]
Received 31 March 2016, revised 6 June 2016
Accepted for publication 8 July 2016 Published 12 August 2016
Online at stacks.iop.org/JSTAT/2016/084003 doi:10.1088/1742-5468/2016/08/084003
Abstract. Understanding the particle-scale transition from elastic
deformation to plastic flow is central to making predictions about the bulk material properties and response of disordered materials. To address this issue, we perform experiments on flow-stabilized solids composed of micron-scale spheres within a microfluidic channel, in a regime where particle inertia is negligible. Each solid heap exists within a stress field imposed by the flow, and we track the positions of particles in response to single impulses of fluid-driven compression or decompression. We find that the resulting deformation field is well-decomposed into an ane field, with a constant strain profile throughout the solid, and a non-ane field. The magnitude of this non-ane response decays with the distance from the free surface in the long-time limit, suggesting that the distance from jamming plays a significant role in controlling the length scale of plastic flow. Finally, we observe that compressive pulses create more rearrangements than decompressive pulses, an eect that we quantify using the Dmin2 statistic for non-ane motion. Unexpectedly, the time scale for the compression response is shorter than for decompression at the same strain (but unequal pressure), providing insight into the coupling between deformation and cage-breaking.
Keywords: Brownian motion, colloidal glasses, elasticity, plasticity
C P Ortiz et al
Deformation of flow-stabilized solids
Printed in the UK 084003 JSMTC6
© 2016 IOP Publishing Ltd and SISSA Medialab srl 2016
2016 J. Stat. Mech.
JSTAT
1742-5468
10.1088/1742-5468/2016/8/084003
Special Issue on Structure in Glassy and Jammed Systems
8
Journal of Statistical Mechanics: Theory and Experiment
ournal of Statistical Mechanics:
J.
St
at.
Mec
h.
(
201
6
)
084003
1. Introduction
Understanding how structural rearrangements in disordered solids dier from crystal-line solids is central [1–3] to achieving control of material properties such as resistance to flow [4], sound propagation [5], heat capacity [6], and dielectric constants [7]. For large deformations, the microscopic response diers non-perturbatively from the predictions of linear elasticity [8]. Instead of linear deformations, phenomena such as shear banding [9], yielding and plastic rearrangements [10], and non-local eects [11]
are present. Recent experiments have explored non-ane deformations in 3D sheared colloidal glasses [12], 3D emulsions [13], and 2D foams [14]. For suciently slow defor-mations, it is an open question whether the flow behavior [15] is controlled by the jamming transition, where moduli vanish as the packing approaches a critical packing fraction [16].
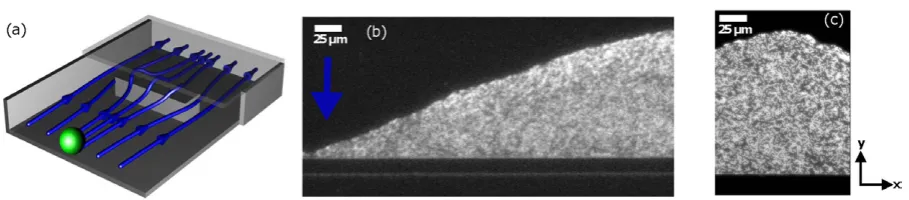
In this paper, we present experiments quantifying the particle-scale deformation of flow-stabilized solids: particle heaps formed under controlled hydrodynamic stress (see figure 1). These quasi-2D heaps are assembled via the slow accumulation of micron-scale particles against a barrier within a microchannel, and are found to be stable above Péclet number ∼1 [17]. For lower Péclet numbers (slower flows) the particles reversibly evaporate away from the solid. We have previously observed that the elastic modu-lus of the solid is proportional to the confining stress provided by the fluid flow [18].
Contents
1. Introduction 2
2. Experimental setup 4
3. Image processing 5
3.1. Particle identification . . . 5
3.2. Total deformation . . . 5
3.3. Short-time particle tracking . . . 5
4. Results 6 4.1. Total deformation . . . 6
4.2. Dynamics of individual particle tracks . . . 7
4.2.1. Affine deformations . . . 8
4.2.2. Non-affine deformations . . . 9
5. Discussion 13
Acknowledgments 14
J.
St
at.
Mec
h.
(
201
6
)
084003
However, the amount of deformation of the solid in response to a flow perturbation is dependent on the sign of the perturbation: for piles prepared under identical conditions, compressions result in smaller strains than decompressions [18]. At the bulk scale, this eect can be understood by considering an excluded volume equation of state, as in thermal systems, under the assumption of locally ane deformations. In this paper, we investigate how the particle-scale dynamics lead to deviations from the excluded volume argument at high deformations.
Our experiments use sterically- and electrostatically-stabilized Brownian micro-spheres with a short Debye length (3 nm), so that the net interparticle interaction is well-approximated by a hard-sphere potential except near contact. A bidisperse mix-ture of particle sizes (5 : 4 diameter ratio) suppresses the nucleation of crystal domains. Using fluorescence microscopy, we measure the particle-scale deformation fields and characterize the response of the heap under compressive and decompressive loads cre-ated by changing the hydrodynamic stress. We characterize the influence of cooperative motions by measuring the degree to which the the deformation field locally deviates from global ane deformations.
The ane (or homogeneous) component of the deformation field is the part that can be described by an ane transformation: rotation, shear, extension, or compression [19]. After identifying the ane component of the deformation, the residual (or inho-mogeneous) component is the non-ane deformation. For linearly-elastic mat erials, only ane deformations are present, but non-ane deformations can arise in struc-tural glasses [20] due to either thermally-driven cage-breaking events [21, 22] or local rearrangements [2]. Here, we quantify two eects: the non-ane rearrangements, and the spatiotemporal dynamics of the response. We observe, as expected [23, 24], that non-ane deformation fields typically exhibit mesoscale correlations. Furthermore, the non-ane deformations are about twice as large for compressive deformations as com-pared with decompressive deformations of similar size, and happen over a shorter time scale. For both compressive and decompressive deformations, non-ane deformations continue after ane deformations have completed.
J.
St
at.
Mec
h.
(
201
6
)
084003
2. Experimental setup
Our experiments begin by assembling a microsphere heap by flowing a dilute sus-pension against a barrier (see figure 1(a)). The microchannel is fabricated to have a height H = 897 nm, higher than the height of a barrier (hb=694 nm), so that the
fluid overflow accumulates particles against the barrier of width W=512 m µ . The heights are chosen to create a quasi-2D heap, shallow enough to suppress both stacked and non-stacked bilayer phases [25]. The suspension is pumped into the channel by pressurizing a reservoir at the inlet using a piezoelectrically actuated, digital pressure regulator (AirCom PRE1-UA1), at P0 = 10 kPa above atmospheric
pressure. We collect data once the pile has reached a steady-state (at its maximum size), achieved after about two hours of particle-accumulation. The steady-state heap is 154 m µ deep (30 angle of repose) and contains approximately 40 000 par-ticles, as shown in figure 1(b). The coordinate system takes xˆ parallel to the barrier and yˆ perpendicular to the barrier, with the origin at center of the barrier; the fluid flow is in the −yˆ direction.
The dilute, aqueous suspension is prepared at a areal concentration of
180 100 m/( )2
ρ= µ fluorescent microspheres (suspension viewed through microscope). The particles are a bidisperse mixture of equal concentrations of 600 nm and 710 nm polystyrene microspheres (≈6% polydispersity, elastic modulus 4 GPa from Bangs Laboratories). We use steric and electrostatic stabilization (sulfate functionalized surface with ζ-potential = −60 mV and coated with Triton X-100 with surface cov-erage ≈1 molecule 12 A /( )˚ 2) to provide reversible inter-particle and channel-particle
interactions. For long-term stability of the electrostatic interactions, we also hold the suspension pH constant (pH 5.4), by buering with citric acid. The suspending fluid is a density-matched aqueous solvent composed of 17%( / )w v sucrose to sup-press segregation and sedimentation eects, important both at the barrier and at the inlet reservoir. Because the total particle brightness scales approximately with the particle volume, and we are working near the diraction limit, the 600 nm particles appear dimmer than the 710 nm particles. This eect aids in tracking the motion of the particles.
We quantify the ane and non-ane deformation due to a pulse of either com-pression (∆ >P 0) or decompression (∆ <P 0). The decompression pulse results from a change from 10 kPa to 0.5 kPa over a time scale of 10 ms, and the compression pulse returns the pressure to 10 kPa. This corresponds to ∆P P/ 0=19 for the compression
pulse and ∆P P/ 0=0.95 for the decompression pulse. Imaging occurs in two phases. A
full view of the initial heap is accessible with a 10× objective, while experiments quanti-fying the particle motions require visualizing a zoomed-in region using a 60× objective with a 4× beam expander. The image was recorded by a CCD camera with 10×10 m µ 2
J.
St
at.
Mec
h.
(
201
6
)
084003
3. Image processing
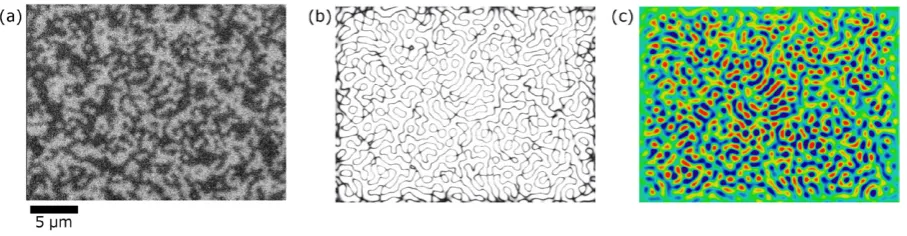
For either compressive or decompressive pulses, we first compare the initial and final configurations (separated by 100 s), and quantify both the total deformation and the non-ane deformation. Second, using the series of frames immediately following the pulse, we track individual particles to identify non-ane eects on the local scale. Below, these are referred to as ‘long-time’ and ‘short-time’ dynamics, and require slightly dierent image-processing. For the long-time dynamics, the total distance trav-eled is on the order of a few particle diameters. Therefore, we first subtract the ane deformation before performing particle tracking using the Blair–Dufresne implementa-tion [26] of the Grier–Crocker particle tracking algorithm [27].
3.1. Particle identification
Figure 2 summarizes how we obtain particle positions beginning from a raw image. We identify the location of each particle by performing a Wiener deconvolution on the raw image, using a Gaussian approximation to the point-spread function with full-width at half maximum of 540 nm. This value is found to maximize the contrast in the output image, as measured from the ratio of the standard deviation to the mean intensity, but is more eective at locating the large (bright) particles than the small (dim) particles. The resulting deconvolved image allows us to detect the centroid of each particle using Matlab’s local extended maxima method.
3.2. Total deformation
We estimate the total deformation ∆y due to a single pulse by making a coarse-grained measurement of the particle displacements between an initial image and a final image. These two images are created by averaging 10 initial images
I x yi( , ) ⟨ (= I x y t, , )⟩t t= … +i ti 10frames and 10 final images I x yf( , ) ⟨ (= I x y t, , )⟩t t= … +f tf 10frames.
We divide If(x, y) into horizontal strips of width 2d and compute a cross-correlation with Ii(x, y) to determine its displacement, ∆y. We find that the cross-correlation is sharply-peaked function for strips of at least this width. We will show that in sec-tion 4.2 an ane deformation consisting of a compression in the y -direction is a good approximation of the resulting displacement field.
Due to the large total strains, we perform particle pair matching between initial and final configurations based on particle positions from which the ane deformation has already been subtracted, as described below in section 4.2. After this adjustment, pair identification proceeds as in the one-step particle tracking [26], with the size of the search region selected to correspond to the estimate of the maximum non-ane displacement amplitude, plus an estimate of the error in the ane strain.
3.3. Short-time particle tracking
J.
St
at.
Mec
h.
(
201
6
)
084003
determined above. In addition, we consider a particle’s identified size (brightness) in order to either split incorrect trajectories or or reconnect broken trajectories.
4. Results
In previous experiments [18], we observed that flow-stabilized solids exhibit a nonlinear stress–strain relationship in which the magnitude of the deformation of the surface of the flow-stabilized solid is well-described by
y y
1
1 P 1 .
P
surface
surface
0 ⎛
⎝ ⎜ ⎜
⎞
⎠ ⎟ ⎟
∆
∝
+∆ − (1)
The success of this description is somewhat surprising, as equation (1) does not con-tain any information about the distribution of stresses or strains throughout the flow-stabilized solid. The stress field within the solid is anticipated to be similar to that in a sedimentation experiment where particles ‘on top’ of the sedimented material apply some stress on lower layers (in the limit of shallow sediments without side walls). We believe that the success in describing our experiments is due to the universality of the van-der-Waals thermal argument. However, that argument breaks down if non-ane motions occur, and we anticipate that the lower stress at the upstream (‘top’) surface of the flow-stabilized solid is not fully characterized by the van-der-Waals argument. In the following, we first identify the distributions of particle displacements in the asymp-totic long-term limit, before following individual trajectories through compression and decompression. Our particular interest is in the associated particle-scale non-ane motions and their dependence on the sign of ∆P.
4.1. Total deformation
We find displacements of individual particles in the heap immediately before and 100 s after a compressive/decompressive pulse through a two-step analysis. Following the homogeneous strain field assumption from our prior work [18], we first use the cross-correlation analysis of images before and after deformation to obtain a global estimate
J.
St
at.
Mec
h.
(
201
6
)
084003
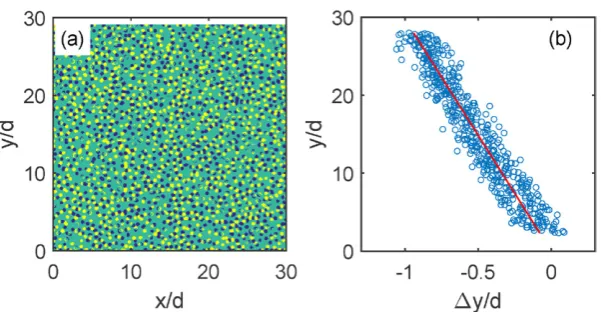
of the ane strain field. We then use the ane transformation identified by the cross-correlation analysis as a scaold for the matching of particles in the images before and after deformation. In figure 3(a), we show an example of the particle locations after Wiener deconvolution and prior to finding the centroids, for both Ii (red, before com-pression) and If (white, after compression). By tracking each centroid, we can plot the local displacement ∆y as a function of y-position within the heap.
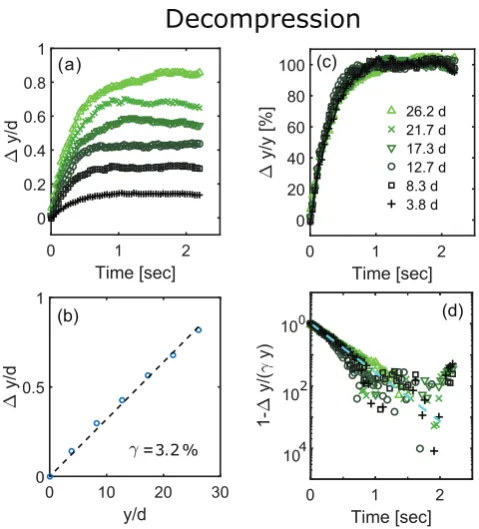
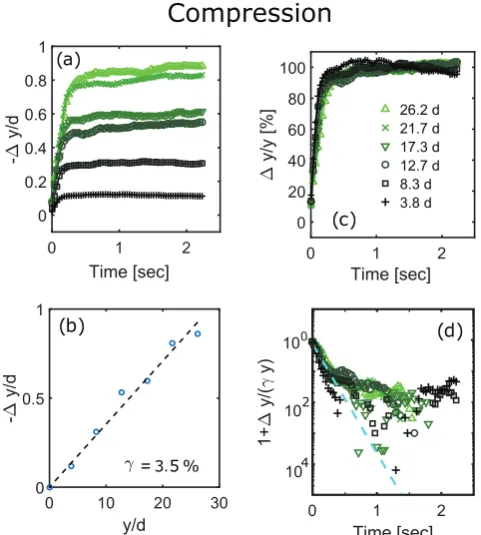
As shown in In figure 3(b), the mean behavior is linear, confirming that the overall assumption of an ane deformation was suciently accurate. The best fit line to these points provides a measure of the strain: ∆ =y γ∞y with γ∞= −3.4%. The precision of these measurements is insucient to estimate the expected higher-order (quadratic) term, although we expect one to be present due to a depth-dependent stress field. The observed linear behavior, combined with equation (1), suggests that the packing frac-tion is close to invariant along the y-direction.
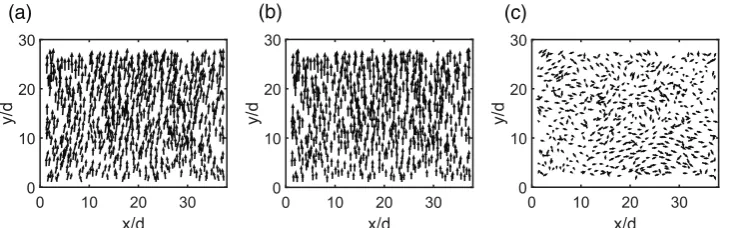
To obtain the non-ane deformation field, we subtract the local ane motion from each displacement vector, as in [2]. Figures 4 and 5 (both compression and decom-pression) show the total, ane, and non-ane displacement fields, for comparison. Importantly, we observe bands of correlated motions, as expected from [23, 24]. Because the total deformation field is not robust in tracking individual bead pairs over long times, we next examine the short-time dynamics.
4.2. Dynamics of individual particle tracks
Using the estimate of strain provided by figure 3(b), we track the fast dynamics aris-ing from a compressive/decompressive pulse. We translate the raw coordinates for particle p, r tp( ) ( ( ) ( ))= x t y tp , p , into the moving reference frame of the ane deforma-tion r t˜ ( )p =r tp( )−γ( ) ˆt yy, where γ( )t is the coarsely estimated ane deformation (see
section 3). After tracking in the moving reference frame, we return to the lab reference by applying the inverse of the ane deformation: r tp( )=r t˜ ( )p +γ( ) ˆt yy, where γ( )t is
Figure 3. Determination of the long-time ane field from particle tracks for
P 9.5
∆ = + kPa. (a) Image dierence of blobs with size corresponding to 1σ of
J.
St
at.
Mec
h.
(
201
6
)
084003
the same as used in the forward transformation. The analyses that follow are based on these final coordinates in the lab reference frame.
Sample trajectories are shown in figure 6. While the total deformation field is of the similar magnitude under compression and decompression, we find a more pro-nounced scrambling of the particle trajectories under compression, as compared to decompression. Below, we quantify both the ane and non-ane contributions to these trajectories.
4.2.1. Affine deformations. Data was binned within strips along the x -direction, pro-viding ensembles of particles-dynamics sampled as a function of depth. Figures 7(a) and 8(a) show the mean deformation field ∆y as a function of y -position for compres-sion and decomprescompres-sion, respectively. For both deformation directions, we find an exponential-like asymptotic approach to the final displacement magnitude. The depth-dependence of the asymptotic value of ∆y (figures 7(b) and 8(b)) demonstrates the same linear relationship originally shown in figure 3(b). The resulting slope (γ∞= ∆y y/ )
quantifies the dynamics of ane reorganization. We find a marked dierence between decompression (figure 7(c)) and compression (figure 8(c)) in that decompressions are far slower than compressions, and that the strain curves for decompression collapse better onto a single dynamic curve.
Figure 4. Deformation field for a compression given by a pressure change at the inlet of ∆ = +P 9.5 kPa. The axes in both figures are the x-position and the
y-position in units of particle diameters. (a) Full deformation field. (b) Ane
deformation field. (c) Non-ane deformation field, magnified by a factor of two.
(a) (b) (c)
Figure 5. Deformation field for a decompression given by a pressure change at the inlet of ∆ = −P 9.5 kPa. The axes in both figures are the x-position and the
y -position in units of particle diameters. (a) Full deformation field. (b) Ane
deformation field. (c) Non-ane deformation field, magnified by a factor of two.
J.
St
at.
Mec
h.
(
201
6
)
084003
To quantify the dierence, we make the Ansatz of a single-exponential approach to the asymptotic deformation
y t( ) γ( )t y
∆ = (2)
( ) ( )
γ t = γ∞1−e−∆τt (3)
where ∆y is the particle displacement after a time interval ∆t, τ is a characteristic time scale of particle rearrangements, γ( )t is the time-dependent strain and γ∞ is the asymptotic strain. Note that the value γ∞ here is a fitting parameter; we find its value to be consistent with the estimate from the long-time dynamics. As shown in both panels (d), this exponential form is a good fit for the decompression pulses with
0.28 0.05 affine,decompression
τ = ± s. For compressive deformations, a single-exponential form is less consistent with the observed dynamics. Instead, there appears to be a two-step process of compression in which the viscous stress increase acts nearly instanta-neously throughout the solid, while stresses due to particle–particle contacts propagate at a distinct speed of sound from the immobile barrier on which the solid is formed. Given the two-step nature of the process under compression, we establish an upper bound on the relaxation time scale of τaffine,compression=0.11±0.05 s.
4.2.2. Non-affine deformations. We identify the non-ane contribution to the defor-mation field by subtracting the ane portion associated with the best-fit instantaneous value of the strain, which we designate γ( )t . To quantify the resulting non-anity, we use the Dmin2 measure [2] defined by
D2mint r t t r t .
neighbors
0 2 ( )≡
∑
( ( )∆→ −γ( ) ( ))∆→(4)
Here, ∆r t→( ) is the set of local displacement vectors connection nearest neighbors, and t0
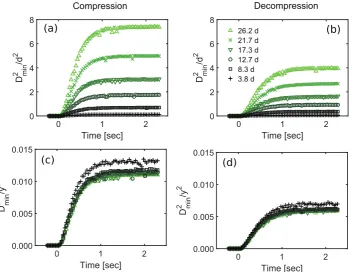
is the time immediately before the pressure step was applied. Figure 9 shows the time-evolution of the non-ane displacement as a function of y -position during compression and decompression, respectively. In both graphs, Dmin2 grows and ultimately saturates.
J.
St
at.
Mec
h.
(
201
6
)
084003
Interestingly, the magnitude of the non-ane field scales linearly with depth as dem-onstrated by the collapse of Dmin2 /y2 data series shown in figure 10. This a surprising finding in light of the assumed constant strain throughout the flow-stabilized solid. Furthermore, the magnitude of non-ane deformations is approximately twice as large under compression than under decompression at near identical asymptotic strain γ.
We observe that the growth of Dmin2 with time is smooth. We are able to deter-mine a characteristic time for the approach to the asymptotic value of Dmin2 by fitting a single exponential approach, as we did for the ane deformation field. In doing so, we neglect the low background value of Dmin2 in steady-state flow-stabilized sol-ids arising from Brownian motion. We find τnon affine,compression− =0.36±0.08 s, and
0.44 0.1 non affine,decompression
τ − = ± s. Therefore, the non-ane field significantly lags the
ane field for decompression (τaffine,decompression=0.28±0.05 s). For compression, where
a single time scale is less well defined, and an upper bound on the ane time scale is
0.11 0.05 affine,compression
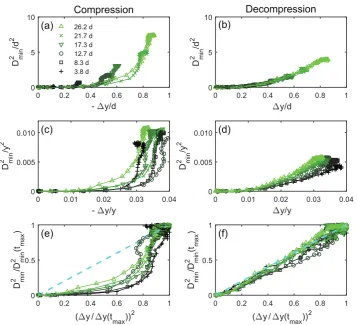
τ = ± s, the non-ane field also lags the ane deformation. To explore the coupling between the non-ane and ane deformation fields, we make a parametric plot of Dmin2 and ∆y as a function of time, as explored in figure 11. As shown in figures 11(a) and (b), the raw growth of D2min versus displacement mag-nitude is smooth, following a concave up non-linear relation. Under decompression, the raw growth of D2min proceeds along a single, characteristic curve for decompression
J.
St
at.
Mec
h.
(
201
6
)
084003
(figure 11(b)), but multiple, depth-dependent curves for compression (figure 11(a)). In figures 11(c) and (d), we plot Dmin2 /y2, to scale the non-ane deformation field by the
depth-dependence suggested in figure 9, and we find Dmin2 /y2 depends non-linearly on
the local-strain (∆y y/ ). Under compression, we find Dmin2 grows slowly as a function of
Figure 8. Ane deformation time-series analysis during compression. (a) Magnitude of correlated displacement field as a function of time at varying y -positions. (b) Long-time displacement amplitude ∆y, as a function of distance upstream of the barrier, both in units of particle diameters. (c) Correlated displacement amplitude normalized by the long-time displacement amplitude. (d) Log-linear plot of growth curves in (c).
J.
St
at.
Mec
h.
(
201
6
)
084003
strain, but transitions to a rapidly-growing function above a depth-dependent value of the strain figure 11(c). This behavior reflects the two-step nature suggested by study-ing the temporal evolution of the ane-deformation; when viewed as a function of strain, the behavior in (figure 11(c)) is similar to strain-weakening as seen e.g. in [28]. However, under decompression, D2min grows smoothly without sudden changes in its rate of change (figure 11(d)). Because figures 11(c) and (d) do not show good collapse, we plot figures 11(e) and (f ), to determine whether non-ane deformations accumu-late via a single-process under decompression, but two processes under compression. Figures 11(e) and (f) show D2min against ( )∆y 2, each scaled by its value at t
max to
evalu-ate the depth-dependence of the scaling. Under decompression, this analysis shows that
D2min indeed grows by following a single, depth-independent quadratic curve versus strain. However, under compression, the accumulation of Dmin2 follows a more complex, strain-dependent set of curves. This asymmetry in the behavior versus driving direction is similar to observations made by [29], who suggested an asymmetry in the response to compression versus decompression and also observed a two-step process under compres-sion, with the second process corresponding to the onset of creep. Our need to wait 100 s between stress-steps to achieve a new steady state (deformations cease) also suggests the second process may correspond to the onset of creep, but more work is needed to determine the connection between non-ane rearrangements and the onset of creep.
Figure 10. Plots of Dmin2 as a function of time, with the y -axis scaled either by the size of the large particles or the y -position at which the non-ane deformation is being probed. The legend in panel (b) applies to all panels. (a) Compression. Dmin2
scaled by d 2. (b) Compression. Dmin2 scaled by y 2. (c) Decompression. D2min scaled by d 2. (d) Decompression. D
min
J.
St
at.
Mec
h.
(
201
6
)
084003
5. Discussion
We have observed particle-scale non-ane motions within flow-stabilized solids, and examined how their spatiotemporal dynamics depend on whether the deformation is compressive or decompressive. We observed the typical swirling regions often associ-ated with non-ane deformations, arising through cooperatively rearranging regions. The magnitude of these eects is nearly twice as large under compression than under decompression, in spite of very similar total strains.
We observe that compressive pulses (large ∆P P/ 0) generate more non-ane
defor-mation, which is able to dissipate the eect of the pulse more quickly. The non-ane fields for both compressive/decompressive deformations occur after similar delays with respect to the ane deformations, which suggests that they are triggered by the ane deformations. In the context of caging behavior, this suggests that the ane defor-mation distorts the cages provided by the neighboring particles and thereby makes
Figure 11. Plots of Dmin2 as a function of strain, with dierent scalings. The legend in panel (a) applies to all panels. Left column (panels (a), (c), and (e)) has compression data. Right column (panels (b), (d), and (f)) has decompression data. First row (panels (a) and (b)) is Dmin2 scaled by d2 versus displacement amplitude
y
J.
St
at.
Mec
h.
(
201
6
)
084003
Brownian cage-breaking (non-ane deformation) more likely. Remarkably, this is the case even though the strain is approximately the same for decompression and compres-sion. This connection between cage-distortion and the facilitation of cage-breaking events has been suggested by Petekidis [29], but other scenarios are possible as well [20].
In probing the spatial dependence to the magnitude of the non-ane deformations (figure 9), we observe that the degree of non-anity increases with distance from the barrier. This eect can be rescaled by the position to indicate a universal behavior. The form of this dependence suggests D
p K
min
2 1 1
2
∝ ∝ , for pressure p and modulus K[18]. One interpretation is that the surface of the heap is less rigid (smaller K), and therefore more prone to undergoing non-ane deformations (higher D2min). Similar eects have been observed in numerical simulations [24], where increasingly non-ane displace-ments are present in proximity to unjamming.
The significance of the above conclusions to soft-matter particle assemblies is to reinforce the centrality of understanding non-ane rearrangements to link bulk proper-ties of the material, such as its modulus and global stability, to local properproper-ties about the typical particle geometry and rearrangement timescales. Based on these results, this experimental setup opens the possibility to explore this connection, by studying multiple orders of magnitude of heap sizes, under dynamically tunable interaction potentials and heap geometry, maintaining the ability relate particle-scale rearrange-ment dynamics to bulk properties. By doing so, it should be possible to determine length and time scales at which localized and collective rearrangements have the great-est impact on bulk properties, and shed light on the general mechanisms by which it is feasible to control the bulk properties of soft matter systems.
Acknowledgments
We are grateful for support from the National Science Foundation through an NSF Graduate Fellowship, grants DMR-0644743, DMS-0968258, DMR-1121107, MRSEC/ DMR-112090, MRSEC/DMR-1121107, and INSPIRE/EAR-1344280. Research was also supported by US Army Research Oce—Division of Earth Materials and Processes grant 64455EV. This work was performed in part at the Cornell NanoScale Facility, a member of the National Nanotechnology Infrastructure Network, which is supported by the National Science Foundation (Grant ECCS-0335765). This work was also per-formed in part at North Carolina State University facilities: Nanofabrication Facility, Advanced Instrumentation Facility, and Education and Research Laboratory. We also thank one anonymous reviewer for suggesting the parametric plot in figure 11.
References
[1] Schall P, Weitz D A and Spaepen F 2007 Science3181895–9
[2] Falk M L and Langer J S 1998 Phys. Rev. E 577192–205
[3] Falk M L and Langer J 2011 Annu. Rev. Condens. Matter Phys.2353–73
[4] Brady J F 1993 J. Chem. Phys.99567
[5] Kriegs H, Petekidis G, Fytas G, Penciu R S, Economou E N and Schofield A B 2004 J. Chem. Phys.
J.
St
at.
Mec
h.
(
201
6
)
084003
[6] Lubchenko V and Wolynes P G 2007 Annu. Rev. Phys. Chem.58235–66
[7] Bradshaw-Hajek B H, Miklavcic S J and White L R 2009 Langmuir251961–9
[8] Bocquet L, Colin A and Ajdari A 2009 Phys. Rev. Lett.103036001
[9] Hays C C, Kim C P and Johnson W L 2000 Phys. Rev. Lett.842901–4
[10] Hébraud P, Lequeux F, Munch J and Pine D 1997 Phys. Rev. Lett.784657–60
[11] Lu C Y D, Olmsted P D and Ball R C 2000 Phys. Rev. Lett.84642–5
[12] Chikkadi V and Schall P 2012 Phys. Rev. E 85031402
[13] Knowlton E D, Pine D J and Cipelletti L 2014 Soft Matter106931–40
[14] Twardos M and Dennin M 2005 Phys. Rev. E 71061401
[15] Lerner E, Düring G and Wyart M 2012 Proc. Natl Acad. Sci. USA1094798–803
[16] Liu A J and Nagel S R 2010 Annu. Rev. Condens. Matter Phys.1347–69
[17] Ortiz C P, Riehn R and Daniels K E 2013 Soft Matter9543
[18] Ortiz C P, Daniels K E and Riehn R 2014 Phys. Rev. E 90022304
[19] Wu H C 2005 Continuum Mechanics and Plasticity(London: Chapman and Hall)
[20] Pica Ciamarra M, Pastore R and Coniglio A 2016 Soft Matter1210
[21] Weeks E and Weitz D 2002 Phys. Rev. Lett.89095704
[22] Pastore R, Pica Ciamarra M, Pesce G and Sasso A 2015 Connecting short and long time dynamics in hard-sphere-like colloidal glasses Soft Matter11622–6
[23] Léonforte F, Tanguy A, Wittmer J and Barrat J L 2006 Phys. Rev. Lett.97055501
[24] Ellenbroek W G, Hecke M V and Saarloos W V 2009 Phys. Rev. E 8061307
[25] Van Winkle D and Murray C 1986 Phys. Rev. A 34562–73
[26] Blair D and Dufresne E The matlab particle tracking code repository http://physics.georgetown.edu/matlab/
[27] Crocker J C and Grier D G 1996 J. Colloid Interface Sci.179298–310
[28] Dang M T, Denisov D, Struth B, Zaccone A and Schall P 2016 Eur. Phys. J. E 391