Computational Study to Reduction of
Aerodynamic drag of Passenger Car Using
Rectangular Perforated Tail plate
Shivaji Shinde1, Shende M.D2, Amol Gawali3
1
Research scholar, Shreeyash College of Engineering & Technology, Aurangabad, Maharashtra, India
2
Associate Professor, Department of Mechanical Engineering, Shreeyash College of Engineering & Technology,
Aurangabad, Maharashtra, India
3
Assistant Professor, Department of Mechanical Engineering, P.E.S. Engineering College, Aurangabad,
Maharashtra, India
ABSTRACT: Aerodynamic drag is concept use of increasing car performance at high speed. Race car Design Engineers realized that air flowing over the car could be used to increase down force and reduce aerodynamic drag force on the car. This technique is also useful for the domestic sedan base passenger car. As fuel economy became a strong factor in road vehicle design, engineers soon realized that the methods of reducing aerodynamic drag on passenger cars could be transferred to road vehicles in order to improve fuel economy. Optimizing the various type of add on device installed on vehicle to reduce aerodynamic drag.
This paper revealed computational Study & effect of rectangular Plane tail plate & Perforation plate 10mm & 20mm RPP and RP1, RP2 respectively is reducing the drag coefficient of sedan baseline (BM) passenger car. A baseline drag value is obtained for a simplified sedan baseline car in WORKBENCH ANSYS 16.O. CFD software with SST k-ω
turbulence model was applied. In order to have high accuracy, Second Order discretization schemes were chosen. The drag reduction of a proposed rectangular shaped tail plate (RPP) is compared to rectangular perforation plate (RP1 & RP2) at High speed 120 km/hr (33 m/sec). The Tail plates are installed at back side of the roof of the passenger car at 12o inclination angle. Similarly observe the effect of perforation tail plate on coefficient of drag for sedan baseline car model with respective diameter of hole. A maximum drag reduction of 6.5% is achieved using a Rectangular Perforation 10mm (RP1) with 0.18 m length axis towards direction of flow. Hence, the drag force can be reduced by using add on devices on passenger car and fuel economy, stability of a passenger car can be improved.
KEYWORDS: Aerodynamic, CFD, Coefficient of Drag, Passenger car, Perforation, Tail Plate.
I. INTRODUCTION
air, helium, or any other gas for that matter depending on condition. Even cars passing through air is also affected by aerodynamics effect. Aerodynamic shape of car model has its maximum contribution to change fuel efficiency with the help of drag coefficient. Few case studies show that, reduction in Coefficient of drag 0.01 means save the 0.4 liters/100km fuel at the speed of 130 km/hr [2]. Emission controlled is important which direct affects on environmental safety. In above problem can be easily solved by improving fuel efficiency as result of improvement in drag force and minimum fuel consumption [1]. CFD analysis is only efficient tool in order to evaluate specific design parameterization of a generic shape of automobile. Computational Fluid Dynamics (CFD) is a branch of fluid mechanics that uses numerical methods and algorithms to solve and analyse the problems that involve fluid flows. The analysis of system is associated by means of computer based simulation. Nowadays consume fuel 50% for ground vehicle all over worldwide and affected 60% greenhouse gas affected by the emission of gases from consuming fuel [3]. In recent times increasing the greenhouse effect in global warming world to reduce CO2 emission with the help increasing the
performance of automobile by reducing the drag coefficient by using the various methods like passive flow control system ex. Ahmed body, Add-on Device, VG is conclude [5].
The tail plate is installed on the passenger car model at underneath half-foot long plate was attached to the floor of vehicle is like diffuser and 5cm long plate was attached to the top at rear side of roof the plate angle of inclination is 12 degree. The obtained result for CFD simulation is coefficient of drag is 0.3376 and Coefficient of lift is 0.1926. Therefore the percentage of reduction of aerodynamic drag coefficient is comparing with base line model is 3.87% and in coefficient of lift is 16.62%. [6]. The effect of aerodynamic design is increasing fuel efficiency, reducing drag and also improving the stability of automobile in high speed is shown in survey taken by Lynette Cheah & John Heywood [4]. Similarly Alamaan Altaf et al is observer the effect of various geometry shape tail plate are used on trucks for reducing aerodynamic drag near about 11.11%. In this research paper is also work on the perforation tail plate is attached at the rear end of truck is also effective tool for reducing aerodynamic drag [7].
In this research paper the simulation perform on passenger car model with & without tail plate by using WORKBENCH ANSYS-16.0 software. The ‘pressure based solver’ in ANSYS FLUENT 16.0 was Two equation SST k-ω turbulence model was applied for finding Cd.
Car drivers usually install tail plates that successfully reduce the drag and improve down force to better handling stability at high speed. For this reason, these works has concentrate design engineers for the study effect of tail plate on aerodynamic drag & introduce new tool, and idea for tail plate design process. In the next sections, some related work and the methodology will be presented in detail.
II. RELATED WORK
various type of geometry is applied on Truck type heavy vehicle. The three type of geometry shape are considered is equal in surface area & equivalent aerodynamic length. The result are find out with the help of STAR C++ CFD software is elliptical plane plate is reduce the aerodynamic drag up to 11.11% & perforation of the elliptical plate on 0.01 & 0.02m in different diameter is reduce drag up to 8.8%.
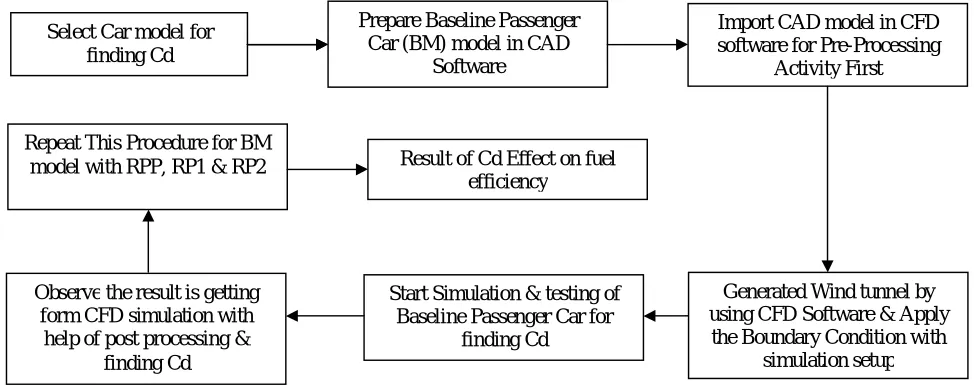
III. METHODOLOGY & VARIOUS STEPS
In this research work the Sedan Based Car model is complete simulation with the help of WORKBENCH ANSYS 16.0 CFD software as like following flow chart of each tail plate like RPP, RP1 & RP2 for finding coefficient of drag value of each model at velocity 120 km/hr (33.33m/sec) and getting result for better tool for improving the efficiency of passenger car model with better handing at high speed.
IV. FORMULATION OF BASELINE MODEL &PRE PROCESSING ACTIVITY IN CFD SOFTWARE
(a) (b) (c)
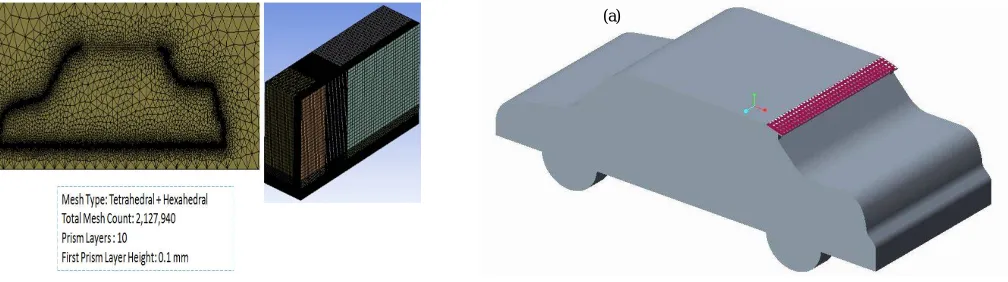
Figure 1 (a) Baseline Model in CAD software, (b) Surface Meshing Model in CFD Software, (c) Boundary Condition applied on passenger car model
As shown in figure 1 (a) First of all a Baseline sedan base passenger car model is prepared with the help of CAD software. The full size generic passenger car is 4145mm long, 1625mm wide, 1385mm high. Then after, this model has been analysed for drag coefficient and forces under the ANSYS WORKBENCH- 16.0 (FULENT) module and values of drag coefficient.
Select Car model for finding Cd
Prepare Baseline Passenger Car (BM) model in CAD
Software
Import CAD model in CFD software for Pre-Processing
Activity First
Generated Wind tunnel by using CFD Software & Apply
the Boundary Condition with simulation setup Start Simulation & testing of
Baseline Passenger Car for finding Cd Observe the result is getting
form CFD simulation with help of post processing &
finding Cd
Repeat This Procedure for BM
As shown in figure 1 (b) The necessary pre-processing activities such as surface meshing was performed with the help of ANSYS Design Modeler and Mesher software is Meshing Details is like Element Type: Hexahedral + Tetrahedral + Prisms, Number of Elements: ~2,000,000.
Similarly as shown in figure 1 (c) indicates the Working of Preprocessing work of CFD Anysis software like computational domain preparation for performing simulation with the help of boundary condition. With the help of theoretical knowledge apply the boundary condition for getting result as per environment condition of given virtual model. Now the next step is go for simulation setup on baseline passenger car model at inlet speed is 120km/Hr.
V. SIMULATION SETUP FOR PASSENGER CAR
With the help of ‘pressure based solver’ in ANSYS FLUENT 16.0 was chosen for these 3-Dimensional, Steady state simulations. The boundary conditions for the simulations had been highlighted. Two equation SST k-ω turbulence model was applied for finding Cd. In order to have high accuracy, Second Order discretization schemes were chosen. Convergence for the simulation was defined based on the force balance over the iterations.
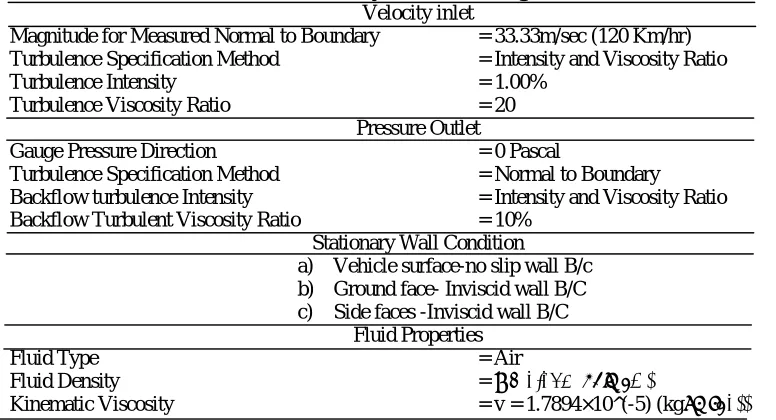
The following CFD simulation performed with the help of following table 1, 2, 3, 4 Ram Bansal and R. B. Sharma [6] boundary condition settings, solver setup, Turbulence model settings, and pressure based solver solution controls for present simulation respectively.
Table 1 Boundary condition settings Velocity inlet
Magnitude for Measured Normal to Boundary = 33.33m/sec (120 Km/hr) Turbulence Specification Method = Intensity and Viscosity Ratio
Turbulence Intensity = 1.00%
Turbulence Viscosity Ratio = 20
Pressure Outlet
Gauge Pressure Direction = 0 Pascal
Turbulence Specification Method = Normal to Boundary
Backflow turbulence Intensity = Intensity and Viscosity Ratio Backflow Turbulent Viscosity Ratio = 10%
Stationary Wall Condition
a) Vehicle surface-no slip wall B/c b) Ground face- Inviscid wall B/C c) Side faces -Inviscid wall B/C
Fluid Properties
Fluid Type = Air
Fluid Density = ρ = 1.175 (kg⁄m^3 )
Kinematic Viscosity = v = 1.7894×10^(-5) (kg⁄(ms^1))
With the help of above table 1 is shown the boundary condition are applied in CFD simulation are performed, in this table is defining various input inlet velocity properties and outlet pressure with turbulence condition. The main important is defining stationary wall condition are performing simulation on car model with domain prepare in software. They are also used with type of fluid are used when simulation perform like Air, liquid etc & its properties.
Table 2 Solver Setup CFD simulation : 3d
Solver : Fluent
Space : 3D
Formulation : Explicit
Time : Steady
Table 2 represent is explain the solver setup used in CFD model. With help of given 3D model to apply the boundary condition using solver like CFD fluent, CFX etc. With space 3D CAD model & different type of Formulation like Implicit or Explicit type are used in CFD simulation. The steady state equation is used for solving the problem with the help of absolute velocity.
Table 3 Turbulence Model Settings Turbulence Model : SST K-ω
K-ω Model : Shear Stress Transport Near Wall Treatment : Enhanced Wall Function Operating Condition : Ambient
As shown in Table 3 the two equation SST k-ω turbulence model was applied for finding coefficient of drag value with the help of enhanced wall function condition as Ambient condition. In order to have high accuracy, with low cost and less time performing for CFD simulation for finding coefficient of drag value
Table 4 Solver Setup
Equation : Flow& Turbulence Model SST Discretization : Pressure: Standard
Momentum: 2nd Ordered
Turbulence Kinetic Energy: 2nd Order Upwind Turbulence Dissipation Rate: 2nd Order Upwind Monitor : Residual & Drag Coefficient
Convergence Criterion : Continuity =0.001, X- Velocity =0.001 Y-Velocity = 0.001, K= 0.001, ω = 0.001
Similarly shown in Table 4 solver setup is very important for all simulation setup use Flow & turbulence model at standard pressure with 2nd ordered momentum equation are used. In WORKBENCH ANSYS 16.0 software 2nd order upwind turbulence Kinetic Energy are used. Similarly turbulence Dissipation rate used for 2nd order upwind model for discretization process. Convergence for the simulation was defined based on the force balance over the iterations with continuity and K- ω model. Now start the simulation work and wait for completion near about 16 Hr for go to next step as post processing. When the simulation is over then go for next step as Result and analyse with the help of pressure & velocity Contour.
VI. SIMULATION AND TESTING OF BASELINE PASSENGER (BM) CAR FOR DRAG COEFFICIENT
(a) (b)
As per above figure 2 shows the when simulation completion with the help of WORKBENCH ANSYS16.0 software then the go for post processing getting in velocity contour image is shown at rear side of car model is decreasing velocity. The velocity magnitude is the instantaneous speed of the model car. The region of light brownish yellow colour shows the normal velocity of the fluid (air) in the domain. As the model car travels with 33.33 m/s the velocity of the air changes with the position of the car. In the figure 2 (a), the air has velocity of 31 m/s. As the air along the car model is brought closer towards the bonnet, the velocity rise from 40 m/s of the orange patch. It keeps increasing to 45 m/s on the top roof surface of the car in pale red patchy region and drops slowly at rear end of car model up to 4.5m/s this is region to generated the recirculation of air to form Wake is reason of increasing drag force on a car body.. On the bottom part of the model car, the velocity of the air exhibits very low or near about 9m/sec of no air movement. This is shown as region of ocean blue colour having velocity of 4m/s to 0 m/s.
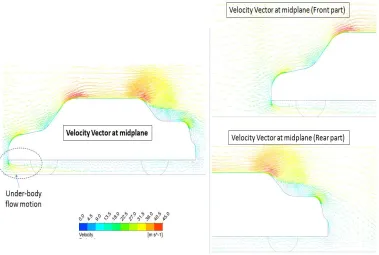
Therefore as above figure 2(b) shows graph for Cd with respective iteration Number is start form 0.461 and end at last iteration 0.461 means the coefficient of drag at 120km/hr (33.33m/sec) for sedan base Passenger car model. Similarly as shown in figure 3 the velocity vector on surface of base model air behaviour at front part of roof of passenger car model is increasing up to 40m/sec & similarly at rear part of roof is decreasing up to 9m/sec. Therefore this reason the air recirculation is increasing at the rear end of passenger car model. This is main problem for increasing drag value of passenger car model. This recirculation of air is minimise with the help using different type of tail plate at the rear end of passenger car model for increasing down force and improving stability of car model at high speed.
Figure 3 Velocity Vector on surface of the of Base Model passenger car
VII. SIMULATION AND TESTING OF PASSENGER CAR WITH TAIL PLATES LIKE RPP,RP1&RP2 FOR COEFFICIENT OF DRAG
Figure 4 Passenger car with Rectangular Tail plate at rear roof 120 inclination angle 2D & 3D
As shown in figure 4 shows the passenger car model with installing Rectangular tail plate at rear end of roof for decreasing coefficient of drag. The above CAD MODEL is imported in WORKBENCH ANSYS 16.O CFD software for generating surface meshing of passenger car model finding coefficient of drag with 120km/hr velocity. Surface meshing is very important for getting accurate result in CFD software the fine meshing on surface then result accuracy is also increasing. Similarly the air flowing in wind tunnel the sedan based car body is put in wind tunnel for next step of simulation with same boundary condition and simulation setup.
External aerodynamic simulation for a sedan based car model was carried out using ANSYS Workbench 16.0. Software, The necessary pre-processing activities such as computational domain preparation, meshing were performed with the help of ANSYS Design Modeler and Mesher. The ‘pressure based solver’ in ANSYS FLUENT 16.0 was chosen for these 3-Dimensional, Steady state simulations. In the boundary conditions for the simulations had been highlighted. Two equation SST k-ω turbulence model was applied. In order to have high accuracy, Second Order discretization schemes were chosen. Convergence for the simulation was defined based on the force balance over the iterations.
(a)
Figure 5 (a) Meshing of passenger car model with Tail plate, (b) CAD model with RP1 & RP2 tail Plate
(a) (b)
Figure 6 (a) Velocity Contour for RPP at 120Km/Hr, (b) Cd value for RPP at 120Km/hr with respective iteration Number.
(a) (b)
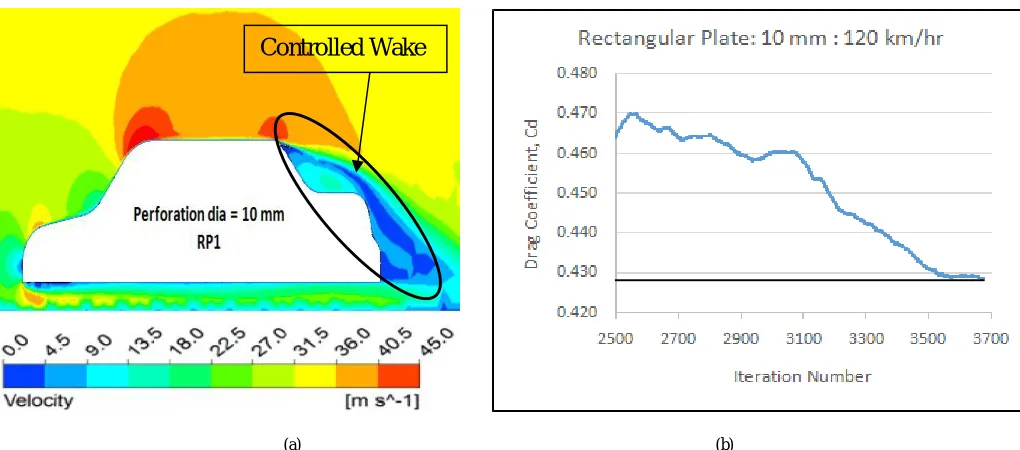
Figure 7 (a) Velocity Contour for RP1 at 120Km/Hr, (b) Cd value for RP1 at 120Km/hr with respective iteration Number
This section gives the results of all the parametric studies conducted using the baseline model and Rectangular Plane Plate (RPP) and Rectangular Plate with Perforation 10mm (RP1) & 20mm(RP2) diameter of hole respectively. With the help of WORKBENCH CFD software RPP, RP1 & RP2 is installed back side of the roof of passenger car at 12o inclination angle. RPP & RP1 tail plate of equal length but surface pattern is different are also simulated at identical angle for benchmarking of passenger car. It is helpful for observing the pattern of air flow at rear end of sedan base passenger car model. In this observation shown the behaviour of air flow in the form of velocity contour of Baseline
model (BM) of passenger car & the Rectangular Plane Tail plate (RPP), Rectangular Plate -10MM Perforation (RP1) & Rectangular Plate -20mm Perforation in Figure 2 & 6-8 (a) respectively.
As shown in figure 3 at the rear end of BM the large recirculation of air near the roof of car in velocity vector form. This consists of two counter-rotation vortices near the rear end of car. When all type of tail plate are used at rear end on roof of car in same angle like 120, therefore the air passing over the plane & perforation plate is controlled the wake. In the case of Rectangular Plane Plate (RPP), there is shown figure 6 (a) in velocity contour controlled the wake at rear end hence for this reason the reduced the coefficient of drag value from 0.461 to 0.452 shown in figure 6 (b) means the coefficient of drag decrees near about 2%. This is very great achievement for reducing the coefficient of drag when tail plate is attached at rear end of passenger car model.
Similarly the shown in figure 7 (a) the Rectangular Plate -10mm perforation (RP1) is installed back side of passenger car at roof with same angle the air circulation is flow very stream line than the RPP & BM. Therefore the coefficient of drag is reducing form 0.461 to 0.428 is shown in figure 7 (b). This is very great achievement in when tail plate is attached at rear end of passenger car model the coefficient of drag is reduce approximately 7.2%. It is less than the rectangular plane plate because of the perforation on plate is very good for reducing drag is told Bruneau et al [11].
(a) (b)
Figure 8 (a) Velocity Contour for RP2 at 120Km/Hr, (b) Cd value for RP2 at 120Km/hr with respective iteration Number
The Rectangular plate -20mm Perforation (RP2) is installed at rear end of Passenger car model with same angle and same length the air follow not stream line means the air travailing form roof toward the rear end the recirculation of air is increasing as compared therefore this is reason to increasing drag force because of wake at back side is increasing. In RP1 when air passing over car roof through the perforation tail plate is passing wake at back side of roof is controlled with the help of air passing into hole on tail plate, but when the diameter perforation hole is increasing the air passing through is maximum is opposed for stream line flow as shown in figure 8 (a & b). Therefore the RP2 tail plate is reduced the coefficient of drag from 0.461 to 0.454 is 1.5% less than the RPP & RP1.
table the RP1 tail plate is best than the other both plate. Means the coefficient of drag is decreasing maximum with the help of Rectangular Plate-10 mm perforation (RP1).
Table 5 comparison of Coefficient of Drag Value with or without tail plate
(a) (b)
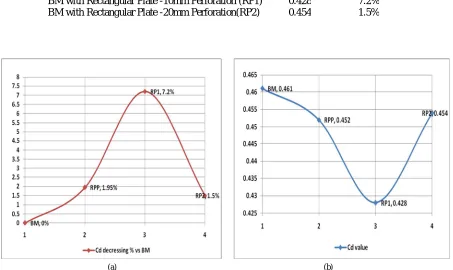
Figure 9 (a) Coefficient of drag decreasing % with Plate, (b) Coefficient of drag value with Plate
As shown in above figure 9 (a) & (b) the coefficient of drag decreasing in % with respective plate & Coefficient of drag value with respective plate respectively. When Rectangular Plate-10mm perforation is installed on baseline model is the coefficient of drag value is decreasing 7.2% and value is reducing from 0.461 to 0.428. This is very great achievement for increasing fuel efficiency and better handling at high speed. Similarly the effect shown for rectangular plane plate & Rectangular Plate- 20mm of coefficient of drag value is decreasing but the % decreasing is less than the RP1 plate. Therefore as per above observation
VIII. CONCLUSION
In this research paper work on the Sedan base passenger car simulation perform at 120 km/hr (33.33 m/sec) with the help of WORKBENCH ANSYS 16.0 CFD software with different tail plate is installed at back side at rear end of roof 120 of inclination angle & same length. In this analysis the coefficient of drag is decrees from 7.2%. Hence, is shown that the perforation on tail plate is very effective tool for reducing coefficient of drag. But the when the perforation on tail plate is increasing diameter result is not good means the coefficient of drag value reducing up to 1.5% is less than RP1 plate.
Plate Cd % of Cd vs BM
Baseline Model (BM) 0.461 --
The rectangular Plane plate is installed on sedan base passenger car the coefficient of drag up to 1.95% this is greater than the RP2 plate and less than the RP1 plate. Therefore the main objective of this paper is reducing the coefficient of drag of passenger car is maximum for increasing fuel efficiency and reducing the CO2 emission is help to
global warming. The coefficient of drag value is decreasing means the down force value is increasing this is help to improving the better handling of car at high speed.
REFERENCES
[1] B. Khalighia. "Aerodynamic flow around a sport utility vehicle-Computational and experimental investigation." Journal of Wind Engineering and Industrial Aerodynamics, vol.107-108, pp. 140–148, Aug.-Sep. 2012.
[2] S. Bickerstaffe. "Mercedes B Class Sets Aerodynamic Benchmark." Automotive Engineer Magazine, 2011.
[3] Ramesh K. Agrwal “ Sustainable ground transportation – Review of technologies, challenges and opportunities”, .International Journal of Energy & Environment, Volume 4, Issue 6, pp.1061-1078, 2013.
[4] Lynette Cheah & John Heywood, “Factor of Two: Halving the Fuel Consumption of New U.S. Automobiles by 2035”, laboratory for Energy and the Environment, Massachusetts Institute of Technology, Publication No. LFEE 2007-04 RP
[5] Chul-Ho KIM “A Streamlined Design of a High-speed Coach for Fuel Saving and Reduction of Carbon Dioxide”, International Journal of Automotive Engineering pp. 101-107, 2011.
[6] Ram Bansal and R. B. Sharma “Drag Reduction of Passenger Car Using Add-On Devices”, Hindawi Publishing Corporation Journal of Aerodynamics, Volume 2014, Article ID 678518, 13 pages.
[7] Alamaan Altaf, “Passive drag reduction of square back road vehicles”, Science Direct, J. Wind Eng. Ind. Aerodyn. Volume. 134 pp.30–43, 2014.
[8] Dongri Kim, “A bio-inspired device for drag reduction on a three-dimensional model vehicle”, IOP Publishing Ltd, Bioinspir. Biomim. doi:10.1088/1748-3190/11/2/026004, 2016.
[9] Manigandan. R, “CFD Simulation over a Passenger Car for Aerodynamic Drag Reduction”, IJSRD - International Journal for Scientific Research & Development, Vol. 3, , ISSN (online): 2321-0613, PP:1894-1897, Issue 02, 2015
[10] G. Siva and V. Loganathan, “Design and Aerodynamic Analysis of a Car to Improve Performance”, Middle-East J. Sci. Res., 24 (Recent Innovations in Engineering, Technology, Management & Applications): ISSN 1990-9233, PP: 133-140, 2016.