ABSTRACT
RAPER, GARRETT MATTHEW. North Carolina Performance Enhanced Relocatable Classroom Project: An Evaluation of Design Changes to a Typical Relocatable Classroom. (Under the direction of Dr. James W. Leach and Dr. Herbert M. Eckerlin)
In this study, the energy consumption of two relocatable classrooms located on the southern portion of the campus of Chapel Hill High School in Chapel Hill, NC is
investigated. One classroom, the control, was specified and purchased by the Chapel Hill-Carrboro City School System. The other is a performance enhanced classroom designed by the Florida Solar Energy Center and purchased by the North Carolina Solar Center. Both classrooms are 24’ by 40’ modular structures, completely underpinned, and located adjacent to one another for a side by side comparison. The energy consumption and indoor conditions of each classroom are monitored by a data-logging system that also records outdoor
conditions via a weather station.
The performance enhanced classroom is equipped with a 3 ton, SEER 12 heat pump controlled by a Bard CS2000 unit, six skylights, increased insulation and envelope sealing, a demand control ventilation system with an energy recovery wheel, and a day lighting system controlled by occupancy sensors. The control classroom is equipped with a wall-mounted 10 kW electric furnace/air conditioning system. A programmable thermostat was also installed in the control classroom after two months of data was collected. A building model is
NORTH CAROLINA PERFORMANCE ENHANCED RELOCATABLE CLASSROOM PROJECT: AN EVALUATION OF DESIGN CHANGES TO A
TYPICAL RELOCATABLE CLASSROOM
By
GARRETT MATTHEW RAPER
A thesis submitted to the Graduate Faculty of North Carolina State University
in the partial fulfillment of the requirements for the Degree of
Master of Science
MECHANICAL ENGINEERING
Raleigh, North Carolina 2005
APPROVED BY:
James W. Leach, Ph.D., Chair of Advisory Committee Date Department of Mechanical & Aerospace Engineering
DEDICATION
BIOGRAPHY
Garrett Matthew Raper was born in Concord, NC on December 30, 1980. After living in Kannapolis for several years, he and his family moved to nearby China Grove, NC in 1984. He received his primary and secondary education in the Rowan-Salisbury School System. In May of 1999, he graduated from South Rowan High School as the Salutatorian and was accepted to attend North Carolina State University. His interest in all things mechanical, especially automobiles, inspired him to major in Mechanical Engineering. In May of 2003, he graduated Cum Laude with a Bachelor of Science in Mechanical Engineering from North Carolina State University.
After graduation, he worked as a research assistant with the Industrial Assessment
ACKNOWLEDGEMENTS
The author would like to acknowledge the help and resources provided to make this project possible. The author wishes to thank the State Energy Office of North Carolina, the Department of Energy, and the National Association of State Energy Officials for providing the financial support to make this project possible.
Also, recognition is due to both the North Carolina Solar Center and the Florida Solar Energy Center for their support of the project. A special thanks is due Danny Parker, Stephanie Thomas-Rees, and John Sherwin from the Florida Solar Energy Center for instrumenting the classroom and making the data available online. I also wish to thank Mr. Kurt Creamer for his work setting up the project and helping adjust the systems. The Roger Carter Corporation’s cooperation in constructing the performance enhanced classroom was invaluable to the success of the project.
TABLE OF CONTENTS
LIST OF TABLES ... vii
LIST OF FIGURES ... viii
1.0 OBJECTIVE ... 1
2.0 INTRODUCTION ... 1
2.1 PROJECT BACKGROUND ... 3
2.2 PROJECT DESCRIPTION... 4
3.0 MEASURED RESULTS ... 9
3.1 MEASURED ENERGY AND COST SAVINGS ... 14
4.0 ENERGY-10 MODEL [11] ... 19
5.0 INDIVIDUAL IMPACTS OF DESIGN CHANGES... 23
5.1 IMPACT OF INCREASED INSULATION AND ENVELOPE SEALING ... 23
5.2 IMPACT OF T8 FIXTURES AND DAY LIGHTING ... 25
5.3 IMPACT OF HIGHER EFFICIENCY HVAC SYSTEM AND CONTROLS ... 29
5.3.1 PROGRAMMABLE THERMOSTATS... 33
5.3.2 BARD CS2000 UNIT ... 37
5.3.3 HEAT PUMP WITH BETTER INSULATION AND ENVELOPE SEALING.. 40
5.3.4 INCREASED MINIMUM OCCUPIED OUTSIDE AIR ... 42
5.3.5 HEAT PUMP WITH T8 FIXTURES ... 44
5.4 IMPACT OF SKYLIGHTS ON HVAC SYSTEMS... 45
6.0 CONCLUSIONS ... 48
LIST OF TABLES
Table 2.2.1: Building Construction Comparison [3] ... 6
Table 3.0.1: Experimental Measured Electrical Energy Use ... 10
Table 3.0.2: Control Measured Electrical Energy Use ... 11
Table 3.1.1: Summary of Measured Energy Savings ... 15
Table 3.1.2: Ventilation Rate and Resultant CO2 Concentrations (at 350 ppm outdoor concentration) [10]... 17
Table 4.0.1: Energy-10 Parameters... 20
Table 4.0.2: Comparison of Control Classroom Model and Measured Data... 22
Table 4.0.3: Comparison of Experimental Classroom Model and Measured Data ... 22
Table 5.1.1: Impact of Increased Insulation and Better Envelope Sealing on the Control Classroom’s Energy Consumption ... 24
Table 5.2.1: Impact of T8 Conversion ... 28
Table 5.3.1: Electric Furnace/Air Conditioner vs. Heat Pump ... 33
Table 5.3.1.1: Estimated Programmable Thermostat Savings ... 36
Table 5.3.2.1: Estimated CS2000 Savings... 38
Table 5.3.3.1: Comparison of Better Insulation and Envelope Sealing with a Heat Pump ... 41
Table 5.3.4.1: Impact of MOOA on Energy Consumption... 43
Table 5.3.5.1: Lighting Comparison with Heat Pump ... 45
LIST OF FIGURES
Figure 2.2.1: Units Located Side-by-Side... 5
Figure 2.2.2: Data-Logging System, Control Classroom ... 7
Figure 2.2.3: Weather Station ... 8
Figure 3.1.1: Sample Day CO2 Concentration... 17
Figure 5.2.1: Sample Day Lighting Profile... 25
Figure 5.2.2: Skylight View and Photocell Location... 26
Figure 5.2.3: Dimming Switch and Louver Timer ... 27
Figure 5.3.1: Ventilation Diagram [14] With CO2 Measurements ... 30
Figure 5.3.2: Closed Vent in the Experimental Classroom ... 31
Figure 5.3.1.1: HVAC Demand and Temperatures, Prior to Programmable Thermostat ... 34
Figure 5.3.1.2: HVAC Demand and Temperatures, After Installation of Programmable Thermostat ... 35
Figure 5.3.1.3: Installed Programmable Thermostat ... 35
Figure 5.3.2.1: Bard CS2000 Unit ... 38
Figure 5.3.2.2: CS2000 Holding Conditions During Unoccupied Sunday... 40
1.0 OBJECTIVE
The purpose of this project is to compare the operating costs of a standard relocatable classroom as purchased by a local school system to that of a performance enhanced relocatable classroom within the climate of central North Carolina. Modifications to the performance enhanced relocatable classroom, including those made to the HVAC, lighting, and building envelope, were designed to either reduce the energy consumption of the classroom or improve the learning environment for the occupants when compared to the standard relocatable classroom. Although the environmental concerns are as highly important to the school system as operating costs, this project focuses primarily on the
energy component of the performance enhanced relocatable classroom. The end result of this project is an estimate of the impact on energy consumption and operating costs attributed to each of the modifications based on both measured data and a building model.
2.0 INTRODUCTION
In school systems throughout North Carolina and other states, the installation of
usually less costly than permanent structures [2]. The relocatable classroom is often intended as a temporary solution until permanent facilities are constructed, but the units are seldom removed and often become permanent [3].
The Modular Building Institute, a trade association for the Commercial Factory-Built Structures Industry, estimates that 220,000 relocatable units are utilized by public schools throughout the United States [2]. According to data collected in 1999, relocatable
classrooms are located at 36% of the nation’s schools [1]. The relocatable classrooms utilized in this study are among the ten located at Chapel Hill High School in Chapel Hill, North Carolina. The Chapel Hill-Carrboro City School System, of which Chapel Hill High School is a part, utilized 42 relocatable classrooms throughout its school district during the 2003-2004 school year [4].
The large number of relocatable classrooms makes their design with regard to energy efficiency while also keeping initial costs as low as possible important. Some school systems specify the buildings to be constructed as inexpensively as possible, seeing them as a
more prevalent at schools nationwide, the issues surrounding life-cycle costs and public perception must be addressed through more energy efficient and learning conducive designs while maintaining the portability, low maintenance, and relative low costs of the current designs.
2.1 PROJECT BACKGROUND
This thesis project is conducted by the North Carolina Solar Center (NCSC) in partnership with the Florida Solar Energy Center (FSEC). Sponsorship for the project is provided by the State Energy Office of North Carolina, the Department of Energy (DOE), and the National Association of State Energy Officials (NASEO). FSEC has designed a series of performance enhanced relocatable classrooms and has previously installed them in both the warm climate of Florida and the cold climate of New York. Looking for an
intermediate climate in which to test their design, such as that provided by central North Carolina, FSEC agreed to place a unit in Chapel Hill, NC, and work with the NCSC to help investigate the design. The two centers work independently of one another to evaluate the project in North Carolina. Additionally, FSEC continues to monitor their designs in both New York and Florida.
classroom are intended to reduce the energy consumption, improve indoor conditions, or both as compared to the control unit. The impact of these modifications will depend greatly upon the specific design of the control classroom.
Although of great importance, the design changes intended to improve the learning environment of the control classroom are not within the scope of this thesis or its ability to measure results. An evaluation of these design changes would require far more investigation than has currently been completed. This thesis will focus primarily on the design changes intended to improve the relocatable classroom’s energy efficiency. The result is an estimate of the impact of each design change based upon measured data as well as a building model prepared using the Energy-10 software package.
2.2 PROJECT DESCRIPTION
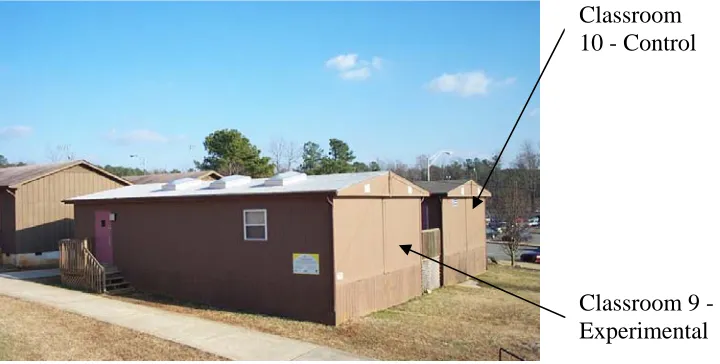
Two relocatable classrooms are located in Chapel Hill, NC, on the southern portion of Chapel Hill High School’s campus. The classrooms are part of a ten-unit cluster located at the school. Classroom 10 is a standard relocatable classroom specified and purchased by the Chapel Hill-Carrboro City School System. Classroom 9 is a performance enhanced
Figure 2.2.1: Units Located Side-by-Side
Some of the key features of the performance enhanced classroom are within its HVAC system. The experimental classroom is equipped with a 3 ton, SEER 12 heat pump that is more efficient than the 10 kW electric furnace/air conditioner found on the control
classroom. Additionally, the heat pump is equipped with a demand control ventilation system and an energy recovery wheel. The system is controlled by the Bard CS2000 occupancy sensor, which also controls the setback temperatures of the classroom during unoccupied periods. Building construction modifications that include more insulation, better envelope sealing, low-e glazing, and lighter roofing tiles help to lower the load on the HVAC system.
Classroom 10 - Control
Table 2.2.1: Building Construction Comparison [3]
Characteristic Standard Relocatable PERC
Floor Insulation R-11, standard R-15 Formaldehyde Free
Wall Insulation R-11, standard R- 15 Formaldehyde Free insulation w/ R-7 isocyanurate
Exterior Door Honeycomb core R= 1.626 Polystyrene core R= 4.8 Ceiling
Insulation
R- 19 batt insulation R-38 blown
Roof Dark colored asphalt shingle Light colored asphalt shingle w/ Techshield radiant barrier decking by Louisiana Pacific
Windows Single pane, aluminum frame (U= 1.10, SHGC= 0.86, Vt=0.90)
Low-E Argon gas filled, vinyl framed by Reynolds 200 Series (U=0.35, SHGC = 0.38, Vt=0.58) Lighting 16 fixtures @ (2) T12 34W lamps;
16 ballasts; Other: Bathroom (1) 60W incandescent bulb plus (2) outdoor lights @ 60W
10 fixtures @ (3) T8 32W lamps; 20 ballasts; Other: Bathroom (1) 13W CFL plus (2) outdoor lights @ 13W CFL
Light Controls Manual Sensor switch photosensor controls continuous dimming ballast with manual override
Outdoor Light Manually controlled Photosensor controlled
Skylights None (6) SunOptics Skylights
Interior Floor Finish
Roll carpeting Non-permeable backing, Interface Cubic carpet tile, low VOC glue Interior Wall
Finish
Vinyl covered gypsum Harmony Low Odor Latex Paint Heating System 10 kW electric resistance heat strip Bard SH Series Heat Pump, HSPF
7.5, 5 kW auxiliary heat strip Cooling System Bard WA423A1D Air Conditioner 3 ton Bard SH Series Heat Pump
with ERV, SEER 12, SH381-A1DR Ventilation
System
Fixed CFM during occupancy CO 2 control for ventilation with 3-step fan speed with ERV
HVAC controls Manual t-stat; replaced with a Honeywell Model CT8602C 7-day programmable unit in March, 2004
Bard CS2000 Energy Monitor
Bathroom Exhaust Fan
Broan, 4 sone, 100 CFM Broan Ultrasilent model #S80LU, 0.3 sone, 50 CFM
Duct Leakage CFM25out = 197 CFM25out = 182 Building
Leakage
Another outstanding feature of the experimental classroom is the integration of the lighting system with the skylights. Ten three bulb, continuously dimmable, T8 fixtures replace the sixteen two bulb, T12 fixtures in the control classroom. Six skylights provide natural light from the sun during daylight hours. A photocell senses the amount of sunlight gained through the skylights and allows the T8 fixtures to be dimmed, maintaining a
consistent level of light at the desktops while reducing energy consumption. Occupancy sensors are also employed to ensure the lights are turned off during unoccupied periods.
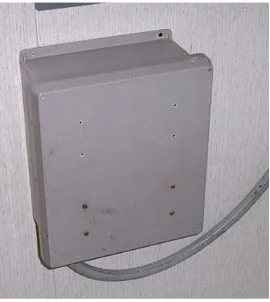
Both classrooms are connected to a data-logging system, part of which is depicted in Figure 2.2.2, that collects data at fifteen-minute intervals. The data-logger transmits the results from the previous day to FSEC each morning via a telephone modem. This data is posted to a website accessible at
http://www.logger.fsec.ucf.edu/cgi-bin/wg40.exe?user=baihppsp.
The data-logging system was installed in October of 2003; however, usable data was not available until December of the same year because of small adjustments required to the classrooms’ systems. The data set used for the calculations in upcoming sessions utilizes data collected during the 2004 calendar year, unless otherwise specified.
Average Watts over fifteen-minute intervals are recorded by the data-logging system using amperage readings from current transducers and voltage measurements taken in the individual classroom’s breaker box. Thermocouple wires are used to record the temperature of the supply air, return air, crawl space, attic, lighting fixture, and thermostat area in each relocatable classroom at every fifteen-minute interval. Additional temperatures are measured in the top and bottom of the skylight openings in the experimental classroom for each
interval. The data-logger also records the indoor lighting level (lux/m2), CO2 concentration
(ppm), and relative humidity (%) in each classroom at every interval. An outdoor weather station mounted to the side of the experimental classroom is pictured in Figure 2.2.3. This unit transmits the outdoor temperature, relative humidity, wind speed, and solar insolation to the data-logger at each interval.
The control classroom is utilized to teach English and literature classes while the experimental classroom is utilized to teach mathematics. These differences are the primary reason that design changes intended to improve the learning environment of relocatable classrooms cannot be analyzed with the current data set. Later sections will also show how the differing uses may effect the energy consumption of the individual classrooms.
3.0 MEASURED RESULTS
The data-logging system records the electrical energy consumption of four circuits within each classroom: the total usage of the classroom as well as the individual usage of the HVAC, lighting, and domestic hot water systems. The electrical energy consumption of the remaining circuits represents the plug loads, the consumption of the equipment connected to the classroom’s wall sockets, and is calculated by the difference between the total
Table 3.0.1: Experimental Measured Electrical Energy Use
Experimental – Classroom 9 Month Total
(kWh)
HVAC (kWh)
Lights (kWh)
Hot Water (kWh)
Plug Loads* (kWh)
Jan** 1,243 1,004 136 29 74
Feb 791 580 109 29 73
Mar 576 342 119 27 88
Apr 473 283 70 23 97
May 633 451 81 20 81
Jun 481 351 40 16 74
Jul 446 377 8 13 48
Aug 647 451 85 17 94
Sep 644 410 123 18 93
Oct 520 240 140 21 119
Nov 551 325 112 22 92
Dec 966 731 97 26 112
Tot 7,971 5,545 1,120 261 1,045
*
Values Not Directly Measured by the Data-Logging System
**
Period Prior to Adjustment of Dimming Control System
Table 3.0.2: Control Measured Electrical Energy Use Control – Classroom 10
Month Total (kWh)
HVAC (kWh)
Lights (kWh)
Hot Water (kWh)
Plug Loads* (kWh) Jan** 2,715 2,556 105 34 20 Feb** 2,164 1,993 115 31 25 Mar 972 757 142 31 42 Apr 525 324 135 27 39 May 518 323 110 22 63 Jun 377 225 76 19 57 Jul 316 195 55 16 50 Aug 457 285 104 19 49 Sep 549 327 141 21 60 Oct 409 190 135 27 57 Nov 651 446 119 31 55
Dec 1,836 1,676 79 34 47
Tot 11,489 9,297 1,316 312 564
*
Values Not Directly Measured by the Data-Logging System
**
Period Prior to Installation of the Programmable Thermostat
provide as near as possible set-point control logic in each classroom. The programmable thermostat is capable of returning the classroom to the occupied temperature by the time the occupied period begins. This eliminated the uncomfortable morning recovery periods and provides a better comparison to the experimental classroom, which automatically sets itself back during unoccupied periods. The remainder of the data in Table 3.0.2 reflects the change to the programmable thermostat. Savings from the installation of this unit are estimated by a building model in a later section.
Comparing the plug loads expressed in Tables 3.0.1 and 3.0.2, it can be seen that the plug loads in the experimental classroom are significantly higher than those in the control classroom. It is speculated that part of this difference is due to the differing classes taught in each of the classrooms; the experimental classroom is used to teach mathematics while the control classroom is used to teach English and literature classes. While both classrooms are equipped with an overhead projector, it is speculated that the teacher in the experimental classroom uses the overhead projector more often than the teacher in the control classroom because of the nature of the mathematics versus English and literature curriculums. Indeed, during a day of collecting data while the classrooms were occupied, it was noted that the overhead projector was being used in the experimental classroom and not in the control.
classroom is commonly left operating while the system in the control classroom is shut down. These two factors appear to be the primary contributors to the plug load differences.
The matter of differing plug loads from one classroom to another is important when comparing the HVAC loads from the classrooms. The discrepancy cannot be reconciled by subtracting their difference from the experimental classroom’s plug loads and adding it back to its HVAC usage. Because the classrooms are contained, closed systems, all the electrical energy consumed by equipment through the wall sockets is converted to heat and dissipated into the classroom space. The conversion efficiency of this energy to heat is 100%. The control classroom is equipped with a 10 kW electric furnace that is also essentially 100% efficient. Any heat from equipment within the classroom space such as lights, overhead projectors, and computers reduces the power the HVAC system must provide to heat the control classroom by the amount of electrical energy consumed by this equipment. This is true because the conversion efficiency of electrical energy to heat is the same for all of these, 100%.
HVAC system. The reason the plug loads cannot be reconciled by simply subtracting the difference from the experimental classroom’s plug loads and adding it back to the HVAC usage is the differing efficiencies.
A similar case is true during the cooling season, except the heat created by the
equipment within the building must be removed by the air conditioner. Like a heat pump, an air conditioner can remove more heat from the classroom than it consumes in electrical energy; however, since both classrooms are equipped with air conditioning units, the difference in the plug loads is less significant. Additionally, because the experimental classroom’s air conditioning unit is more efficient than the control’s, the difference is even less significant than if the two units were the same efficiency.
3.1 MEASURED ENERGY AND COST SAVINGS
Table 3.1.1: Summary of Measured Energy Savings Experimental Savings
Month Total (kWh)
HVAC (kWh)
Lights (kWh)
Hot Water (kWh)
Plug Loads (kWh)
Jan 1,472 1,552 -31 5 -54
Feb 1,373 1,413 6 2 -48
Mar 396 415 23 4 -46
Apr 52 41 65 4 -58
May -115 -128 29 2 -18
Jun -104 -126 36 3 -17
Jul -130 -182 47 3 2
Aug -190 -166 19 2 -45
Sep -95 -83 18 3 -33
Oct -111 -50 -5 6 -62
Nov 100 121 7 9 -37
Dec 870 945 -18 8 -65
Tot 3,518 3,752 196 51 -481
During the 2004 calendar year, the experimental classroom’s overall energy
consumption was 3,518 kWh less than the control classroom, a 30.6% reduction in energy use. This equates to a total cost savings of $339.44 for this time period. Measured results from the HVAC system indicate savings of 3,752 kWh and $362.02 in the experimental classroom, a 40.4% reduction. The day lighting and T8 conversion resulted in savings of 227 kWh and $21.90 after the controls were adjusted in January, a savings of 18.7%.
indicates that classrooms should have a minimum ventilation rate of 15 cfm of outside air per occupant [6]. Studies indicate that many relocatable classrooms do not meet this minimum requirement [7].
Investigations conducted by FSEC among relocatable classrooms in Florida show that nearly all relocatable classrooms are shipped with the HVAC system’s outside air dampers closed, and that these dampers are either not opened when the classrooms are installed or only opened to the minimum position of approximately 150 cfm, the equivalent rate for ten occupants [8]. Further investigations performed for a project with the North Carolina State University Industrial Assessment Center (NCSU IAC) found only six of twenty-three outside air dampers operating properly at two locations within Wake County, North Carolina [9]. These findings indicate that the control classroom’s ventilation rate most likely falls below the minimum requirement.
Figure 3.1.1 shows the CO2 concentration profile for a day chosen at random during the
study period. The concentrations peak at 2,293 ppm in the control and 1,424 in the experimental. Since the two classrooms contain approximately the same number of
occupants, this indicates that the control classroom’s ventilation rate is lower than that of the experimental classroom. Table 3.1.2 illustrates the relationship between indoor CO2
May 6, 2004
0 500 1000 1500 2000 2500
0:00 6:00 12:00 18:00 0:00
Time of Day
CO2 (PPM)
EXPCO2
CNTCO2
Figure 3.1.1: Sample Day CO2 Concentration
Table 3.1.2: Ventilation Rate and Resultant CO2 Concentrations (at 350 ppm outdoor concentration) [10]
Indoor CO2 (ppm, approximate)
Outside Air Ventilation (cfm per person)
CO2 Differential (Inside - Outside)
800 20 500
1,000 15 650
1,400 10 1,050
2,400 5 2,050
ventilation air in the experimental classroom than in the control during the heating season; but, because of the differences in efficiencies, the HVAC system in the experimental
classroom does not consume as much energy as the control classroom’s system even though it supplies more energy to the incoming ventilation air. The difference is only apparent during the cooling months because the efficiencies of the classrooms’ cooling system are more comparable than their heating systems.
Although the ventilation rate in the experimental classroom is higher than the ventilation rate in the control, both appear to be below the minimum ASHRAE recommendation. The reasons for this as well as an estimated cost of the increased infiltration will be discussed in a later section.
In addition to an increased level of ventilation, the experimental classroom is outfitted with six skylights. Although the skylights are glazed to reduce the amount of solar radiation that passes through them, the amount of radiation that infiltrates the room may be enough to significantly increase the cooling load during the cooling season. However, the increased load on the cooling system may be offset by the benefits of the solar radiation during the heating season. The Energy-10 building model will be used to investigate the skylights and their effect on the HVAC system in a later section.
classroom than in the control. During the cooling season, this increased energy created in the classroom must be removed by the cooling system in addition to the heat created by the occupants, ventilation, and lighting system. The difference in the plug loads is
approximately 2.5 times higher than the savings from the day lighting system alone. The significance of these increased plug loads will also be investigated in an upcoming section.
4.0 ENERGY-10 MODEL [11]
A model of both the control and experimental classrooms was prepared using the
Energy-10 software package. Because many changes were made to the design of the control classroom and the systems are interdependent upon one another, the model is used to isolate the design changes and estimate their individual impacts on the control classroom’s design.
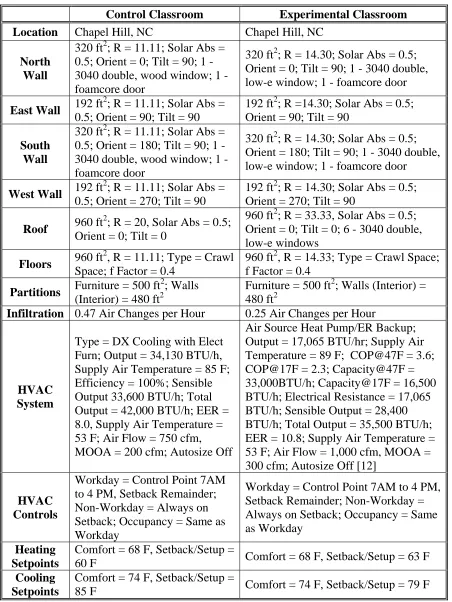
Table 4.0.1: Energy-10 Parameters
Control Classroom Experimental Classroom
Location Chapel Hill, NC Chapel Hill, NC North
Wall
320 ft2; R = 11.11; Solar Abs = 0.5; Orient = 0; Tilt = 90; 1 - 3040 double, wood window; 1 - foamcore door
320 ft2; R = 14.30; Solar Abs = 0.5; Orient = 0; Tilt = 90; 1 - 3040 double, low-e window; 1 - foamcore door East Wall 192 ft
2
; R = 11.11; Solar Abs = 0.5; Orient = 90; Tilt = 90
192 ft2; R =14.30; Solar Abs = 0.5; Orient = 90; Tilt = 90
South Wall
320 ft2; R = 11.11; Solar Abs = 0.5; Orient = 180; Tilt = 90; 1 - 3040 double, wood window; 1 - foamcore door
320 ft2; R = 14.30; Solar Abs = 0.5; Orient = 180; Tilt = 90; 1 - 3040 double, low-e window; 1 - foamcore door West Wall 192 ft
2
; R = 11.11; Solar Abs = 0.5; Orient = 270; Tilt = 90
192 ft2; R = 14.30; Solar Abs = 0.5; Orient = 270; Tilt = 90
Roof 960 ft
2
; R = 20, Solar Abs = 0.5; Orient = 0; Tilt = 0
960 ft2; R = 33.33, Solar Abs = 0.5; Orient = 0; Tilt = 0; 6 - 3040 double, low-e windows
Floors 960 ft
2
, R = 11.11; Type = Crawl Space; f Factor = 0.4
960 ft2, R = 14.33; Type = Crawl Space; f Factor = 0.4
Partitions Furniture = 500 ft
2
; Walls (Interior) = 480 ft2
Furniture = 500 ft2; Walls (Interior) = 480 ft2
Infiltration 0.47 Air Changes per Hour 0.25 Air Changes per Hour
HVAC System
Type = DX Cooling with Elect Furn; Output = 34,130 BTU/h, Supply Air Temperature = 85 F; Efficiency = 100%; Sensible Output 33,600 BTU/h; Total Output = 42,000 BTU/h; EER = 8.0, Supply Air Temperature = 53 F; Air Flow = 750 cfm, MOOA = 200 cfm; Autosize Off
Air Source Heat Pump/ER Backup; Output = 17,065 BTU/hr; Supply Air Temperature = 89 F; COP@47F = 3.6; COP@17F = 2.3; Capacity@47F = 33,000BTU/h; Capacity@17F = 16,500 BTU/h; Electrical Resistance = 17,065 BTU/h; Sensible Output = 28,400 BTU/h; Total Output = 35,500 BTU/h; EER = 10.8; Supply Air Temperature = 53 F; Air Flow = 1,000 cfm, MOOA = 300 cfm; Autosize Off [12]
HVAC Controls
Workday = Control Point 7AM to 4 PM, Setback Remainder; Non-Workday = Always on Setback; Occupancy = Same as Workday
Workday = Control Point 7AM to 4 PM, Setback Remainder; Non-Workday = Always on Setback; Occupancy = Same as Workday
Heating Setpoints
Comfort = 68 F, Setback/Setup =
60 F Comfort = 68 F, Setback/Setup = 63 F Cooling
Setpoints
Comfort = 74 F, Setback/Setup =
The model assumes that each classroom is continuously occupied by 20 persons throughout the occupied periods, although this is not truly the case. Average hourly values for lighting Wattage within the model were derived from measured data within the control classroom and used for both classrooms. Savings from day lighting are estimated from these values within the experimental classroom by specifying continuously dimmable ballasts and from TMY insolation data. Hot water usage and other internal gains were computed
individually for each classroom using measured data. This accounted for the experimental classroom’s increased plug loads within the model.
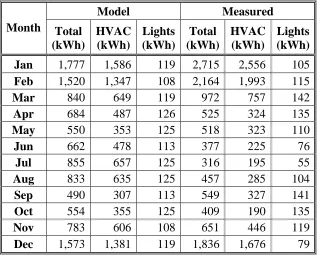
Table 4.0.2: Comparison of Control Classroom Model and Measured Data Model Measured Month Total
(kWh) HVAC (kWh) Lights (kWh) Total (kWh) HVAC (kWh) Lights (kWh) Jan 1,777 1,586 119 2,715 2,556 105 Feb 1,520 1,347 108 2,164 1,993 115 Mar 840 649 119 972 757 142 Apr 684 487 126 525 324 135 May 550 353 125 518 323 110 Jun 662 478 113 377 225 76 Jul 855 657 125 316 195 55 Aug 833 635 125 457 285 104 Sep 490 307 113 549 327 141 Oct 554 355 125 409 190 135 Nov 783 606 108 651 446 119 Dec 1,573 1,381 119 1,836 1,676 79
Table 4.0.3: Comparison of Experimental Classroom Model and Measured Data Model Measured Month Total
5.0 INDIVIDUAL IMPACTS OF DESIGN CHANGES
This section discusses the individual impacts on the energy consumption of the classrooms due to the individual design changes. The measured results as well as the Energy-10 model are used to isolate the individual design changes in an attempt to estimate their impact independently of the other changes. This section also discusses, in more detail than previous sections, the design changes as well as their intended impact and unforeseen issues with the performance enhanced design, if any.
5.1 IMPACT OF INCREASED INSULATION AND ENVELOPE SEALING
Table 5.1.1: Impact of Increased Insulation and Better Envelope Sealing on the Control Classroom’s Energy Consumption
Standard Insulation, Natural Air Changes
per Hour = 0.47
Increased Insulation, Natural Air Changes
per Hour = 0.25 Month Total (kWh) HVAC (kWh) Total (kWh) HVAC (kWh)
Jan 1,777 1,586 1,273 1,081
Feb 1,520 1,347 1,090 916
Mar 840 649 568 376
Apr 684 487 560 363
May 550 353 498 300
Jun 662 478 642 458
Jul 855 657 819 621
Aug 833 635 798 600
Sep 490 307 488 304
Oct 554 355 417 218
Nov 783 606 525 349
Dec 1,573 1,381 1,154 963
Tot 11,121 8,841 8,832 6,549
The values represented in Table 5.1.1 use the building model for the control classroom, only modifying the values for the insulation and air changes per hour. As expected, the values during the months dominated by cooling do not differ significantly, while the months dominated by heating do change significantly. As discussed in previous sections, this is most likely do to the differences in the efficiencies of the heating and cooling systems. The
savings for a classroom equipped with a heat pump system would be different than those expressed in Table 5.1.1. These differences will be shown in an upcoming section.
Table 5.1.1 indicates a total yearly energy savings of 21.4%. This value is likely
the study period and in which little savings occur. A reduction of this amount to the
measured energy consumed during the study period would result in a yearly savings of 2,460 kWh and $237.
5.2 IMPACT OF T8 FIXTURES AND DAY LIGHTING
The performance enhanced relocatable classroom is fitted with ten three bulb, continuously dimmable T8 fixtures instead of the sixteen two bulb, non-dimmable T12 fixtures installed in the control classroom. Each dimmable T8 fixture is controlled by two ballasts while each T12 fixture is controlled by a single ballast. The experimental classroom utilizes two occupancy sensors to control the operation of the fixtures while the control classroom utilizes two standard switches, each controlling half of the fixtures. Figure 5.2.1 shows the lighting profile from the same random day in Figure 3.1.1.
May 6, 2004
0 200 400 600 800 1000
0:00 6:00 12:00 18:00 0:00
Time of Day
15 M
inu
te
De
mand (W)
0 200 400 600 800 1000
W/
m
^
2
EXPLTS
The performance enhanced experimental classroom is also fitted with six skylights that provide natural light during daylight hours. A photocell senses the amount of light that enters through the skylights and sends a signal to a control box which, in turn, dims the lights to maintain a constant level of lighting at the desktop. The location of this sensor as well as one of the skylights is depicted in Figure 5.2.2. When the lights are dimmed, they also use less energy than when they are fully illuminated. This can be observed in Figure 5.2.1. Additionally, the ambient light from the skylights may provide better indoor conditions that are more conducive to learning; however, the evaluation of this statement is not within the scope of this thesis project.
Figure 5.2.2: Skylight View and Photocell Location
Louvers located in the skylights allow the room to be darkened when necessary. The louvers are controlled by a timer pictured in Figure 5.2.3. The lights can also be dimmed or brightened with the dimming switch, also pictured in Figure 5.2.3.
Figure 5.2.3: Dimming Switch and Louver Timer
When initially installed, the dimming control unit was adjusted to the factory suggested settings for the classroom application. However, data showed that the lights in the
experimental unit were actually using more energy than the lights in the control. Also, the teacher in the experimental classroom was concerned that the noticeable dimming rate of the lights may have been disrupting students. The control unit was adjusted at the end of
January, 2004 using a hand-held photometer to provide 50 ft-candles of light at the darkest desk within the room. The dimming rate of the lights was also adjusted to provide a dimming response that was less noticeable, but slower.
will be discussed in an upcoming section. The savings from day lighting cannot be estimated for this case because of limitations within the Energy-10 software package.
Table 5.2.1: Impact of T8 Conversion
16 - 2 Bulb, T12 Fixtures, No Day
Lighting
10 - 3 Bulb, T8 Fixtures, 2 Ballasts per
Fixture, No Day Lighting
10 - 3 Bulb, T8 Fixtures, 1 Ballast per
Fixture, No Day Lighting Month Total (kWh) HVAC (kWh) Lights (kWh) Total (kWh) HVAC (kWh) Lights (kWh) Total (kWh) HVAC (kWh) Lights (kWh) Jan 1,777 1,586 119 1,779 1,563 142 1,775 1,612 91 Feb 1,520 1,347 108 1,529 1,335 129 1,510 1,362 82 Mar 840 649 119 851 637 142 827 664 91 Apr 684 487 126 705 484 149 659 492 95 May 550 353 125 581 359 149 513 345 95 Jun 662 478 113 693 488 136 622 465 87 Jul 855 657 125 891 668 149 812 643 95 Aug 833 635 125 869 646 149 790 622 95 Sep 490 307 113 521 315 136 452 296 87 Oct 554 355 125 578 355 149 526 357 95 Nov 783 606 108 795 597 129 768 617 82 Dec 1,573 1,381 119 1,580 1,365 142 1,564 1,401 91 Tot 11,121 8,841 1,425 11,372 8,812 1,701 10,818 8,876 1,086
heat is 100% in both cases. Only during months with cooling loads are savings realized. The conversion to T8 fixtures will be discussed again in a later section when coupled with a heat pump.
5.3 IMPACT OF HIGHER EFFICIENCY HVAC SYSTEM AND CONTROLS The performance enhanced relocatable classroom is equipped with a 3-ton, SEER 12, wall-mounted heat pump as opposed to the wall-mounted 10 kW electric furnace/air
conditioning unit the control classroom utilizes. The heat pump was originally installed with 10 kW of electric resistance backup heating, but this was reduced to 5 kW before the study period began to further reduce energy consumption. It is also equipped with an energy recovery wheel designed to pre-condition ventilation air with air that is exhausted from the classroom.
The heat pump uses a demand control ventilation system that monitors indoor CO2
levels. The system adjusts the speeds of the exhaust and outside air fans to control the amount of ventilation air to provide just enough ventilation for the number of current occupants. Then ventilation system does not operate the fans below about 450 ppm CO2,
operates them low speed between about 450 and 750 ppm, medium speed between about 750 and 1,000 ppm, and on high speed above about 1,000 ppm. A diagram of the ventilation system along with the heat recovery wheel is depicted in Figure 5.3.1. Measurements of CO2
Figure 5.3.1: Ventilation Diagram [14] With CO2 Measurements 1) 2,372 ppm 2) 2,460 ppm
547 ppm
1) r – 902 ppm l – 731 ppm 2) r – 1,017 ppm l – 730 ppm Energy Recovery
Previous studies performed by the NCSU IAC suggest that a large portion of the outside ventilation air that enters the HVAC unit does not make its way into the classroom space, but is recirculated back out through the exhaust [9]. As depicted in Figure 5.3.1, there are no dampers in the ventilation portion of the HVAC unit to direct the flow of air. The design depends upon pressure differentials to move the air to its intended location, so, when the pressure differentials are changed, the system does not perform as designed. Figure 5.3.2 shows an air vent in the experimental classroom that has been closed. Several other vents within the classroom are also closed in an effort to help better distribute the air within the classroom. These closed vents were also documented in the control classroom, perhaps indicating an HVAC duct design flaw within both classrooms.
Figure 5.3.2: Closed Vent in the Experimental Classroom
experimental classroom. It is speculated that the recirculation problem is caused by the altered pressure differentials due to the closed vents within the classroom. The energy recovery wheel is probably not effective at preconditioning the outside ventilation air because of the large amount of recirculation. Additionally, the effect of the energy recovery wheel could not be modeled using the Energy-10 software.
A Bard CS2000 unit controls the HVAC system, acting as an occupancy sensor and returning the temperature of the classroom to setback conditions when there is no movement within the classroom for a specified period of time. The unit also handles the setback/setup temperature control for the classroom, and can learn the occupancy of the classroom
eliminating the need to program the unit. Savings from the installation of the CS2000 unit are discussed in a later section.
Table 5.3.1: Electric Furnace/Air Conditioner vs. Heat Pump Electric
Furnace/Air Conditioner
Heat Pump Month
Total (kWh)
HVAC (kWh)
Total (kWh)
HVAC (kWh) Jan 1,777 1,586 1,217 1,025 Feb 1,520 1,347 1,079 905 Mar 840 649 537 345 Apr 684 487 473 276 May 550 353 467 268 Jun 662 478 582 399 Jul 855 657 742 544 Aug 833 635 723 525 Sep 490 307 439 254 Oct 554 355 415 217 Nov 783 606 495 318 Dec 1,573 1,381 1,021 829 Tot 11,121 8,841 8,190 5,905
According to the Energy-10 model, replacing the 10 kW electric furnace/air conditioner with a 3 ton, SEER 12 heat pump reduces yearly energy consumption by approximately 26.1%. As expected, the model suggests that the greatest savings occur in the months dominated by heating. This reduction in energy consumption saves approximately $200 per year.
5.3.1 PROGRAMMABLE THERMOSTATS
more than a few degrees each night so the classroom would already be at conditions when she arrived. Figure 5.3.1.1 shows the temperature at the thermostat, ambient temperature, and demand curve for the HVAC system for both classrooms before the programmable thermostat was installed in the control classroom.
January 15, 2004
0 1000 2000 3000 4000 5000 6000 7000
0:00 6:00 12:00 18:00 0:00
Time of Day
D em a nd ( W ) 30 35 40 45 50 55 60 65 70 75 80 Te m p er at ur e ( F ) EXPHVC CONHVC CTSTAT ETSTAT AMBTMP
Figure 5.3.1.1: HVAC Demand and Temperatures, Prior to Programmable Thermostat
To compare the classrooms on a more even basis, a programmable thermostat was installed in the control classroom at the beginning of March, 2004. Figure 5.3.1.2 shows the same parameters depicted in Figure 5.3.1.1 after the installation of the programmable
March 15, 2004 0 2000 4000 6000 8000 10000 12000
0:00 6:00 12:00 18:00 0:00
Time of Day
D em a nd ( W ) 30 35 40 45 50 55 60 65 70 75 80 T emp eratu
re (F) EXPHVC
CONHVC
CTSTAT ETSTAT
AMBTMP
Figure 5.3.1.2: HVAC Demand and Temperatures, After Installation of Programmable Thermostat
Figure 5.3.1.3: Installed Programmable Thermostat
temperature so that the occupants are comfortable when they arrive. This eliminated the comfort issues expressed by the teacher in the control classroom. Table 5.3.1.1 compares the estimated savings from installing a programmable thermostat versus a thermostat with no setback using the Energy-10 model. Once again, these values are for the HVAC system in the control classroom and would differ if a heat pump were utilized.
Table 5.3.1.1: Estimated Programmable Thermostat Savings No Setback With Setback
Month Total (kWh)
HVAC (kWh)
Total (kWh)
HVAC (kWh) Jan 2,704 2,513 1,777 1,586 Feb 2,207 2,033 1,520 1,347
Mar 1,260 1,068 840 649
Apr 910 714 684 487
May 726 527 550 353
Jun 877 693 662 478
Jul 1,096 898 855 657
Aug 1,079 881 833 635
Sep 672 489 490 307
Oct 746 548 554 355
Nov 1,174 996 783 606
Dec 2,317 2,125 1,573 1,381 Tot 15,768 13,485 11,121 8,841
occupants. It is worthy to note, though, that the electric bill for the control classroom was reduced $3.47 per day when comparing the bills from January, 2004 and January, 2005, a significant cost saving.
5.3.2 BARD CS2000 UNIT
As described earlier, the Bard CS2000 unit acts as both an occupancy sensor as well as a programmable thermostat. The unit has the ability to learn the occupancy of the classroom and control the internal conditions accordingly. The CS2000 cannot be exactly modeled in Energy-10, but a close approximation is to model it as a programmable thermostat. One of the unit’s drawbacks is that it cannot be programmed to setback as far as the programmable thermostat. The CS2000 unit is set to hold the classroom between 68ºF and 74ºF during occupied hours and setback to temperatures between approximately 63ºF and 79ºF during unoccupied hours.
The unit acts as a thermostat interrupt, so there is a thermostat located within the
Figure 5.3.2.1: Bard CS2000 Unit
Table 5.3.2.1: Estimated CS2000 Savings
With CS2000 Unit Without CS2000 Unit Month Total
(kWh)
HVAC (kWh)
Total (kWh)
HVAC (kWh)
Jan 1,283 1,064 1,671 1,453
Feb 1,127 930 1,433 1,236
Mar 527 310 779 562
Apr 598 379 729 511
May 683 462 802 582
Jun 83 679 1,006 801
Jul 1,067 846 1,204 984
Aug 1,038 819 1,186 964
Sep 654 449 764 560
Oct 516 275 653 414
Nov 487 287 714 513 Dec 1,106 886 1,411 1,191 Tot 9,969 7,386 12,352 9,771
with programmable thermostats. However, the CS2000 unit is not without its drawbacks. The savings in Table 12 are most likely higher than that of the actual savings. Both Figures 5.3.1.1 and 5.3.1.2 show a ‘spike’ in the demand curves for the experimental classroom late in the afternoon. It is speculated that this ‘spike’ in energy use is due to the janitor entering the classroom and the occupancy sensor of the CS2000 unit detecting his presence since a corresponding ‘spike’ is not seen in the control classroom. This ‘spike’ is also seen in the lighting demand curve, further supporting the theory of the janitor’s occupation. Figure 5.3.1.1 shows that the HVAC system utilized the electric strip backup heat during the period to return the classroom to temperature. This ‘spike’ in the late afternoon reduces the
effectiveness of the CS2000 unit and causes the experimental classroom to use more energy during this period than if a simple programmable thermostat was installed.
September 5, 2004 0 500 1000 1500 2000 2500 3000
0:00 6:00 12:00 18:00 0:00
Time of Day
D em a nd ( W ) 68 70 72 74 76 78 80 82 T emp eratu re (F) EXPHVC EXPLTS ETSTAT
Figure 5.3.2.2: CS2000 Holding Conditions During Unoccupied Sunday
Figure 5.3.2.2 clearly shows that the experimental classroom is unoccupied because the lighting circuit, controlled by occupancy sensors, shows no usage. However, the CS2000 unit has mistakenly learned that Sundays are occupied and therefore conditions the interior space accordingly. This occurs during several Sundays during this time period. After
consulting engineers from Bard, the CS2000 unit was reset by disconnecting its power supply for a weekend; but, had the classroom not been monitored with data-logging equipment, this mistake would not have been caught and much energy and money would have been wasted.
with the addition of a heat pump and the control classroom’s building model modified with both the addition of a heat pump and better insulation and envelope sealing.
Table 5.3.3.1: Comparison of Better Insulation and Envelope Sealing with a Heat Pump
Standard Insulation and Envelope Sealing
Better Insulation and Envelope Sealing Month
Total (kWh)
HVAC (kWh)
Total (kWh)
HVAC (kWh) Jan 1,217 1,025 1,047 855 Feb 1,079 905 946 774 Mar 537 345 462 270 Apr 473 276 449 252 May 467 268 466 268 Jun 582 399 588 405 Jul 742 544 743 544 Aug 723 525 723 524 Sep 439 254 448 265 Oct 415 217 389 191 Nov 495 318 428 252 Dec 1,021 829 880 689 Tot 8,190 5,905 7,569 5,289
Estimated savings from installing better insulation and envelope sealing after a heat pump has been installed is only 7.6%. This equates to a savings of approximately $59.92 per year. The data in Table 5.3.3.1 actually estimates increased usage during the summer
5.3.4 INCREASED MINIMUM OCCUPIED OUTSIDE AIR
As stated in earlier sections, the ventilation rate in the control classroom is suspected to be below the ASHRAE minimum recommendation of 15 cfm per occupant. The Energy-10 model assumes that the classrooms are occupied by 20 persons during the occupied periods. This equates to a minimum ventilation rate, or minimum occupied outside air (MOOA) of 300 cfm. Because the performance enhanced classroom is equipped with a demand control ventilation system that actively controls the indoor CO2 concentrations, the MOOA value of
300 cfm was used to calculate its energy consumption. However, measurements within the control classroom indicate that its MOOA value could be as low as 100 cfm, although probably unlikely. Therefore, the Energy-10 model estimates the energy consumption of the control classroom using an MOOA value of 200 cfm.
Although the lower value for MOOA results in decreased energy consumption, it does not meet the minimum ASHRAE requirement. Table 5.3.4.1 compares the energy
Table 5.3.4.1: Impact of MOOA on Energy Consumption Electric
Furnace/Air Conditioner, MOOA = 200
cfm
Electric Furnace/Air Conditioner, MOOA = 300
cfm
Heat Pump, MOOA = 200
cfm
Heat Pump, MOOA = 300
cfm Month Total (kWh) HVAC (kWh) Total (kWh) HVAC (kWh) Total (kWh) HVAC (kWh) Total (kWh) HVAC (kWh) Jan 1,777 1,586 2,050 1,858 1,217 1,025 1,394 1,202 Feb 1,520 1,347 1,752 1,579 1,079 905 1,248 1,075 Mar 840 649 965 773 537 345 591 400 Apr 684 487 759 562 473 276 504 307 May 550 353 574 376 467 268 474 275 Jun 662 478 684 500 582 399 597 414 Jul 855 657 894 696 742 544 767 569 Aug 833 635 874 676 723 525 751 553 Sep 490 307 496 313 439 254 440 258 Oct 554 355 606 408 415 217 427 228 Nov 783 606 884 707 495 318 544 368 Dec 1,573 1,381 1,798 1,607 1,021 829 1,169 978 Tot 11,121 8,841 12,336 10,055 8,190 5,905 8,906 6,627
5.3.5 HEAT PUMP WITH T8 FIXTURES
As discussed in a previous section, the change from T12 to T8 fixtures in a classroom with electric resistance heating does not save an appreciable amount of energy. However, when the classroom is equipped with a heat pump, the conversion efficiency of the electrical energy to heat may be different enough for the T8 fixtures and the heat pump to have a larger impact on the overall energy consumption of the classroom.
As for the electric furnace/air conditioner, three situations will be modeled with the heat pump system on the control classroom’s model: the current sixteen two bulb, single ballast per fixture T12 lights, the ten three bulb, two ballasts per fixture T8 lights in the experimental classroom, and the ten three bulb, single ballast per fixture T8 lights found to be more
Table 5.3.5.1: Lighting Comparison with Heat Pump
16 - 2 Bulb, T12 Fixtures, No Day Lighting, Heat Pump
10 - 3 Bulb, T8 Fixtures, 2 Ballasts per
Fixture, No Day Lighting, Heat Pump
10 - 3 Bulb, T8 Fixtures, 1 Ballast per
Fixture, No Day Lighting, Heat Pump Month Total (kWh) HVAC (kWh) Lights (kWh) Total (kWh) HVAC (kWh) Lights (kWh) Total (kWh) HVAC (kWh) Lights (kWh) Jan 1,217 1,025 119 1,231 1,016 142 1,202 1,038 91 Feb 1,079 905 108 1,095 900 129 1,059 911 82 Mar 537 345 119 556 342 142 515 351 91 Apr 473 276 126 499 278 149 443 277 95 May 467 268 125 498 274 149 429 260 95 Jun 582 399 113 612 407 136 545 389 87 Jul 742 544 125 775 552 149 702 532 95 Aug 723 525 125 756 534 149 684 515 95 Sep 439 254 113 468 262 136 403 246 87 Oct 415 217 125 442 219 149 382 213 95 Nov 495 318 108 514 316 129 472 322 82 Dec 1,021 829 119 1,038 823 142 1,002 839 91 Tot 8,190 5,905 1,425 8,484 5,923 1,701 7,838 5,893 1,086
Table 5.3.5.1 shows that the change from T12 to T8 fixtures does not have a significant impact on the consumption of the heat pump HVAC system. It does, however, reiterate the importance of choosing the correct fixture, showing that the improper T8 fixture may actually consume more energy than its T12 counterpart. Table 5.3.5.1 also shows that the change to T8, single ballast fixtures saves only $33.96 per year without daylighting.
5.4 IMPACT OF SKYLIGHTS ON HVAC SYSTEMS
available through the skylights, maintaining a constant light level of light at the desktops. Another consideration in the addition of the skylights was to improve the learning
environment of the classroom by providing more natural light; however, this claim cannot be assessed within the scope of this thesis project.
Essentially, the skylights are windows located on the roof of the classroom. They are covered with a glazing that helps block the solar radiation, helping to reduce loads from solar gain. This glazing as well as a view of the skylights can be seen in Figure 5.4.1.
Figure 5.4.1: Outdoor View of Skylights
actual case of the experimental classroom, the results should be close enough to gain an idea of their impact. The estimated energy consumption is depicted in Table 5.4.1.
Table 5.4.1: Estimated Impact of the Addition of Skylights Electric Furnace/Air Conditioner, No Skylights Electric Furnace/Air Conditioner, With Skylights
Heat Pump, No Skylights Heat Pump, With Skylights Month Total (kWh) HVAC (kWh) Total (kWh) HVAC (kWh) Total (kWh) HVAC (kWh) Total (kWh) HVAC (kWh) Jan 1,777 1,586 1,717 1,526 1,217 1,025 1,165 974 Feb 1,520 1,347 1,436 1,262 1,079 905 1,030 857 Mar 840 649 762 571 537 345 511 318 Apr 684 487 702 506 473 276 516 319 May 550 353 672 474 467 268 579 380 Jun 662 478 863 680 582 399 745 562 Jul 855 657 1,059 860 742 544 907 709 Aug 833 635 1,028 829 723 525 881 684 Sep 490 307 622 439 439 254 548 365 Oct 554 355 601 402 415 217 464 266 Nov 783 606 761 585 495 318 489 312 Dec 1,573 1,381 1,552 1,361 1,021 829 1,010 818 Tot 11,121 8,841 11,775 9,495 8,190 5,905 8,845 6,564
It must be noted that the addition of the skylights was the most expensive design change to the control classroom. The total cost of the skylights, less the one time engineering cost to include them in the design, is $4,260. The benefits of the skylights with respect to day lighting savings cannot justify this expense.
6.0 CONCLUSIONS
Measured results show that the performance enhanced relocatable classroom saved a total of 3,518 kWh and $339.44 during the 2004 calendar year. This represents a 30.6% reduction in energy consumption compared to the control classroom. The majority of the savings were due to the decreased consumption of the performance enhanced classroom’s HVAC system. Measured savings on this circuit were 3,752 kWh, more than the total savings of the performance enhanced classroom, equating to a 40.4% reduction in total HVAC energy consumption. The savings for the HVAC system are higher than the overall savings because the plug loads in performance enhanced classroom were higher than in the control classroom, reducing the total energy savings. Measured savings on the lighting circuit totaled 227 kWh, after subtracting the month of January, which was prior to the adjustment of the dimming control unit. This equates to an 18.7% reduction in lighting circuit consumption compared to the control classroom.
control classroom totaled 2,845 kWh, 80.9% of the total measured energy savings, during these two months. During the months in which mostly cooling loads occurred, the
performance enhanced classroom consumed more energy than the control classroom. This is primarily because the HVAC system in the control classroom also consumed more energy during this time period. During the remaining months in which mostly heating loads occurred, the performance enhanced classroom consumed less energy than the control classroom, both in terms of total consumption and HVAC system consumption.
It is suspected that the increased energy consumption of the performance enhanced classroom during the months with cooling loads is because the control classroom does not meet the ASHRAE standard ventilation requirement, as evidenced by its higher indoor CO2
concentrations. The higher ventilation rate in the performance enhanced classroom causes its energy usage to increase in order to condition the increased ventilation air. The Energy-10 software model was used to normalize this difference. The model indicates that if the ventilation air in the control classroom were increased from 200 to 300 cfm, the yearly energy consumption of the classroom would increase approximately 10.9%.
actuality, the manual thermostat is setback slightly during unoccupied periods by the control classroom’s teacher. However, the electrical bill from January 2005 shows that the
classroom is saving $3.47 per day when compared to the electrical bill from January 2004, a savings of approximately $107.57 for that month alone. The only difference in the classroom between these two periods is the installation of a programmable thermostat.
Likewise, the Energy-10 model was used to estimate the savings from the Bard CS2000 unit in the performance enhanced classroom. The model predicted that that the CS2000 unit reduced the classroom’s electrical energy consumption 19.3% from the total consumption of the classroom if no setbacks were used. The savings from the CS2000 unit is most likely overestimated again in this case because of the same reasons as the programmable
thermostat. Additionally, the CS2000 unit activates the HVAC system in the late afternoon, most likely because is senses the presence of the janitor, while the programmable thermostat in the control classroom does not. The CS2000 unit is also prone to learning that periods of the week are occupied, even when they are not. This situation occurred with the unit around September of 2004. The unit’s mistake would not have been caught had the classroom not been data-logged and monitored periodically. These occurrences increased the consumption of the performance enhanced classroom. For its cost and reliability, the programmable thermostat is a better choice than the CS2000 unit.
Measurements were made to determine the effectiveness of the energy recovery wheel in the HVAC system of the performance enhanced classroom. CO2 concentration measured at
inside space of the classroom; rather, it is recirculated and exhausted from the unit. This makes the energy recovery wheel mostly ineffective. Additionally, the Energy-10 software model could not estimate its effectiveness. The most obvious explanation of this is that there are no dampers in the HVAC’s ventilation system to mechanically separate the air streams. The unit depends on pressure differentials created by fans to separate the air streams. Because there are several closed duct vents inside the classroom, the pressure differentials are not as designed and, therefore, outside ventilation air is not moved into the classroom but is exhausted back out of the unit.
The Energy-10 model was employed to estimate the savings from installing the heat pump system from the performance enhanced classroom in the control classroom. The model estimates that replacing the 10 kW electric furnace/air conditioner system in the control classroom with the same heat pump from the performance enhanced classroom yields a yearly energy savings of 2,931 kWh, or 26.4% of its current consumption. This equates to a yearly cost savings of approximately $200 per year.
equipped with the same heat pump as the performance enhanced classroom. This difference is due to the greater efficiency of the heat pump during the heating season than the electric furnace.
The energy consumption of the classrooms was modeled with three different lighting scenarios. The first was the sixteen two bulb, single ballast, T12 fixtures contained in the control classroom, the second was with the ten three bulb, dual ballast, T8 fixtures contained in the performance enhanced classroom, and the third was with ten three bulb, single ballast, T8 fixtures that consume less energy than their dual ballast counterparts. No day lighting was employed in the model. The dual ballast fixtures were found to consume more energy than the T12 fixtures when no dimming was utilized. The model estimated that the total consumption of the control classroom would increase 252 kWh per year if the dual ballast fixtures were installed. However, if the single ballast T8 fixtures were installed, the control classroom would consume 303 kWh less per year than with the T12 fixtures. This represents a cost savings of approximately $29 per year.
These same scenarios were modeled in the control classroom equipped with the same heat pump as the performance enhanced classroom to investigate the difference the HVAC system might have in this case. When the two ballast fixtures were compared to the T12 fixtures, the results were an increase in energy consumption of 294 kWh per year. When the single ballast T8 fixtures were compared to the T12 fixtures, the results were a decrease in the classroom’s total energy consumption of 646 kWh. This results in a savings of
selecting the proper fixture and that a change to T8 fixtures does not necessarily result in energy or cost savings.
Finally, the Energy-10 model was used to estimate the impact of the skylights on the energy consumption of the classrooms. The model predicted that the energy consumption of the control classroom would increase 654 kWh per year if skylights were installed. The skylights actually saved energy during some of the winter months, but the increase in consumption during the cooling months overshadowed these savings. The model predicted that the control classroom would consume 655 kWh more per year if the classroom utilized the heat pump system of the performance enhanced relocatable classroom. From the models predictions of the impact of skylights coupled with the measured savings from the lighting circuit, it can be deduced that the day lighting scheme most likely causes the total
consumption of the performance enhanced relocatable classroom to increase.
Collection of data from both the control and the performance enhanced relocatable classroom continues. FSEC has and will continue to prepare reports outlining the
![Table 2.2.1: Building Construction Comparison [3]](https://thumb-us.123doks.com/thumbv2/123dok_us/1607941.1199077/15.612.88.540.108.675/table-building-construction-comparison.webp)

![Table 3.1.2: Ventilation Rate and Resultant CO2 Concentrations (at 350 ppm outdoor concentration) [10]](https://thumb-us.123doks.com/thumbv2/123dok_us/1607941.1199077/26.612.114.523.87.307/table-ventilation-rate-resultant-co-concentrations-outdoor-concentration.webp)