ISSN(Online) : 2319-8753 ISSN (Print) : 2347-6710
I
nternational
J
ournal of
I
nnovative
R
esearch in
S
cience,
E
ngineering and
T
echnology
(An ISO 3297: 2007 Certified Organization)
Vol. 5, Issue 5, May 2016
Simulation of Photovoltaic Systems using
Maximum Power Point Tracking Algorithm
G.Hemaprabha 1, T.Rama Rajeswari 2
Assistant Professor, Department of EEE, Info Institute of Engineering, Coimbatore, TamilNadu, India1
P.G. Student, Department of EEE, Info Institute of Engineering, Coimbatore, TamilNadu, India2
ABSTRACT: This paper presents the Modelling and simulation of Solar Photovoltaic Cell. Solar module temperature, solar radiation and it is effects on series resistance are taken into an account. This model is based on mathematical equations and is also represented through an equivalent circuit including a photocurrent source, a diode, a series resistor and a shunt resistor. This model allows the prediction of PV cell behaviour under different physical and environmental parameter. In this model, the function of solar temperature and solar radiation can also be used to take out the physical parameters for a given solar photovoltaic cell. The I-V and P-V characteristics are obtained and studied at various temperature values.
KEYWORDS: Maximum Power Point Tracking, photovoltaic module, Simulink Model.
1. INTRODUCTION
A photovoltaic (PV) system is directly converts sunlight into electricity. The basic device of a photovoltaic system is the photovoltaic cell. A Photovoltaic energy is a source of interesting energy. It is renewable, inexhaustible and Non polluting are used as energy sources in various applications. The photovoltaic module is a group of PV cells in series and parallel. In this generation system represents the conversion unit. An array is the group of photovoltaic modules in series and parallel. A photovoltaic (PV) generator consists of solar cells, connections, protective parts, supports. Solar cells consist of a p-n junction fabricated by thin wafer or layer of semiconductor. An exponential behaviour of a solar cell includes the I-V output characteristic is related to that of a diode. When solar energy strikes on solar cell, that energy is greater than the band gap energy of the semiconductor. The electron-hole pairs are created when the electrons are knocked out from the atoms in the material. These carriers are swept under the influence of the internal electric fields of the p-n junction..The current passed onto load impedance depends upon its value. This current is shunted internally by the intrinsic p-n junction diode. Solar energy is widely available, free of cost, and sustainable source of energy. The photovoltaic (PV) cell is the devices which convert solar energy into electrical energy.
The Solar radiation, the temperature of the cell and the voltage produced in the photovoltaic module depends by the obtained energy. A PV device may directly feed small loads are available the voltage and current. The PV device is used to require electronic converters to process the electricity. At the load, the electronic converters are used to regulate the voltage and the current and it is mainly used to track the maximum power point of the device.
II. SOLAR CELL MODELLING
Fig-1 circuit diagram of PV model
To get accurate shape to the power-voltage characteristic from the series resistance (Rs). Due to the current flow, the series resistance (Rs) represents the internal voltage drop.
The output current of photocell (IL) can be represented as
0 1
L S
L nkT
V
I R
I
I
I q
e
(1)Where,
I is the current generated by the incident light
I0 is the reverse saturation or leakage current of the diode.
q is the electron charge [1.60217646 *10-19C]. k is the Boltzmann constant [1.3806503*10-23J/K]. T [K] is the temperature of the p-n junction.
The output current is simply different from photocurrent and diode current. Generally, the value of Rsh is very high and therefore, it is neglected. The performance of PV cell depends upon ambient temperature and it is modelled through dependence diode current as a function of temperature. The leakage current (I0) of diode also depends upon temperature. The photocurrent (I) is strong function of temperature. The dependence of I0 and photocurrent (I) on temperature was included in MATLAB implementation. The modelling equations of I and I0 are not included just for the simplicity. The performance of PV cell also depends upon the value of series resistance (Rs).
The output power of PV cell is changed by means of environmental factors, such as illumination and temperature. Since the characteristic curve of a solar cell exhibits nonlinear voltage-current characteristics. The maximum power point tracker is involved to match the solar cell power with the environmental factors. There are more algorithms have been developed for tracking the maximum power point solar cell.
III. MPPT ALGORITHM
ISSN(Online) : 2319-8753 ISSN (Print) : 2347-6710
I
nternational
J
ournal of
I
nnovative
R
esearch in
S
cience,
E
ngineering and
T
echnology
(An ISO 3297: 2007 Certified Organization)
Vol. 5, Issue 5, May 2016
revealing a non-linear characteristic for that reason an MPPT algorithm to track changes and extract the maximum power from the PV solar panel.
Under certain conditions, the MPPT algorithm that included in charge controllers used for extracting maximum available power from PV module. The maximum power point or peak power voltage is defined as the voltage at which PV module can produce maximum power. PV modules have relatively low conversion efficiency; hence, controlling maximum power point tracking for the solar array is essential. A PV depends on the operating voltage of the array by means of that the amount of power generated. By solar insulation and temperature, a maximum power point (MPP) varies.
The PV cell output is limited by both the cell current and the cell voltage. From the I-V curve, it can only produce a power with any combinations of current and voltage. The cell current is proportional to the irradiance. The maximum power is produced by the open circuit voltage and short circuit current.
Fig.2. I-V and P-V characteristics
I= Isc – Io{exp[ q(V + RsI)/(nkTk) ]- 1} – (V+RsI)/Rsh
(2) Where,
Isc = Id + I (3)
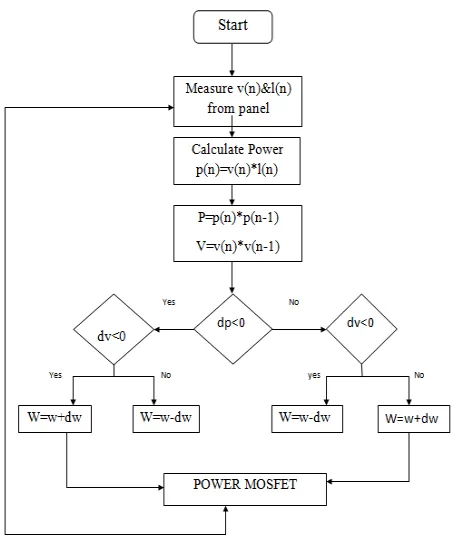
3.1 Flowchart of Mppt Algorithm:
The MPPT design method is based on the regulation of the PV array output voltage or current. From the PV array output characteristics, the reference voltage or current signal which is either derived or constant. A variation on this method is directly use the dc/dc converter duty cycle as a control parameter and force the derivative dP / dD to zero. Where,
Fig .3. Flowchart of MPPT Algorithm
There are three methods in MPPT algorithm. Most commonly used MPPT algorithm is the perturb and observe method. In this method, due to a small amount dW, the duty cycle of the PWM to the MOSFET that separates the panel and battery. Consider a small amount dW has increased, the panel voltage and current are measured and the corresponding change in Power dP is observed. If the change in power is positive, then the direction of perturb is correct and continue to perturb in the same direction. If the change in power is negative, the direction of perturb is reversed and the process continues. The main aim of an algorithm is always to ascend the power curve in order to achieve the maximum power output from the PV cell. Hence, we always make the solar panel to operate at a point that delivers maximum power. If MPPT system is not implement the load connected to the panel is always constant, and it cannot operate at maximum power point. So, it will not trap the maximum power available from the panel.
IV. SIMULATION RESULTS
ISSN(Online) : 2319-8753 ISSN (Print) : 2347-6710
I
nternational
J
ournal of
I
nnovative
R
esearch in
S
cience,
E
ngineering and
T
echnology
(An ISO 3297: 2007 Certified Organization)
Vol. 5, Issue 5, May 2016
Fig 4.Simulation of Solar Panel
Table 1: Waveform Parameter values of P-V Characteristics
COLOUR INDICATION
POWER VOLTAGE
DARK BLUE 140W/m2 43
GREEN 120 W/m2 44
RED 100 W/m2 46
SKY BLUE 80 W/m2 47
Table 1:Waveform Parameter values of I-V Characteristics
Figure 5 shows the P-V characteristics, the power value decreased from 140W/m2 and the voltage value increased from 43Volts.
Fig 5. P-V characteristics
Figure 5 shows the I-V characteristics, the current value decreased from 4.6 Ampereand the voltage value increased from 43Volts.
Fig 6.I-V Characteristics
COLOUR INDICATION
CURRENT VOLTAGE
DARK BLUE 4.6 43
GREEN 3.9 44
RED 3.3 46
SKY BLUE 2.6 47
ISSN(Online) : 2319-8753 ISSN (Print) : 2347-6710
I
nternational
J
ournal of
I
nnovative
R
esearch in
S
cience,
E
ngineering and
T
echnology
(An ISO 3297: 2007 Certified Organization)
Vol. 5, Issue 5, May 2016
V. CONCLUSION
In this paper, we presented simulation of PV cell and its array using MATLAB based setup. The simulation setup can be used to study the effect of variation in temperature value. The value of short circuit current was found to increase with increase in temperature whereas the open circuit voltage was observed to decrease with increase in temperature. The maximum power as well as the voltage at which peak power was observed to increase with increase in temperature.The simulated model was demonstrated as an excellent and flexible environment for studying various PV solar cells operating under different of irradiance and temperature.
REFERENCES
[1] J.A. Gow, C. D. Manning “Develoment of a photovoltaic array model for use in power-electronics simulation studies”,IEEE Proceedings on Electric Power Applications, vol. 146, nº 2,pp. 193-200, March 1999.
[2] G. Walker, “Evaluating MPPT converter topologies using a Matlab PV model”, Journal of Electrical & Electronics Engineering, Australia, Vol.21, No. 1. (2001), pp. 49-56.
[3] M.G. Villalva, J.R. Gazoli, E. Ruppert “Modeling and circuitbased simulation of photovoltaic arrays”. Brazilian Journal of Power Electronics, (2009) vol. 14, nº 1 pp 35-45.
[4] A. Mellit, “Modelling and simulation of a stand-alone photovoltaic system using an adaptive artificial neural network:Proposition for a new sizing procedure”Renewable Energy 32 (2007) pp 285-313.
[5] M. G. Villalva, J.R. Gazoli, E. Ruppert “Comprehensive approach to modeling and simulation of photovoltaic arrays”.IEEE Transactions on power electronics, vol. 24, no5, pp. 1198-1208, May 2009
[6] Huan-Liang Tsai, “Development of Generalized Photovoltaic Model Using MATLAB/SIMULINK”. Proceedings of the World Congress on Engineering and Computer Science 2008. WCECS 2008, October 22 - 24, 2008, San Francisco, USA
[7] Ramos Hernanz, JA., Campayo Martin,JJ. Zamora Belver,I., Larranga Lesaka,J. , Zulueta Guerrero,E. p “Modelling of photovoltaic module”, International Conference on Renewable Energies and Power Quality (ICREPQ’10) Granada (Spain), 23th to 25th March, 2010.
[8] Francisco M. González-Longatt, “Model of photovoltaic Module in Matlab™”, (II CIBELEC 2005) .
[9] Huan-Liang Tsai, Ci-Siang Tu, and Yi-Jie Su, Member, IAENG, “Development of generalized photovoltaic model using MATLAB /SIMULINK”, Proceedings of the World Congress on Engineering and Computer Science 2008,WCECS 2008, October 22 - 24, 2008, San Francisco, USA .
[10] M.G. Villalva, J.R. Gazoli and E.R. Filho, “Comprehensive approach to modeling and simulation of photovoltaic array”, IEEE Trans on Power Electronics, Vol. 24, n°5, pp. 1198-1208,May 2009 .
[11] Savita Nema, R.K.Nema, Gayatri Agnihotri , “Matlab / simulink based study of photovoltaic cells / modules / array and their experimental verification”, INTERNATIONAL JOURNAL OF ENERGY AND ENVIRONMENT, Volume 1, Issue 3, 2010 pp.487-500 .