A Statistical Method of Knowledge Extraction
on Online Stock Forum Using Subspace
Clustering with Outlier Detection
N.Pooranam 1, G.Shyamala 2
P.G. Student, Department of Computer Science & Engineering, Sri Shakthi Institute of Engineering and Technology,
Coimbatore, India1
Assistant Professor(Senior), Department of Computer Science & Engineering, Sri Shakthi Institute of Engineering and
Technology, Coimbatore, India2
ABSTRACT: Financial stock Data Analysis and future prediction in terms of Sentiments is great challenge in the big data research. Among the unlabeled opinion, opinion classification in terms of unsupervised learning algorithm will lead to classification error as data is sparse and high dimensional. To overcome this problem, the sentiment analysis to extract the opinion of each word in the stock data has been proposed. Moreover the data size is large, hence the singular value decomposition to resolve the inconsistent constraints correlating to the large dimensions, and dimensionally reduced feature set is been used. The dimensionally reduced feature set is classified into clusters through employment of Principle component analysis which is used to calculate the strength of actionable clusters with utilization of the domain knowledge and validate the optimal centroids dynamically. Cluster data which further inconsistent with the outlier probability can further reduced through subspace clustering. Experimental results prove that the proposed framework outperforms the state of art approaches in terms of precision, recall and F measure.
KEYWORDS: Opinion mining, sentiment analysis, Singular Value Decomposition, Principle Component Analysis, Subspace Clustering.
I. INTRODUCTION
Data Analytics (DA) is used to examine a raw data to get a conclusion about particular information and it is used in many organizations, industry and also in company to make a decision for the betterment of the business. The data taken for making decisions is very high dimension then here the Big Data Analytics came in to picture where the high dimensional data are difficult to manage and analyze.[1] Big Data Management (BDM) is based on two main components, Big data and Data Management which is used to achieve their business goals. Traditional data and new data are different in their content, structure and uses to accommodate the solution they uses different tools and software for managing the large amount of data. The benefits of BDM are the gain of dataset analysis; sales and stock market value are improved [2]. The major challenges associated with big data are as follows:
Capturing data
Curation
Storage
Searching
Sharing
Transfer
Analysis
To manage these data the environment use a distributed file system called Hadoop Distributed File System (HDFS) it’s a main tool to manage the data which contain a very high data. The Hadoop is a map reduce frame work which has two user define functions called mapper function and reduce function each has its own tasks. The Hadoop work as Master Slave architecture in which it has Name node (master) contains job tracker which assigns each data node a job and Data node (slave) contain task tracker which task running on which node this information is gathered by task tracker.
The main challenge of big data is forming clusters it can also be termed as heart of big data. The data is of large amount so the clusters are formed for the easy analysis on the dataset. There are several algorithms for creating clusters. In this work the dataset is based on the comments of stock market, Now a day’s shareholders are interested in posting comments on stock market/products which have some information about both the traditional and new trade details in which its mainly focus on the comments of the investors to make a decision fore there. There are several algorithms for the formation of cluster, it’s of grouping similar (based on similarity) objects and individuals. In market analysis clusters are used for segmentation on target, new product development. There is some procedure for cluster formation,
Variables to be analysed are selected.
Calculate the distance measure.
Select the clustering method.
Decide the number of cluster.
Map the cluster with interface.
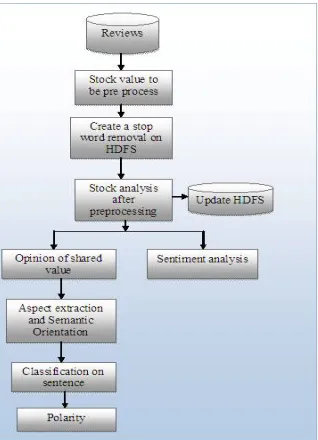
In this paper the sentiment analysis plays a major role on stock comments each comments have different views, based on the aspects the analysis process is conceded. The challenges faced by sentimental analysis is based on keyword will not be direct; domain knowledge should belong to individuals, specific domain phrases. The steps of sentiment analysis is mention in fig1 the review of the stock comments is taken in that there are training data and test data in which here training data is used for further process the data is analysed based on several factors then the classification is made on those factors finally the results are concluded. To create a sentiment analysis there should be sentiment base where the process of extraction on different aspects is drawn. The following content covers, Related work, System design, Experiments, Evaluation and Conclusion.
Fig 1: Step for Sentiment Analysis
II. RELATED WORK
Bottom-up approaches find dense regions in low dimensional spaces and combine them to form clusters. The main purpose of subspace clustering algorithms is to find meaningful groups of objects in multiple sub-dimensions that may be overlapped, because clusters may be embedded in lower dimensional subspaces. The single valued decomposition is used to calculate Eigen value of the data and PCA [3] is the major technique which is used in the course of mapping the unique information space to dimensional data.
Difficulties in Sentiment analysis
In Analysis the previous presents is based on Keyword spotting in which the mining each data is found to be key word of the sentences which is a long process for classification and for finding polarity of the sentences. The
Lexical affinity is finding the relationship between the document and the context of the sentence which will not consider the text of the particular sentence.
Planned Investigation
The subspace clustering and PCA is used to avoid the difficulties of the sentiment analysis which will lead to increase the system performance and efficiency in retrieving the data from the trained data set. The advantages of PCA are identifying patterns in data, and expressing the data in such a way as to highlight their similarities and differences. It is a powerful tool for analysing data by finding these patterns in the data.
III.SYSTEMDESIGN
Sentence Polarity on Data
In fig 2 initial processes is collecting the pre-processed stock data value from the shared opinion then the processed data is parsed to classify into different labels. A stop word removal (the customer reviews are taken as input for the system then pre-process the data based on stop word removal and stemming) dictionary is created to find the common words and classify it into subjects and objects. The pre-processed document will estimate the opinions from the shared value stock data and incorporate its sentiments a semantic opinions are obtained by the Latent Semantic Analysis (LSA) and the features are extracted from the rule based approach. The sentences or classified under different polarity by calculating the score value. The score value is found using article score [5] which can calculate both positive score value and negative sore value based on extraction of sentiments.
Sentiment Orientation of Aspects
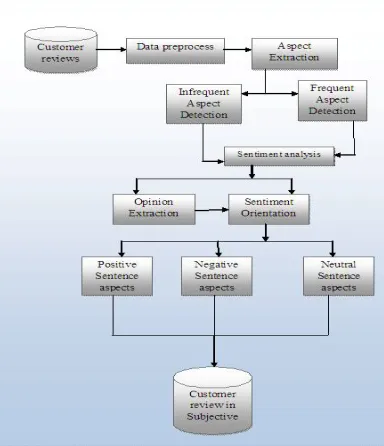
In fig 3 the review of customers are parsed into Data Preprocessing where unwanted data are removed using stop word removal. The feature/aspects are extracted using likelihood (must link and cannot link constrain) and the score value of the training data. There are two main mechanism aspect extraction and sentiment orientation in this aspects[7] are extracted from two main component infrequent and frequent aspects that is based on maximum likelihood. Another mechanism is on sentiment orientation where the data are extracted from sentiment base and classification sentiment is obtained and subjective data alone retrieved.
Fig 3: Sentiment Orientations of Aspect
IV.EXPERIMENT
Data Pre-processing
In this the share review information into different categories like news, expert commentaries, announcements, etc ensuring that the conclusions are definitely based on public opinion or, at least, represent part of the public opinion. The sentiment polarity of the category is not easily distinguished, but its content is true and meaningful. Data from the specific websites can be collected by the open application programming interface or correspondent crawler, such as the first and third categories of information. However, collecting a data set on a specific topic is more difficult. We then design a customized data wrapper for one platform to extract the metadata, including the user ID, timestamp, post message, and the properties of the cited user. This method allows the collection of highly accurate data on a specific topic.
Extracting subjects and objects
extracting the opinion-oriented information through the pure text. The extraction of properties is based on the sentiment, modifier, and rule bases.
Calculating the polarity of the sentences
The most important thematic sentences are usually placed in the most prominent position, such as the title, the first sentence, and the last sentence, for emphasis. Therefore, in calculating the overall polarity of a document, the location of the sentiment sentence should be considered. The weight of thematic sentences should be greater than those of other sentences in a document.
Establishing a similarity measurement
The similarity functions that estimate approximation between observations is important task in various machine learning methods. The computation of similarity is peculiarly crucial for clustering and record linkage algorithms. These processes rely upon precise estimates of the distance between data points. The Euclidean distance is the most common use of distance which is the standard measure of distance. They examine the root of square differences between coordinates of a pair of objects.
Implementation of outlier data through subspace clustering for data classification
The data get clustered with a centroid based on the probability value calculated from the homogenous tensor with the utilities of the object. After calculating the probabilities of the values, Maximum likelihood estimates.
Frequent Item Set Mining
In data mining various methods are present to mine certain data; the frequent method used is the apriori method. In the apriori algorithm the adaptations are required to make in the manipulation of temporal sequences when a transactional database represented as a set of sequences of transactions performed by one entity is used. The most important qualifying is on the belief of support. The support is now obtained from the fraction of entities, which had consumed the item sets in any of their possible transaction. An entity could only contribute one time to increment the support of each item set, beside it could had consumed that item set several times. After identifying the large item sets, the item sets with support greater than the minimum support allowed, they are translated to an integer, and each sequence is transformed in a new sequence, whose elements are the large item sets of the previous-one.
The data weight prediction depend on various factor
The data need to be grouped in a better way which is required for better understanding, analysing and examination. This can be solved by using the clustering technique which groups the similar kind data into a particular cluster. Lagrange multipliers are a strategy for finding the local maxima and minima of a function subject to equality constraints.
Implementation of PCA
The large data set get dimensionality reduction by implementing the principle component analysis. If the dataset used is large, then the performance will be reduced and also the time complexity is increased. To overcome this problem, this method focuses on altering the initial cluster Centroid [6] effectively, for this purpose; Principal Component Analysis (PCA) is used here. Principal component analysis (PCA) is a widely used statistical technique for unsupervised dimension reduction.
V. EVALUATION
Dataset Description
The online Stock data is extracted from the Social network from different buyers and investor; it is further organized as corpus of records. The online stock data extracted contains the multi dimensionality of data composed on stock prize, company, opinion of the stocks etc. These data has been transformed with removal of stop words and stemming process into the useful dataset.
Data analysis using sentiments
Fig 4: Stock values of different companies
Performance evaluations of the classification results The System is evaluated against the following properties
Precision (also called positive predictive value.
Recall (also known as sensitivity).
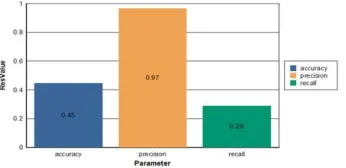
Fig 5 Compared classification performance of sentiment analysis on the stock data against the precision, recall and accuracy. The classification accuracy is the degree of closeness of computed results to actual (true) value.
Fig 5: Performance evaluation
The proposed system shows better result in terms of efficiency and data classification mechanism in handling the spare data. Here the Euclidian distance present as a measure to classify and group the data.
Performance Analysis
In experiment, an analysis is done on the behaviour of the clusters of K-Means and PCA algorithms. Experiments on dataset PCA provides an effective Clustering solution for the K-means clustering.
VI.CONCLUSION
In this work the sentiment analysis on online stock comments which provides an easy trade on company to buy the stocks. The work has been carried out by stop word removal, semantic analysis, subspace clustering, classification and polarity of sentences. Taking out actionable 3 D subspace clusters from permanent valued 3D (object-attribute-time) data is valuable in field sorting from finance to science. This work develop a subspace clustering which is a non trivial approach to avoid problems and provides an effectiveness of the algorithm in our experiment the 3D actionable cluster technique which is provides better percent in system performance. The multifacts are handled by the subspace clustering technique concurrently.
REFERENCES
[1] http://searchdatamanagement.techtarget.com/definition/data-analytics [2] tdwi-managing-big-data-106702.pdf
[3] G. Liu, K. Sim, J. Li, and L. Wong, “Efficient Mining of Distance-Based Subspace Clusters,” Statistical Analysis Data Mining, vol. 2, nos. 5/6, pp. 427-444, 2009.
[5] Ronen Feldman, Benjamin Rosenfeld, Roy Bar-Haim and Moshe Fresko “The Stock Sonar — Sentiment Analysis of Stocks Based on a Hybrid Approach“The Hebrew University of Jerusalem, Jerusalem, ISRAEL Digital Trowel, Airport City, ISRAEL. [6] Katal, A . ; Dept. of CSE, Graphic Era Univ., Dehradun, India ; Wazid, M. ; Goudar, R.H.”Big data: Issues, challenges, tools and
Good practices”2013.