T H E OPTIMUM STRUCTURE OF BREEDING FLOCKS.
11. METHODS OF DETERMINATION
EVERETT R. DEMPSTER AND I. MICHAEL LERNER University of California, Berkeley, California
Received August 30, 1947
H E preceding paper by DEMPSTER and LERNER has presented the results
T
obtained in the determination of expected genetic gains in egg production under different age compositions of a breeding flock. I n it the theoretical and practical consequences of following a given breeding plan were emphasized but the statistical model on which the computations were based was not pre- sented. The purpose of this report is t o describe such a model and to demon- strate the methods used in computing the expected gains. They are essentially( 8 8 5 . 5 ) . (56;s) (374.0) (7106.8)
pp A . 6 5 8 LPf
(942.0) (7480 e 8 )
FIGURE I.-Characteristics of flock underlying all calculations of gains. For explanation of symbols see table I. T h e figures in parentheses represent variances. Single-headed arrows repre-
sent paths and double-headed arrows correlations. (WRIGHT 1921.)
an extension of the work of DICKERSON and HAZEL (1944), and are based on path relationships first established by W R I G H ~ (1921).
568 EVERETT R. DEMPSTER AND I. MICHAEL LERNER TABLE I
___ _____ __
~ _ _~- ~
~~
SYMBOL EXPLANATION OF SYMBOLS
I 2 3 4 5 6 7 8 9 IO I 1 I 2 I 3 I 4 15 16 17 I8 19 2 0 2 1 a b h D E e f G AG GC GD GS i I n P P r S w U Path coefficients.
The value of the abscissa a t the point of truncation of a normal curve.
Path coefficient from genotype to phenotype. Heritability (h2) is the fraction of the total variance attributable to additive genetic differences.
The subscript indicating that the symbol refers to a dam or a prosepctive dam. The combination of environmental and non-additive genetic effects.
Path coefficient from environment to phenotype, including non-additive genetic and environmental interactions.
The subscript indicating the full record (average production from beginning of lay to September 30 of the following year per bird housed).
The genotype (average additive effects of genes). The subscripts I , 2, 3 refer to
the genetic components of the corresponding selection indices.
Change in average value of genotypes due to selection. The subscript g refers to the gain per generation; the subscript y to the gain per year.
The portion of the genetic contribution from parents that is independent for each member of the progeny of given parents. The mean value of GC is zero and the mean contribution of GC to variance both within families and between individuals of different families is dne-half the total genetic variance in random bred populations in equilibrium. Generally used as a subscript to U .
The portion of the genetic contribution from a dam that can be considered con- stant for all her offspring. The value of GD is one-half the value G of the dam and the contribution of GD to genetic variance within families is zero. The contribution of GD to genetic variance between individuals of different families is one-quarter the variance of G of the dams (= ucO2/4)
The same as GD but contributed from sires instead of dams.
Average superiority of the selected group over the original population in terms of standard deviations.
The selection index combining the record of the individual and of relatives. 11 is equal to the sum of the products (.27 times the part record of a bird) and
(.73 times the average part record of her sisters); 1 2 is the second index simi-
larly based on the full instead of part records; It, the third index, is the average part record and I4 the average full record of the progeny.
The original number of females housed per full-sister family.
The subscript indicating the part record (average production from beginning of lay to September 30 of the following year per bird housed).
The phenotypic value expressed in eggs laid in the period indicated by the sub- script.
Product-moment or intra-class correlation coefficient.
The subscript indicating that the symbol refers to a sire or a prospective sire. The weighting factor entering an index. The subscript A refers to the mean records
of the sisters of a dam or prospective dam; the subscript D refers to the record of the dam or prospective dam herself.
Standard deviation of the variable indicated by subscript.
approximation (WRIGHT 1935; LUSH 1945), and agreement between com- puted and observed rates of gain in a t least one poultry flock offers adequate confirmation of this viewpoint (LERNER and HAZEL 1947).
THE BASIS O F SELECTION
METHODS OF DETERMINING IMPROVEMENT 569 birds on the basis of their full-record phenotype is i h, where i is the average superiority of the selected group over the whole population in terms of stand- ard deviations. The values of i can be obtained either from PEARSON’S Tables
(1931) or computed for small populations from the ranked ordinate values tabulated by FISHER and YATES (1938). The values of i given in these tables are for sharply truncated populations where selection is practiced for only one character. If, as is usually the case, allowance is to be made for selection for other characters, the value of i must be reduced t o some extent. AS already noted in the preceding paper the factor 0.75 was used in our computations for this purpose.
When selection is made on the basis of the part rather than of the f d l record the value i h must be further mulitplied by the genetic correlation be- tween full and part record (rGrGp) to obtain the estimate of genetic gain in the full record. To convert the computed gains into terms of eggs the appropriate values of standard deviations of genotypes (haf) must be further introduced into the formula for AG,.
More accurate selection. and hence greater gains, can be made by using a selection index rather than the bird’s own record. I n the case of the sires the use of such a n index is mandatory, since no phenotypic expression for males is available for egg production. The index may be based on the records of the relatives of a bird (sisters or daughters) and the respective weights assigned to the bird’s own record and to that of its relatives so as t o maximize the correla- tion between the index used and the bird’s genotype (r IC,>. The expected gains under this method of selection can be computed in a fashion analogous to the one used in selection on the basis of individual records, except that instead of the correlation between phenotype and genotype, the correlation used here is that between the index and the genotype.
GENETIC VARIANCE
I n poultry, contrary to the case of multiparous mammals, the environmental contributions to the total variance may be considered with but little error t o be independent for each individual. The genetic variance in a random-bred flock a t equilibrium consists of three fractions: (I) one quarter due to those contributions of the sires that are constant for all the offspring of a given sire,
(2) another quarter due to those contributions of the dam that are constant
for all the offspring of a given dam (3) one-half due to chance a t segregation. I f , however, the sires and dams are selected samples, rather than random repre- sentatives of their generation, the relative values of these three components are altered.
5 7 0 EVERETT R. DEMPSTER AND I. MICHAEL LERNER
on rather extensive iterative calculations. Sample calculations have indicated an overall reduction in parental genotypic variance of approximately four percent and inasmuch as the exact value is not a t all critical this figure has been used for all the mating schemes. Wherever a group of individuals of given age are progeny tested, however, the exact reduction in genotypic vari- ance to be expected for the group under consideration has been computed and used.
The third component of variance, due to chance a t segregation, is a function of the heterozygosity of the parents. This component in the offspring of se- lected parents is not, in the absence of additional postulates. subject t o calcu- lation. The actual change in this component may be reduced, remain constant, or be increased in a population mating a t random (except that selection is being practiced), depending upon the exact gene frequency distribution a t any given time. I n the present calculations, we have postulated that the chance component would be increased sufficiently to compensate for the decrease in the constant components from the selected sires and dams. There are several reasons for adopting this postulate. Firstly, experience has shown that the heritability of economic characters decreases rather slowly under selection, and that a t least a part oi such decrease can be accounted for by inbreeding. Secondly, where genetic variability is due to a large number of gene differ- ences. the total genetic variation is changed very little by selection (LUSH 1945). Finally, this postulate permits the assumption of a constant gain per generation which greatly facilitates the necessary computations. I n the calcu- lations, therefore, the constant contributions for sires and dams are each taken as 24 percent of the total genetic variance and the chance component is taken as 5 2 percent, instead of the 25, 25 and 50 percent which would have
been correct if no selection of the parents had been practiced. The actual variances used in the computations were as follows:
-~ _____
VARIANCE DUE TO VARIANCE D U E TOTAL CHARACTER COXSTANT CONTRIBUTIONS TO CHANCE AT GENETIC
FROM SIRE FROM DAM SEGREGATION VARIANCE
Part record 5 4 . 4 4 54.2/4 j 8 . 8 / 2 56.5
Full record 359/4 35914 359/4 3 74
SELECTION ON THE BASIS O F I1
We may first consider the problem of selection of dams from the unselected flock on the basis of index 11 which is a weighted average of the prospective dam’s own record to January I of her first year of life and the mean record of
her full sisters to the same date. I n order to obtain the optimum weighting and the multiple correlation between the index and the prospective dam’s genotype for part record by ordinary multiple correlation methods, the follow- ing information is necessary:
METHODS OF DETERMINING IMPROVEMENT 571 ( 2 ) The correlation between records of sisters: this is equal to heritability multiplied by genetic correlation. Since the genotypes of sisters are correlated only through the constant contributions of their parents, the genetic correlation is equal to the proportion that this constant contribution to variance is of the total contribution tovariance, or (taking the values from the table given above)
-- 54.2/2 - .480.
56.5
Multiplying this by the heritability (.06) we obtain .0288, the correlation between part records of sisters.
(3) The correlation between the prospective dam’s genotype and the record of a sister, which is equal to the correlation between sisters’ genotypes multi- plied by the correlation between a bird’s genotype and her record or (.480)
(4) The number of sisters including the dam, which is taken here as 7.06, The multiple correlation turns out to be .353 and the relative weighting of dams’ records and the average of the records of the dams’ sisters are .28 and . 7 2 respectively. The optimum weighting can also be obtained by substituting the appropriate values in the formula of LUSH (1945, p. 321)~ where n=7.06, r (genetic correlation between sisters) = .480 and t (phenotypic correlation be- tween sisters) = .0288. An algebraic adjustment is necessary in order to obtain the weighting of the family of sisters excluding the dam. The result is identical with that obtained by the method described above.
If the weighting factors entering into index 11 (wA for mean value of sisters and W D for prospective dam) are not optimum, the correlation between index
and dam’s genotype for part record may be easily computed on the basis of
the following path coefficient diagram:
dz6
=.
I I 74.the mean value for the flock.
572 EVERETT R. DEMPSTER AND I. MICHAEL LERNER
11 is equal t o the following:
and the standard deviation of index 11, is therefore equal to:
58.8 54.2 58.8
=
l / s (
885+
-)
+
-
+
W D ' ( 1+
,,5)6.06 2 2
The path coefficient a1 is then equal to:
while a4 is equal to
--).
ffI1
Following this method the multiple correlations obtained for different weight- ings were :
MULTIPLE
WA W D
CORRELATION BETWEEN
11 AND GD,
NOTES
~ ~~ ~ ~
. 7 7 . 2 3 .35I Over-weighting of family average
. 7 2 . 2 8 - 3 5 3 Optimum weighting
.67 * 33 a 3 5 1 Over-weighting of individual record
METHODS OF DETERMINING IMPROVEMENT 573 tion. For these reasons the calculated gains have been based on a constant weighting for indices Il and 12. The values chosen as most suitable for all the cases considered are: WA= .73, WD= .27. Under these conditions the correla- tion rI1 GD, is .353. This figure, multiplied by the genetic correlation between part and full record, gives the value . 2 6 5 for the corrtlation between 11 and the genotype for full record. I n turn .265 is multiplied by i (the average superiority of the index 11 of the selected animals obtained as described previously) to yield the average gain in genotype for the full record.
SELECTION ON THE BASIS OF 12
The previous section dealt with selection from an unrestricted population on the basis of an index for part records. This is the first selection under plans I and I1 described in the companion paper. The first selection under plan I11 is based on a similar procedure, the correlation between IZ and the dam’s
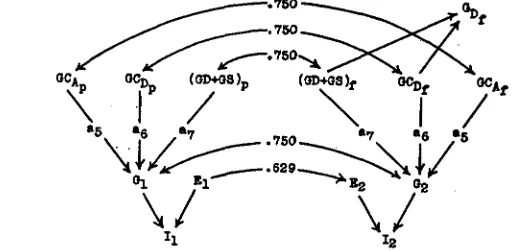
FIGURE 2.-Relationships between I,, 4 and G D ~ For explanation of symbols see text.
574 EVERETT R. DEMPSTER AND I. MICHAEL LEKNER
I n the text figure in the previous section, I1 was shown as the sum of four independent components, three of which were genetic and one environmental. Figure 2 shows the same breakdown for both I1 and 1 2 , but with the sum of the
three genetic components shown separately as GI and Gz for the two indices. It should be noted that the paths indicated as as, a6, and a7, are the same for both indices because the weightings of the dam and the sisters are the same for both indices and also because the relative values of the three genetic com- ponents are postulated to be the same. The correlation between each of the three genetic components for the part index and the corresponding component for the full index among unselected birds is the genetic correlation of .750 since their respective variances are, in a sense, random samples of the total genetic variance. The correlation rG, G ~ , then also becomes .750 since a 2 ~ + a Z ~ + a 2 7 = I.
It is important to note that the correlation between G1 and any of the com- ponents of Gz is the same irrespective of the paths through which it is traced. Thus rG,GCn, is the same whether the route GI-GCD,-GCD, or the route
GI - Gz- GCD, is taken. Hence it is legitimate t o consider that selection on the basis of I1 affects the components of Gz and the dam's genotype for the full record solely through its effect on Gz.
The first step in computing the correlation between IZ and GD, among the previously selected animals is t o compute the variances of Ez, Gz, and 1 2 in this group. The reduction in these variances is related to the reduction in the variance of Il. The variance of 11 of the restricted group is, in turn, related t o that of the original group as the variance of the selected tail of the normal dis- tribution is t o that of the whole distribution.The proportional reduction in vari- ance is i (i-b), where b is the abscissa at the point of truncation (DICKERSON and HAZEL 1944). If it is postulated thst the portion of the variance of a de- pendent variable not accounted for by its regression on the independent vari- able is independent of the latter, the proportional decrease in the variances of the dependent variables Ez, Gz, and
Iz
can be readily obtained, since it equals the proportional decrease in the independent variable multiplied by the square of the correlation between the dependent and independent variables, a rela- tionship also used by DICKERSON and HAZEL (1944).With the variances of Ez, G2, and Iz of the selected animals thus determined, the new path coefficients and correlations can be computed. Since
IZ
is the sum of Ez and Gz, the path coefficients to IZ from each of the others are the respective square roots of the ratios of their variances. The variance of IZ can be set equal to the sum of U E ~ ' and UG: plus twice the product uEZ(TGZrE2G2. From this relationship the new iEzGz may be computed. as illustrated in figure3 for a specific selection intensity (plan 1-5 of the preceding paper). The corre- lation between 1 2 and Gz is equal to the sum of the direct path plus the product
of the path from Ez t o Iz and rE2G2. I n the case illustrated the correlation has been reduced from .40 to .303 as a consequence of the first selection.
METHODS OF DETERMINING IMPROVEMENT 575
Gz) does not alter the concrete regression coefficient of a dependent variable on it. The regression of the prospective dam’s genotype on G2 is then the same in the selected group as among all the animals. The correlation is, however, reduced, and this reduction may be computed in terms of the constant re- gression and the new variances, if desired. The results of such a computation are also shown in figure 3 .
I n plan I1 selection is also made among two-year old birds that were rejected in the first selection made on one-year old birds. The procedure here is exactly
(91.74) (142.4) (1142.8) \ 711.2) ( 3 ’ 0 ’
-92 .40
\ I
I1
I/
( 1354.0 )
(174 12)
(91.74) (142.4) (1142.8) \ 711.2) ( 3 ’ 0 ’
-92 .40
\ I
I1
I/
( 1354.0 )
(174 12)
’“Df
1
?/82- Ez+- a 16- 52
FIGURE 3.-The effect of selection for It on 1 2 . The upper path diagram represents the rela-
tionships before selection; the lower diagram shows the reduced variances and altered correla- tions after the original population has been subjected to the first selection under plan 1-5. Note the negative correlation between EP and Gz (-.16) as against independence in the original population, and the reduction in RI,GD~ from .3z7 to .z47.
parallel to that described above, due account being taken of the negative gain made in the first selection.
SELECTION ON THE BASIS O F I 4 UNDER PLANS I AND I1
The next selection in plans I and I1 is that based on index 1 4 , so that it
may be considered before index 13. The correlation needed t o compute the
gains from the selection on the basis of progeny records is that between the dam’s genotype and the average of her daughters’ full records. Since each daughter is provided with a new environment independent of the previous selection processes, the computation of this correlation presents no difficulties. The variance of 14, which is the average of the 7.06 daughters in a family, is equal to
U G D ~ -k nx? -/- ~ ~ c ~ / 7 . 0 6
d-
~ 2 / 7 . 0 6 .The first term in this expression is a quarter of the genetic variance remaining in the dams after the first two selections and is computed for each selection plan. The second term, UG$, is 54.z/4 since each dam has an equal chance of
576
The correlation coefficient between the dam’s genotype and I4 is the square root of the fraction that a ~ ~ ~ / 4 forms of the total variance of 14. Applying the correlation thus obtained to the constants appropriate to the given selection intensities,AG, may be obtained for this index in the same fashion as the pre- vious AG,‘s.
SELECTION ON THE BASIS OF 13
The computations for plan I11 are similar in theory to those already de- scribed. The first selection is made a t two years of age on the basis of the full records of the bird and of her sisters. For the second selection the proportional reduction in the variance of the dams’ genotypes for the part record is required. That for the full record may be computed in the manner already described and is converted into the reduction in variance for the part record by multi- plying it by (.750)~, .750 being the genetic correlation between the part and the full record. Assuming a constant regression coefficient the new genetic correlation is found t o fall between .730 and .733 for the various subplans of plan 111. Knowing this value, it is possible to compute the correlation between 13 (average part records of the daughters) and the dam’s genotype for the full record along the path leading through the genetic components of 13 and the dam’s genotype for the part record t o the dam’s genotype for the full record:
EVERETT R. DEMPSTER AND I. MICHAEL LERNER
SELECTION ON THE BASIS OF I4 UNDER PLAN I11
Third selection under plan I11 is based on the average full record of the daughters (14). The determination of gains requires a knowledge of the new correlations existing between I4 and its genotypic components and between them and the genotype of the dam for the full record. The computation of these correlations is rather involved if account is ta.ken of the differences in the corre- lations between values of the genetic components for the full and the part. records. The genetic correlation for the component due t o chance a t segrega- tion is .750. for the component due t o constant contributions of the dam to all her offspring lies between .730 and .733 for the various subplans of 111. and the compoment due to constant contributions of the sire is slightly less than
.750 depending on the particular breeding scheme used. Inasmuch as the differ- ences are very small, computations were made on the postulate that all the genetic correlations were of the magnitude of the lower of these three values, namely, the value computed for the constant contributions of the dam. This postulate greatly simplifies the calculation of the correlation between 14 and the dam’s full genotype. The procedure is very similar to that described above for index 12, the first step being the determination of the negative correlation between genetic and environmental components of 14.
SELECTION OF SIRES
METHODS OF DETERMINING IMPROVEMENT 577
great, it is worthwhile t o base the second selection on a combination of indices 1.1 (the average of daughters' part records) and 1 2 (the average of the full records of sisters). The method by which the gains due t o selection on the basis of the combined index are computed is illustrated in figure 4.
The computation of the correlations with respect t o index 1 2 , which are
AplgR
BEI8CTIOII
FIGURE 4.-The selection of sires. The upper path diagram shows the relationships between 4, 12, I3 and Gsf in the original unselected population. The lower diagram shows the reduced
variances and altered correlations after the original population has been subjected to the first selection under plan P. Note the correlation of .477 between Gs, and 1 3 which is about 95 percent of the multiple correlation of .5or between Gsf and the optimum combination of 1 2 and 18.
altered as a result of the previous selection on the basis 11, needs no further comment since it is similar t o that already described for the dams. The method for computing the reduced value of the genetic correlation between the full and the part records has also been given. Since GS of the offspring equals one-half of G S of the sire, the square of the correlation between 1 3 and the sire's genotype for the part record, in the case of a sire mated t o 7.73 dams each having on the average 7.06 daughters, is the proportion that one quarter
of ucsp2 is of the variance of the daughters' average, namely:
UGSp2/4
acsp2/4+54.2/(4X 7.73)+58.8/(2X 7.73 X 7.06) +885.5/(7.73 X 7.06)
5 78 EVERETT R. DEMPSTER AND I. MICHAEL LERNER
Indices 1 2 and 1 3 are themselves correlated, but only through their separate
correlations with the sire’s full genotype. The product of these correlations therefore yields the correlation between the two indices. Their combination into a single index is a simple problem in multiple correlation. From figure 4 it is evident that the part records of the sire’s daughters give much more in- formation than the full records of his sisters. This is because of the large number of offspring, the fact that each sire is mated t o several dams whose average contribution to the variance of 1 3 is small, and the previous use of the sires’ sisters in the first selection. I n the case considered only about five per- cent of the gain is due t o the addition of information from the sire’s sisters. It should be understood that what is termed selection of sires here, is actually selection of full sister families, only one brother being used from each family selected. Computed gains would be greater if all the males selected were from the best family, but it is thought that the consequent effects of increased in- breeding would interfere with the realization of computed gains.
COMPUTATION O F THE A N N U A L R A T E S O F GAIN
DICKERSON and HAZEL (1944) have shown that the expected genetic gain per year (AGy) may be computed by adding the AG,‘s weighted for the pro- portions of the total group of breeding animals which each selected group forms (assuming equal number of offspring per parent from each group), and dividing the sum by the average age of the parents. Table 3 of the preceding paper shows the values of AG, for the various plans of dam selection combined with the various plans of sire selection. The mechanics oi these computations are rather simple and may be illustrated by the figures pertaining t o plan 1-5 in combination with sire plan P.
The gain expected from the first selection of 77 dams out of 510 females alive a t one year of age was found to be 5.966/2; from the second and third selections out of the latter group 5.887/2 and 4.302/2. The divisor 2 is used because only one-half of the gain from each parent is realized in the offspring. It cancels out in the formula for AGy appearing below. The appropriately weighted summation of these figures is
[77(5.966)
+
7k.966+
5.887)+
1(5.966+
5.887 4- 4.302)1/(2 X 8s)which equals 6.572/2 eggs. Similar computations for the sires indicate a gain of 6.902/2 eggs. The average age of the dams in this scheme is 1.106 years, while that of the sires is 1.182 years. Hence,
6.572
+
6.902 1.106+
1.182A(& = = 5.89 eggs per year.
The other values recorded in table 3 of the companion paper have been ob- tained in an identical fashion.
SUMMARY
METHODS OF DETERMINING IMPROVEMENT 579 selection plans is presented as applied to the problem of breeding for high egg production.
ACKNOWLEDGEMENT
The authors wish to acknowledge their indebtedness to PROFESSOR L. N.
HAZEL of IOWA STATE COLLEGE for his helpful comments and suggestions. LITERATURE CITED
DJCKERSON, G. E., and L. N. HAZEL, 1944 Effectiveness of selection on progeny performance as a supplement to earlier culling in livestock. J. Agric. Res. 69: 459-476.
FISHER, R. A., and F. YATES, 1938 Statistical tables for biological, agricultural and medical research. VIIIf90 pp. London and Edinburgh: Oliver and Boyd.
LERNER, I. M., and L. N. HAZEL, 1947 Population genetics of a poultry flock under artificial selection. Genetics 32: 325-339.
LUSH, J. L., 1945 Animal breeding plans. Third ed. VIIIS443 pp. Ames, Iowa: Collegiate Press, Inc.
PEARSON, K., 1931 Tables for statisticians and biometricians. Part 11. First ed. CCL+z62 pp. Cambridge, England, Cambridge University Press.
WRIGHT, S., 1921 Systems of mating. Genetics 6 : 111-178.