Comparative Population Genetics of the Panicoid Grasses:
Sequence Polymorphism, Linkage Disequilibrium and
Selection in a Diverse Sample of
Sorghum bicolor
Martha T. Hamblin,* Sharon E. Mitchell,* Gemma M. White,*
,1Javier Gallego,*
,2Rakesh Kukatla,* Rod A. Wing,
†,3Andrew H. Paterson
‡and Stephen Kresovich*
,4*Institute for Genomic Diversity, Cornell University, Ithaca, New York 14853,†Department of Agronomy, Clemson University, Clemson, South Carolina 29634-0359 and‡Plant Genome Mapping Laboratory, University of Georgia, Athens, Georgia 30602
Manuscript received September 25, 2003 Accepted for publication January 28, 2004
ABSTRACT
Levels of genetic variation and linkage disequilibrium (LD) are critical factors in association mapping methods as well as in identification of loci that have been targets of selection. Maize, an outcrosser, has a high level of sequence variation and a limited extent of LD. Sorghum, a closely related but largely self-pollinating panicoid grass, is expected to have higher levels of LD. As a first step in estimation of population genetic parameters in sorghum, we surveyed 27 diverseS. bicoloraccessions for sequence variation at a total of 29,186 bp in 95 short regions derived from genetically mapped RFLPs located throughout the genome. Consistent with its higher level of inbreeding, the extent of LD is at least severalfold greater in sorghum than in maize. Total sequence variation in sorghum is about fourfold lower than that in maize, while synonymous variation is fivefold lower, suggesting a smaller effective population size in sorghum. Because we surveyed a species-wide sample, the mating system, which primarily affects population-level diversity, may not be primarily responsible for this difference. Comparisons of polymorphism and diver-gence suggest that both directional and diversifying selection have played important roles in shaping variation in the sorghum genome.
I
DENTIFICATION of the genetic variation underlying of quantitative trait nucleotides (QTNs; Long and traits important in domestication and improvement Langley1999).of crops is an area of great interest to both evolutionary Characterization of basic population genetic parame-and applied biologists. Classical genetic approaches to this ters is an essential prerequisite to any approach that problem, such as quantitative trait loci (QTL) mapping, analyzes variation in population samples: the power and test for an association between a trait and a gene in resolution of haplotype mapping and association studies experimental populations in which the numbers of seg- depend critically on levels of genetic variation, linkage regating alleles and meioses are both small. In recent disequilibrium (LD), and population structure. Thus, years, methods have been developed that test for such knowledge of population genetic parameters is a prereq-an association in population samples (i.e., groups of uisite to moving beyond mapping in experimental popu-unrelated individuals) in which the numbers of alleles lations. Population genetic analysis can also provide a and meioses are much larger. Together, these methods complementary approach to mapping studies by the provide a strategy for moving from low- to high-resolu- identification of loci that have been targets of selection tion mapping of traits, with the ultimate identification during the process of domestication or crop improve-ment. These methods can be applied to candidate genes identified through mapping or “reverse” genetics (Wang
et al.1999) or used to scan the genome for targets of Sequence data from this article have been deposited in the GenBank
Popset library under accession nos. AY234336–AY234362, AY502964– selection without a prior hypothesis (Vigourouxet al. AY504423, AY514060–AY514119, and AY517934–AY518080 and in the
2002). Tests for evidence of selection can be made only GSS library (S. propinquumdata) under nos. CG993079–CG993165
and CL147585–CL147591. in reference to average genome-wide patterns of neutral 1Present address:PIE Department, IACR-Rothamsted, Harpenden,
variation. Hertfordshire AL5 2JQ, United Kingdom.
Mating system is an important variable in population 2Present address:Facultad de Ciencias Experimentales y de la Salud,
genetics: it influences effective population size and ef-Seccio´n de Biologı´a Celular y Gene´tica, Universidad San Pablo-CEU,
Urb. Monteprı´ncipe, 28668 Madrid, Spain. fective rate of recombination, which in turn influence 3Present address:Department of Plant Sciences, University of Arizona,
levels of genetic variation and linkage disequilibrium Tucson, AZ 85721-0036.
(NordborgandDonnelly1997). Study organisms that 4Corresponding author:Institute for Genomic Diversity, 157
Biotech-vary in mating system are therefore likely to Biotech-vary in their nology Bldg., Cornell University, Ithaca, NY 14853.
E-mail: [email protected] suitability for various types of population-based genetic
ing to United States inbred line BTx406 followed by repeated
analysis. For example, in a species with moderate levels
backcrossing to the exotic parent. Leaves from one individual
of linkage disequilibrium, haplotype mapping can be
from each accession were harvested for extraction of DNA
accomplished with a reasonable density of markers, but according to the method ofDoyleandDoyle(1987). identification of QTNs may not be possible (Nordborg RFLP probe sequences and primer development:Sequence
information was available for clones ofPstI-digested BTx623
et al. 2002; Rafalski2002). Thus, it may be desirable
genomic DNA (“pSB” clones) that had been developed as
to exploit closely related species that differ in mating
RFLP probes (Schlosset al.2002). Our goal was to survey
system as a way to move systematically from lower- to
sequence variation at 10 loci for each of the 10 linkage groups
higher-resolution analyses. for a total ofⵑ100 loci. In anticipation of some failures, 129 Maize (Zea maysL. ssp.mays) and sorghum (Sorghum mapped RFLP loci were chosen to cover as much of the ge-nome as possible. PCR primers were developed for these loci
bicolor[L.] Moench) are closely related species that
dif-and tested on a panel of DNAs from four accessions: BTx3197,
fer dramatically in mating system. Together with pearl
BTx623, RTx430, andS. propinquum. Loci that did not amplify
millet (Pennisetum glaucum), they show considerable
syn-from all four accessions were dropped syn-from the set. Of the
teny in their genomes (Gale and Devos 1998), are 102 successful loci, 96 were chosen for amplification in the expected to share a genetic basis for many agronomi- larger set of 28 accessions. One locus was found to be
dupli-cated and was discarded.
cally important traits, and can be considered one
experi-Sequencing and analysis:PCR products were prepared for
mental system of panicoid grass crops. Basic population
sequence analysis by treatment with exonuclease I and shrimp
genetic analyses have shown that maize, an outcrosser, alkaline phosphatase. Cycle sequencing with ABI (Columbia, has a very high level of sequence variation and a very MD) Big Dye, followed by analysis on an ABI 3700, was per-limited extent of LD (Remingtonet al.2001;Tenaillon formed in the Bioresource Center at Cornell University and at Clemson University. PCR primers were used as sequencing
et al.2001). Because sorghum is largely self-pollinating,
primers. Most PCR products were sequenced with both
for-it is expected to have higher levels of LD and
homozy-ward and reverse primers, but in the event that one reaction
gosity, both of which greatly facilitate LD mapping failed, a single-pass sequence was used.
(Nordborg et al. 2002). Furthermore, sorghum may Chromatograms were assembled into contigs for each locus
using both Seqscape (ABI) and Sequencher (Gene Codes,
prove to be more tractable than maize for genetic
analy-Ann Arbor, MI) software. Our method relied on initial
semi-sis of some phenotypes as its genome is only about
one-automated identification of variation by Seqscape software
fourth the size of that of maize, and it has single copies
(Applied Biosystems) followed by visual inspection and
con-of genes that are duplicated in maize. firmation using Sequencher. Every single-nucleotide polymor-As a first step in exploring the merits of sorghum for phism (SNP) was confirmed by inspection of the chromato-grams by at least two different experienced individuals. For
LD mapping and population genetic analyses, we have
purposes of estimating levels of polymorphism on the basis
assessed sequence variation and LD in 95 short regions
of nucleotide substitution, we removed blocks of three or
(123–444 bp) located throughout the genome, including more contiguous SNPs that were completely associated with coding and noncoding sequences. These regions, which each other, since these are likely to arise through insertion/ correspond to mapped restriction fragment length poly- deletion events rather than through nucleotide substitution. Although sorghum is a predominantly self-pollinating
spe-morphism (RFLP) loci, were sequenced in a panel of
cies and therefore usually homozygous at most loci, some
27S. bicolor accessions representing elite inbred lines,
heterozygous individuals were observed at eight loci. In these
the five races ofS. bicolor ssp.bicolor(caudatum, durra, cases, the heterozygous individual was considered to have two bicolor, guinea, and kafir), and three races ofS. bicolor chromosomes at that region only. With the exception of LD analysis (see below), the phase of SNPs was unimportant in
ssp. verticilliflorum(arundinaceum,aethiopicum, and
verti-our analyses. DnaSP version 3 (RozasandRozas1999) was
cilliflorum). Members of this panel display a wide range
used to calculate diversity and divergence statistics. Insertion/
of geographic and phenotypic diversity. In addition, one deletion variation was not considered in these analyses. accession ofS. propinquum was sequenced at all loci to Each locus was tested for departure from neutrality by serve as an outgroup. Divergence data fromS. propin- the method ofHudsonet al. (1987) as implemented in Jody Hey’s multilocus Hudson-Kreitman-Aguade´ (HKA) program
quumallow inferences about differences in neutral
mu-(http://lifesci.rutgers.edu/heylab/DistributedProgramsand
tation rates across the genome, and the relationship
Data.htm#HKA). The simulations were run 10,000 times.
between polymorphism and divergence allows infer- Linkage disequilibrium:The program dipdat (kindly pro-ences about the possible role of selection in the evolu- vided by R. R. Hudson) was used to estimateD⬘andr2, mea-sures of linkage disequilibrium, as functions of distance. This
tion of particular loci. Identification of targets of
selec-program uses the maximum-likelihood method of Hill
tion may prove valuable in the search for candidate
(1974) to estimate these measures from diploid genotype data.
genes underlying important phenotypes. Positions at which the rare allele was present in less than three
copies were not included in the analysis. For comparisons involving sites within the same locus, distance was measured in base pairs. For comparisons involving sites at different loci, MATERIALS AND METHODS
distance was measured in centimorgans as reported byBowers Plant material:Accessions and their attributes are listed in et al.(2003).
cross-Assignment of coding regions:Most of the loci sequenced that the variances of statistics of interest are likely to be were anonymous genomic regions. To classify as many sites larger than the standard variances assumed in tests as possible by functional category, we performed database
based on these statistics (Wakeley1996).
searches (blastn and blastx) to identify those regions for which
Only base-substitution polymorphisms are included
there was good evidence of a transcribed open reading frame.
The sequence of the surveyed region was submitted to a blastx in the statistics reported in Table 2. Although 46 loci
search against the nonredundant protein database of Gen- had at least one indel, only 26 loci had indel variation Bank using default parameters. Criteria were as follows: polymorphic in S. bicolor. Most length variation was
found between S. bicolor and S. propinquum where it
1. If the region showed a 98–100% sequence match to aS.
bicolorexpressed sequence tag (EST) from the CGGC data- sometimes appeared to be complex and difficult to
base or a⬎95% sequence match to aZ. mays EST from align. A total of 238 SNPs were observed in 29,186 bases the Institute for Genomic Research database or GenBank, surveyed, yielding an average of one SNP every 123 a score of⬎50 in a blastx query of the protein database
nucleotides in this sample. This is about one-fourth the
was sufficient to consider it a coding region. Scores only
frequency observed in a comparable sample in maize
slightly ⬎50 usually represented short stretches of high
similarity. (Tenaillonet al.2001). The average level of nucleotide
2. In the absence of a strong match in either the sorghum diversity, as well as sequence variation based on the or the maize EST databases, it is still possible that a region number of segregating sites (Watterson 1975), is encodes a rare transcript. In such cases, a region with a
0.23%, compared to 0.96% in maize (Tenaillonet al.
blastx score of⬎80 was required for the region to be
consid-2001). In comparisons to other selfing plants, total
se-ered coding. In most of these cases, the region also had a
strong match with genomic or EST sequence from rice. quence variation as well as synonymous site variation in
An exception to this requirement was locus 640, at which both Arabidopsis (Aguade´2001;Shepardand Purug-polymorphisms were observed more frequently at synony- ganan 2003) and wild barley (Morrell et al. 2003) mous sites than if they were occurring at random. In this
worldwide samples is about threefold higher than that
case, the pattern of polymorphisms provided convincing
of sorghum. In both cases, the higher diversity results
evidence that the region codes for protein, even though
the blastx score was only 75 and there was no good EST from the presence of highly diverged haplotypes at some
match in either maize or sorghum. loci.
If the three wild sorghum accessions are removed from the sample, the number of bases surveyed increases to 29,306 while the number of segregating sites
de-RESULTS
creases to 198. Nucleotide diversity is reduced only Our goal was to characterize levels and patterns of slightly, to 0.21%, because the SNPs unique to the wild sequence variation across the sorghum genome in a accessions are usually singletons. Removal of the wild diverse panel of germplasm (Table 1) and to identify accessions increases the averageDto 0.299, indicating regions that appear to depart from average patterns. that alleles in cultivated S. bicolor tend to be skewed The final data set represents loci that could be amplified toward intermediate frequency.
and successfully sequenced in our panel of 27S. bicolor Evidence for directional and diversifying selection:
and oneS. propinquum(seematerials and methods). Estimates of sequence diversity () at individual loci Not all individuals were successfully amplified or se- ranged from 0 to 1.5%. Variation in levels of diversity quenced for all loci, so the sample size varies from locus is expected as a consequence of evolutionary variance, to locus, averaging 24.7 chromosomes/locus (range is sampling variance due to the small number of nucleo-14–30). The sample size is greater than the number of tides surveyed per locus, and differences in neutral mu-accessions in a few cases because of the presence of some tation rate among loci. The neutral mutation rate can heterozygous individuals (seematerials and methods). be estimated by the amount of divergence between spe-At most loci (87), all individuals were homozygous at cies, in this caseS. propinquum, which varies from 0 to all sites. At 8 loci, a few individuals were heterozygous at 9.8% and averages ⵑ1.2% (Table 2). Polymorphism one or more sites. Accessions BTx406, BTx3197, 152702, and divergence are expected to increase and decrease 267380, SC0033, and SC0155 were heterozygous at two together across the genome when a changing neutral loci, and accessions 195684, 56174, and LWA4 were mutation rate underlies both phenomena, while a
dra-heterozygous at 3 loci. matic change in the relationship between
polymor-Total sequence diversity inS. bicolor:Standard sum- phism and divergence suggests the local effects of selec-mary statistics of sequence variation for each locus are tion. We plotted and divergence as a function of presented in Table 2, arranged by linkage group; LG genetic map position across each linkage group (see designations followChittendenet al. (1994). It should Figure 1). These plots illustrate how dramatically the be noted that our panel of accessions, which includes relationship between polymorphism and divergence one individual from each of several populations of two can change, even at fairly closely linked loci.
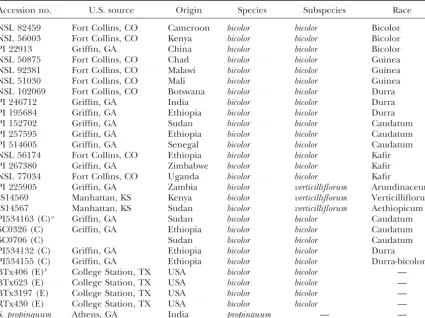
TABLE 1
Accessions and their geographic and racial associations
Accession no. U.S. source Origin Species Subspecies Race
NSL 82459 Fort Collins, CO Cameroon bicolor bicolor Bicolor NSL 56003 Fort Collins, CO Kenya bicolor bicolor Bicolor PI 22913 Griffin, GA China bicolor bicolor Bicolor NSL 50875 Fort Collins, CO Chad bicolor bicolor Guinea NSL 92381 Fort Collins, CO Malawi bicolor bicolor Guinea NSL 51030 Fort Collins, CO Mali bicolor bicolor Guinea NSL 102069 Fort Collins, CO Botswana bicolor bicolor Durra PI 246712 Griffin, GA India bicolor bicolor Durra PI 195684 Griffin, GA Ethiopia bicolor bicolor Durra PI 152702 Griffin, GA Sudan bicolor bicolor Caudatum PI 257595 Griffin, GA Ethiopia bicolor bicolor Caudatum PI 514605 Griffin, GA Senegal bicolor bicolor Caudatum NSL 56174 Fort Collins, CO Ethiopia bicolor bicolor Kafir PI 267380 Griffin, GA Zimbabwe bicolor bicolor Kafir NSL 77034 Fort Collins, CO Uganda bicolor bicolor Kafir
PI 225905 Griffin, GA Zambia bicolor verticilliflorum Arundinaceum IS14569 Manhattan, KS Kenya bicolor verticilliflorum Verticilliflorum IS14567 Manhattan, KS Sudan bicolor verticilliflorum Aethiopicum PI534163 (C)a Griffin, GA Sudan bicolor bicolor Caudatum
SC0326 (C) Griffin, GA Ethiopia bicolor bicolor Caudatum
SC0706 (C) Sudan bicolor bicolor Caudatum
PI534132 (C) Griffin, GA Ethiopia bicolor bicolor Durra PI534155 (C) Griffin, GA Ethiopia bicolor bicolor Durra-bicolor BTx406 (E)b College Station, TX USA bicolor bicolor —
BTx623 (E) College Station, TX USA bicolor bicolor — BTx3197 (E) College Station, TX USA bicolor bicolor — RTx430 (E) College Station, TX USA bicolor bicolor —
S. propinquum Athens, GA India propinquum — —
aA converted line (see text). bAn elite line.
(1987), known as the HKA test. This test compares poly- background selection (Charlesworth et al. 1993) to reductions in variation cannot be taken into account. morphism and divergence at multiple unlinked loci:
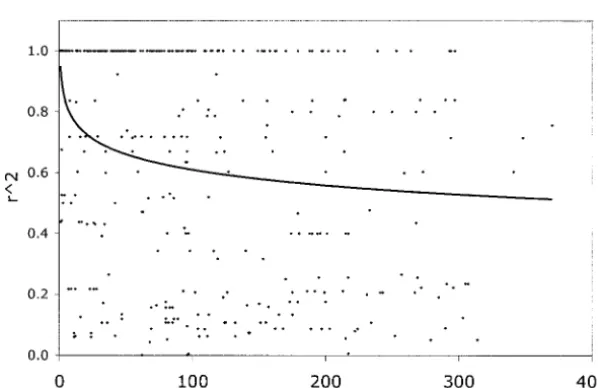
under neutrality, all loci should be consistent with one Short-range and long-range linkage disequilibrium: Sorghum is a predominantly self-pollinating species (es-estimate of effective population size and divergence
time, given a constant neutral mutation rate at each timates of outcrossing range from 2 to 35% depending on panicle type; Dje et al. 2000; Rooney and Smith
locus. The overall2statistic for the data set was 145.11,
which has aP-value of 0.00061, and none of the 10,000 2000) and is therefore expected to show higher levels of LD than outcrossing species like maize (Nordborg
simulations had a 2statistic that high, indicating that
selection has altered patterns of polymorphism and di- 2000), which has a selfing rate ofⵑ10% (Kahleret al.
1984). Smaller effective population size, indicated by vergence in these data. On the other hand, none of the
individual cell values had aP-value⬍0.10, so there was sorghum’s lower level of sequence diversity, will also lead to higher levels of LD. In Figure 2, we showr2as a
not strong evidence that any particular locus had been
under selection. In Table 3, we show the 10 loci that function of distance for comparisons within loci, pooled over the entire data set. A logarithmic trend line fit to had the greatest deviation from expected values
(indi-cated by asterisks in Figure 1). Of these 10 loci, 4 show the data indicates that averager2drops toⵑ0.5 by 400
bp. For this same set of comparisons, only 29 of 329 a deficiency and 6 show an excess of polymorphism
relative to divergence, suggesting that both directional |D⬘| values were⬍1.0. Since none of the comparisons involve SNPs⬎400 bp apart, we are unable to estimate and diversifying selection have played a role in sorghum
evolution. When the three wild accessions are removed the decay of LD over longer intragenic distances. How-ever, even in this limited data set, there is a clear contrast from the analysis, the results change very little (data not
shown). We have no information about regional rates with maize, for which Tenaillon et al. (2001) found thatr2 dropped to 0.24 by 200 bp and to 0.15 by 500
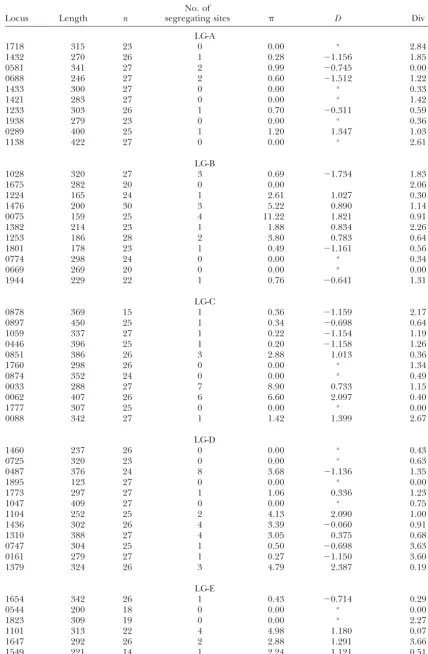
TABLE 2
Polymorphism and divergence of 95 loci arranged by linkage group
No. of
Locus Length n segregating sites D Div
LG-A
1718 315 23 0 0.00 a 2.84
1432 270 26 1 0.28 ⫺1.156 1.85
0581 341 27 2 0.99 ⫺0.745 0.00
0688 246 27 2 0.60 ⫺1.512 1.22
1433 300 27 0 0.00 a 0.33
1421 283 27 0 0.00 a 1.42
1233 303 26 1 0.70 ⫺0.311 0.59
1938 279 23 0 0.00 a 0.36
0289 400 25 1 1.20 1.347 1.03
1138 422 27 0 0.00 a 2.61
LG-B
1028 320 27 3 0.69 ⫺1.734 1.83
1675 282 20 0 0.00 2.06
1224 165 24 1 2.61 1.027 0.30
1476 200 30 3 5.22 0.890 1.14
0075 159 25 4 11.22 1.821 0.91
1382 214 23 1 1.88 0.834 2.26
1253 186 28 2 3.80 0.783 0.64
1801 178 23 1 0.49 ⫺1.161 0.56
0774 298 24 0 0.00 a 0.34
0669 269 20 0 0.00 a 0.00
1944 229 22 1 0.76 ⫺0.641 1.31
LG-C
0878 369 15 1 0.36 ⫺1.159 2.17
0897 450 25 1 0.34 ⫺0.698 0.64
1059 337 27 1 0.22 ⫺1.154 1.19
0446 396 25 1 0.20 ⫺1.158 1.26
0851 386 26 3 2.88 1.013 0.36
1760 298 26 0 0.00 a 1.34
0874 352 24 0 0.00 a 0.49
0033 288 27 7 8.90 0.733 1.15
0062 407 26 6 6.60 2.097 0.40
1777 307 25 0 0.00 a 0.00
0088 342 27 1 1.42 1.399 2.67
LG-D
1460 237 26 0 0.00 a 0.43
0725 320 23 0 0.00 a 0.63
0487 376 24 8 3.68 ⫺1.136 1.35
1895 123 27 0 0.00 a 0.00
1773 297 27 1 1.06 0.336 1.23
1047 409 27 0 0.00 a 0.75
1104 252 25 2 4.13 2.090 1.00
1436 302 26 4 3.39 ⫺0.060 0.91
1310 388 27 4 3.05 0.375 0.68
0747 304 25 1 0.50 ⫺0.698 3.63
0161 279 27 1 0.27 ⫺1.150 3.60
1379 324 26 3 4.79 2.387 0.19
LG-E
1654 342 26 1 0.43 ⫺0.714 0.29
0544 200 18 0 0.00 a 0.00
1823 309 19 0 0.00 a 2.27
1101 313 22 4 4.98 1.180 0.07
1647 292 26 2 2.88 1.291 3.66
1549 221 14 1 2.24 1.121 0.51
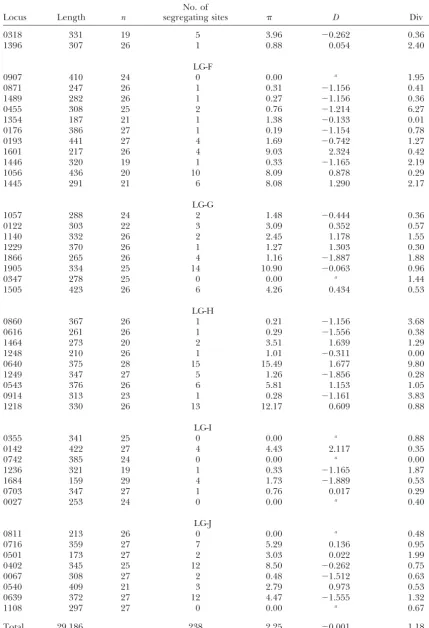
TABLE 2
(Continued)
No. of
Locus Length n segregating sites D Div
0318 331 19 5 3.96 ⫺0.262 0.36
1396 307 26 1 0.88 0.054 2.40
LG-F
0907 410 24 0 0.00 a 1.95
0871 247 26 1 0.31 ⫺1.156 0.41
1489 282 26 1 0.27 ⫺1.156 0.36
0455 308 25 2 0.76 ⫺1.214 6.27
1354 187 21 1 1.38 ⫺0.133 0.01
0176 386 27 1 0.19 ⫺1.154 0.78
0193 441 27 4 1.69 ⫺0.742 1.27
1601 217 26 4 9.03 2.324 0.42
1446 320 19 1 0.33 ⫺1.165 2.19
1056 436 20 10 8.09 0.878 0.29
1445 291 21 6 8.08 1.290 2.17
LG-G
1057 288 24 2 1.48 ⫺0.444 0.36
0122 303 22 3 3.09 0.352 0.57
1140 332 26 2 2.45 1.178 1.55
1229 370 26 1 1.27 1.303 0.30
1866 265 26 4 1.16 ⫺1.887 1.88
1905 334 25 14 10.90 ⫺0.063 0.96
0347 278 25 0 0.00 a 1.44
1505 423 26 6 4.26 0.434 0.53
LG-H
0860 367 26 1 0.21 ⫺1.156 3.68
0616 261 26 1 0.29 ⫺1.556 0.38
1464 273 20 2 3.51 1.639 1.29
1248 210 26 1 1.01 ⫺0.311 0.00
0640 375 28 15 15.49 1.677 9.80
1249 347 27 5 1.26 ⫺1.856 0.28
0543 376 26 6 5.81 1.153 1.05
0914 313 23 1 0.28 ⫺1.161 3.83
1218 330 26 13 12.17 0.609 0.88
LG-I
0355 341 25 0 0.00 a 0.88
0142 422 27 4 4.43 2.117 0.35
0742 385 24 0 0.00 a 0.00
1236 321 19 1 0.33 ⫺1.165 1.87
1684 159 29 4 1.73 ⫺1.889 0.53
0703 347 27 1 0.76 0.017 0.29
0027 253 24 0 0.00 a 0.40
LG-J
0811 213 26 0 0.00 a 0.48
0716 359 27 7 5.29 0.136 0.95
0501 173 27 2 3.03 0.022 1.99
0402 345 25 12 8.50 ⫺0.262 0.75
0067 308 27 2 0.48 ⫺1.512 0.63
0540 409 21 3 2.79 0.973 0.53
0639 372 27 12 4.47 ⫺1.555 1.32
1108 297 27 0 0.00 a 0.67
Total 29,186 238 2.25 ⫺0.001 1.18
n, sample size (chromosomes);, nucleotide diversity (Nei1987)⫻ 1000;D, Tajima’s D(Tajima1989); Div, net nucleotide divergence (Nei1987) betweenS. bicolorandS. propinquum⫻100.
Figure1.—Polymorphism and divergence across each linkage group. The x-axis is genetic position in centimorgans. Solid lines with diamonds represent nucleotide diversity withinS. bicolormultiplied by 1000; the average value isⵑ2.2 on this scale. Dashed lines with squares represent net divergence betweenS. bicolorandS. propinquummultiplied by 100; the average value is ⵑ1.2 on this scale. Locus 640 was removed from the representation of LG H because of its extremely high divergence. Asterisks indicate the positions of loci listed in Table 3. The solid arrow indicates the position of the loci associated with domestication QTL mentioned at the end of thediscussion.
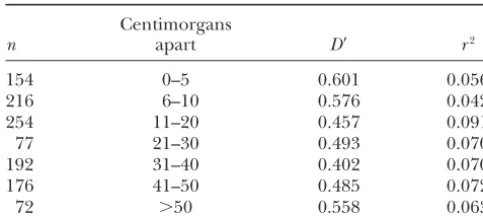
bp. Even in a narrower sample of maize germplasm, associations between variants at different loci, where distances are measured in centimorgans rather than in where LD is expected to be higher,Remingtonet al.
(2001) found that r2 at five of six genes dropped to base pairs (Table 4). Fisher’s exact tests showed that
TABLE 3
Loci showing an unusual level of variation as assessed by the multilocus HKA test
Segregating sites Divergence
Locus observed/expected observed/expected Locationa Cell valueb
1718 0/3.3 8.0/4.7 A (9.2) 4.34
1138 0/4.2 11.0/6.8 A (85.4) 5.17
0907 0/3.0 8.0/5.0 F (7.7) 3.87
0455 2/8.3 19.1/12.9 F (54.7) 4.71
1056 10/4.7 2.8/8.1 F (99.3) 6.71
1905 14/7.4 4.9/11.6 G (68.5) 6.17
1249 5/2.4 1.2/3.8 H (53.1) 3.81
1218 13/6.9 4.9/11.1 H (84.7) 5.73
0402 12/6.1 4.0/9.9 J (51.6) 6.12
0639 12/6.9 5.7/10.9 J (57.0) 4.12
aLinkage group assignment (position in centimorgans).
bSummed contribution to2from both polymorphism and divergence; the mean cell value for all loci is 1.53.
0.05 level, in contrast to the 1.5% significant interlocus supplemental). We also estimated the average levels of W(Watterson1975) for purposes of comparisons with
comparisons found byTenaillon et al. (2001). Thus,
in agreement with theoretical predictions, sorghum’s maize: average W at synonymous sites is 0.34%,
com-pared to 1.73% in maize, while the average level at selfing behavior and smaller effective population size
seem to produce stronger long-distance allelic associa- nonsynonymous sites is 0.09%, compared to 0.39% in maize. The ratio of synonymous to nonsynonymous vari-tions than those of maize.
Variation in protein-coding regions:All loci were ana- ation, 3.8, is between that of maize (4.43) and humans (2.65), both of which are smaller than that of Drosophila lyzed to determine whether there was good evidence
that the sequence encodes protein and, if so, to establish (8.67;Tenaillonet al.2001).
Both positive and negative selection can alter the ratio the reading frame for codon-based analyses (see
mate-rials and methods). Of the 29,186 nucleotides sur- of nonsynonymous to synonymous changes. When most variation is neutral, the ratio of synonymous to nonsyn-veyed, 11,025 (38%) from 52 loci were classified as
cod-ing sequence. Since the remaincod-ing sequence could not onymous mutations is the same within and between species. A departure from this expectation can be de-be assumed to de-be noncoding, no analysis was done of
noncoding sequence as a functional class. Average nu- tected with a 2⫻2 test of independence (McDonald
andKreitman1991), although the effects of selection cleotide diversity () at synonymous sites and
nonsynon-ymous sites is 0.39 and 0.09%, respectively (estimates are very hard to detect at individual loci, particularly when the number of nucleotides surveyed is small. How-for each locus are provided at http://www.genetics.org/
TABLE 5 TABLE 4
Average LD between loci in the same linkage group Polymorphism and divergence of synonymous
and nonsynonymous variation as a function of genetic distance
Centimorgans Pooled Pooled
(52 loci) Locus 640 loci⫺640
n apart D⬘ r2
154 0–5 0.601 0.056 S N S N S N
216 6–10 0.576 0.042
Within 37 37 5 3 32 34
254 11–20 0.457 0.091
Between 78 47 12 20 66 27
77 21–30 0.493 0.070
P-value 0.087 0.250 0.004
192 31–40 0.402 0.070
176 41–50 0.485 0.072 Within, withinS. bicolor; Between, betweenS. bicolorandS. 72 ⬎50 0.558 0.063 propinquum;S, the number of mutations at synonymous sites;
N, the number of mutations at nonsynonymous sites. n, the number of pairwise comparisons. Centimorgans are
rounded to the closest integer.
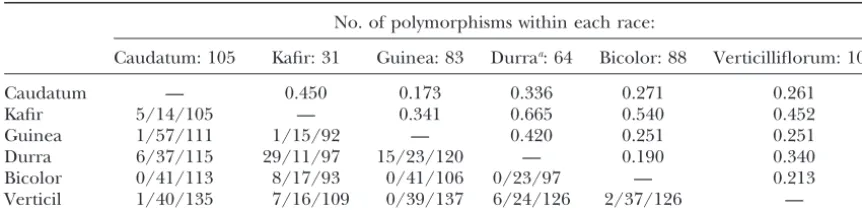
1998). Of the five S. bicolor ssp. bicolor races, bicolor is the most variable, consistent with it being the most ever, we can test whether genome-wide patterns of
varia-primitive of the cultivated sorghums (Kimber 2000). tion depart from the neutral expectation. In particular,
The next most variable is caudatum, followed in de-we de-were interested in testing for an excess of
replace-scending order by guinea, durra, and kafir. ment polymorphisms, as has been observed in several
recent studies of variation in humans (Sunyaev et al.
2000;Fayet al.2001) and Arabidopsis (Bustamanteet
DISCUSSION
al.2002). The data are shown in Table 5: when data
from all loci are pooled, there is a trend toward an The panicoid grass crops provide an opportunity for excess of replacement polymorphisms, and it is close to efficient identification of genetic variation underlying
statistically significant. common phenotypes of agronomic interest.
Correspon-One locus, 640, is a clear outlier in this study. This dence of QTL locations (Patersonet al.1995) suggests locus putatively encodes a homolog ofMla1, a mildew- that many such traits may have been subjected to conver-resistance gene characterized in barley. Disease resis- gent selection in different grasses, so the identification tance genes are known to have very rapid rates of evolu- of the underlying gene in one taxon may often account tion and to accumulate amino acid differences at a for variation in other related taxa. The suitability of each much higher rate than the average (Bishopet al.2000; species for various higher-resolution strategies such as
Bergelsonet al.2001). Indeed, locus 640 accounts for LD mapping, association studies, and screens for targets almost half (20/47) of the total amino acid differences of selection will depend on its particular level of genetic observed between S. bicolor and S. propinquum. When variation and extent of LD, both of which are affected locus 640 is tested alone, the trend is toward an excess by mating system. Among the panicoid grasses, these of amino acidfixations, opposite to that observed in the population genetic parameters have previously been es-pooled data. Removal of locus 640 from the es-pooled data timated only in maize (Remingtonet al.2001;
Tenail-results in a highly significant test statistic indicating that, lon et al. 2001). To provide a similar framework for genome-wide, there are more nonsynonymous polymor- studies in sorghum, we have surveyed genome-wide
se-phisms inS. bicolorthan expected. quence variation in a diverse panel of germplasm.
Relationships among races: S. bicolor, having origi- Sequence diversity: This study shows that sorghum
nated in eastern Africa, has been classified into five has about one-fourth the total variation of maize, from racial groups on the basis of morphology, and previous which sorghum is thought to have divergedⵑ16.5 mil-studies based on allozyme, RFLP, and simple sequence lion years ago (GautandDoebley1997). On the basis repeat variation have concluded that both geography of synonymous sites alone, the fraction drops almost and racial structure contribute to the genetic relation- to one-fifth. The small discrepancy between total and ships among accessions (Aldrichet al.1992;Deuet al. synonymous variation may result from the different pro-1994;Djeet al.2000). The extent of genetic divergence portions of coding and noncoding sequences included among the races, as measured byFst, varies considerably in the sequences used to estimate “total” variation. In
(Table 6). Kafir and durra, which have 29 fixed differ- addition, levels of total variation may be affected by ences between them and share only 11 of 97 polymor- different patterns of nearly neutral evolution in the two phisms, are the most divergent pair. Part of this diver- species (see below).
TABLE 6
Genetic differentiation between races ofS. bicolor
No. of polymorphisms within each race:
Caudatum: 105 Kafir: 31 Guinea: 83 Durraa: 64 Bicolor: 88 Verticilliflorum: 107
Caudatum — 0.450 0.173 0.336 0.271 0.261
Kafir 5/14/105 — 0.341 0.665 0.540 0.452
Guinea 1/57/111 1/15/92 — 0.420 0.251 0.251
Durra 6/37/115 29/11/97 15/23/120 — 0.190 0.340 Bicolor 0/41/113 8/17/93 0/41/106 0/23/97 — 0.213 Verticil 1/40/135 7/16/109 0/39/137 6/24/126 2/37/126 —
The top half isFstcalculated according toHudsonet al.(1992). The bottom half is the number of fixed
differences/number of shared polymorphisms/number of total polymorphisms.
aAccession PI 195684 was eliminated from this analysis due to missing data at a large number of loci.
loci (21% of the 129 loci tested) that could not be There is considerable theoretical work on the effects of self-pollination on population genetics. In a completely amplified inS. propinquumwere dropped from the study.
Another possibility is that genome-wide mutation rates self-pollinating species, effective population size, and hence polymorphism, is reduced by half (Pollak1987). in sorghum are lower than those in maize. Considering
replication errors alone, the fairly recent common an- Furthermore, the effective rate of recombination is re-duced because most individuals are homozygous at most cestry of maize and sorghum makes this hypothesis
im-plausible. However, the presence of duplicated genes loci. Background selection caused by the elimination of deleterious alleles therefore has a very important effect in maize may allow for relaxed constraint and divergent
evolution in paralogues, which may increase the neutral (Charlesworth et al. 1993), reducing variation as much as 10-fold, depending on the deleterious mutation mutation rate (Ohta1993;Clegget al.1997;
Kondra-shovet al.2002) although it has no effect on the under- rate. Hitchhiking effects of directional selection will also be stronger in a self-pollinating species. (All these effects lying mutational process.
Since variation is a function of both neutral mutation would be intermediate in a partially selfing organism.) Indirectly, mating system may also affect population rate and effective population size, it is likely that
sor-ghum has an effective population size (Ne) considerably structure, since selfing species are more likely to be
colonizers and may have a more fragmented distribu-smaller than that of maize. To what extent this simply
reflects differences in census population size is difficult tion. The effects of a fragmented population structure are complicated, but can result in smaller effective popu-to say. However, because there is seldom a very good
correspondence between census size and effective size, lation size in some situations (WhitlockandBarton
1997;WakeleyandAliacar 2001). other factors must be considered. A domestication
“bot-tleneck” may have been more severe in sorghum than Several empirical studies have compared patterns of sequence variation in selfing species to those in closely in maize, which has retained ⵑ70% of the variation
present in ancestral teosinte (Eyre-Walkeret al.1998; related outcrossing species. In the genus Lycopersicon,
Baudry et al. (2001) found that two self-compatible
White andDoebley 1999). Our sampling is not
ade-quate to address this question, but other studies that tomato species were 4- to 40-fold less variable than the least variable of three self-incompatible species, a far measured allozyme or RFLP variation in larger numbers
of accessions estimated that cultivated sorghum retains greater difference than could be accounted for by mat-ing system alone. In Leavenworthia (Liu et al. 1999), 60–70% of the variation in its wild relatives (Aldrich
et al.1992;Cui et al.1995), similar to the estimate for sequence variation at PgiCwas also greatly reduced in the self-pollinating species. However, at the Adh locus maize. On the other hand, the average Tajima’sD in
cultivated sorghum (0.299) is considerably higher than in Arabidopsis lyrataandA. thaliana(Savolainenet al.
2000), the results were less clear and depended critically that in maize, where it is close to zero (Tenaillonet al.
2001), possibly indicating a greater effect of a bottle- on whether the species were compared on the basis of
within-population or across-population variation. In all neck. Population structure may also contribute to the
higherDstatistic. three of these studies, each sample was composed of
individuals from a single location. Theoretical models The effects of self-pollination on population genetics:
Another factor affecting the difference in sequence vari- that predict reducedNein self-pollinators are also based
on single population samples.Savolainenet al.(2000), ation between sorghum and maize may be their
lations is low compared to that in outcrossingA. lyrata that spans tens of kilobases, and preliminary results sug-gest that LD dissipates within 10 kb or less (M. T.
Ham-populations, but that across-population variation is
simi-lar in the two species. A simi-larger study byWright et al. blin, unpublished data). Thus it appears that the high, but partial, rate of self-pollination in sorghum produces (2003) found that within-population variation inA.
lyr-atawas 10-fold higher than that inA. thaliana, but that a pattern of LD that is intermediate between that of maize and Arabidopsis (Nordborg et al. 2002). It is species-wide variation in A. thaliana was intermediate
between that ofA. lyrata petraeaandA. lyrata lyrata. Their worth noting, however, that comparison with wild barley also reveals that mating system is not a simple predictor results suggested that (a) factors other than mating
sys-tem contribute to the observed differences in variation of levels of LD or sequence variation: barley is highly self-pollinating but is more similar in diversity and LD and that (b) the effects of population subdivision and
demographic history make it difficult to infer popula- to maize than to sorghum (Morrellet al.2003).
Excess amino acid polymorphism: Effective
popula-tion genetic parameters from levels and patterns of
se-quence variation. tion size not only determines levels of neutral variation,
but also affects patterns of nearly neutral variation, al-The analyses of Wrightet al.(2003) were based on
analyses of variation both within and between popula- though this process is still not well understood (Ohta
2002). We have found evidence for an excess of amino tions, so our data are not directly comparable. However,
their results suggest that, because our sample includes acid polymorphism in sorghum, a pattern that has also been observed in Arabidopsis (Bustamanteet al.2002) individuals from many disparate populations, mating
system may not be the primary explanation for the lower and humans (Sunyaevet al.2000;Fayet al.2001). This pattern is thought to be due to the presence of variants level of variation in sorghum relative to maize. And while
it is reasonable to conclude that a fivefold reduction in that are subject to selection coefficients on the order of the reciprocal ofNeand may explain the difference
synonymous site variation reflects a smaller effective
population size, it is not possible to make a quantitative in ratios of synonymous to nonsynonymous variation in species of different effective size. This ratio is smaller statement about that difference.
While one might expect comparisons to other self- in sorghum than in maize, consistent with this theory. Also consistent is the fact that amino acid polymor-pollinating species to provide some insight on the effect
of mating system on levels of sequence variation, the phisms in sorghum have a lower average frequency than synonymous polymorphisms: while for synonymous comparisons to wild barley and Arabidopsis, which show
severalfold higher levels of species-wide variation, are sites is ⬎W, there is essentially no difference between andWfor nonsynonymous sites.
likely to be confounded by other factors. There are
deeply diverged lineages at many loci in both these An alternative explanation is that, in this diverse group of accessions, human selection and/or local adap-species, as well as strong geographic structure in barley,
suggesting that the population histories of these species tation have favored different protein alleles in different environments (see below). Africa, where sorghum diver-are quite different from that of cultivated sorghum. The
comparison to maize is more easily interpreted, in that sification occurred, has a particularly wide range of habi-tats ranging from humid tropics to desert (Kimber
the two species are closely related and both have been
domesticated and dispersed by humans within the last 2000), a situation that could produce strong diversifying selection. Association studies with nonsynonymous SNPs 10,000 years.
Linkage disequilibrium: The extent to which linked could address this interesting possibility. (Note that the
racial groups analyzed in Table 6 do not correspond sites will have a correlated evolutionary history is a
func-tion of both effective populafunc-tion size and recombinafunc-tion to geographical subpopulations; the durra sample, for example, consists of accessions from India, Ethiopia, rate, both of which are affected by mating system (
Nord-borg2000), although sorghum’s lowerNemay largely and Botswana.)
The effects of selection on sequence variation: Candi-be due to other factors. Consistent with the predicted
effects of self-pollination and reduced effective popula- date genes for association studies are typically identified through integration of QTL mapping, molecular genet-tion size, sorghum has a greater extent of LD than does
maize. Our sequencing strategy did not allow us to plot ics, and bioinformatics approaches. Population genetic analyses can complement this strategy by identifying the decay of LD with physical distance, but short-range
intralocus associations are much stronger than those in regions that have been subject to selection (Vigouroux
et al. 2002). This approach is likely to be particularly maize, and significant interlocus associations are
sever-alfold more common. On the other hand, the vast ma- fruitful in crop species, where recent human selection is known to be responsible for much of the useful pheno-jority of interlocus associations are not significant, and
the relationship between polymorphism and divergence typic variation.
Selection by humans to improve the agronomic prop-changes dramatically at fairly short genetic distances
(e.g., Figure 1), suggesting that recombination has de- erties of crops is expected to produce characteristic signatures of selection at loci underlying those traits coupled the evolutionary histories of most loci that are
“domesti-cation traits,” such as the retention of seeds, should nomically important phenotypes in the grasses and grains.
show a signature of directional selection, namely a
defi-M. Tuinstra, W. Rooney, and G. Peterson provided seed; C. T. Hash ciency of variation relative to divergence. We observed
provided information about accessions; Maria Jose´ Aranzana provided several loci in our study that have this signature (Table
technical assistance; J. Hey provided a program to perform the multi-3), suggesting that genes in these regions may have been locus HKA test; E. Buckler, P. Morrell, M. Aguade´, and two anonymous targets of selection. The genomic region affected by a reviewers provided comments on the manuscript. Support for this project came from grants DBI-9872649 and 01-15903 from the Na-selective event may be relatively larger in sorghum than
tional Science Foundation to A.H.P. and S.K. in maize or other largely outcrossing taxa, due to the
reduced effective rate of recombination.
In contrast to targets of directional selection, loci that
LITERATURE CITED
have responded to selection from local conditions may
show an elevated level of diversity in a species-wide sam- Aguade´, M., 2001 Nucleotide sequence variation at two genes of the phenylpropanoid pathway, the FAH1 and F3H genes, in Arabi-ple such as ours, although they might show reduced
dopsis thaliana. Mol. Biol. Evol.18:1–9.
variation within a local population. Six of the most un- Aldrich, P. R., J. Doebley, K. F. SchertzandA. Stec, 1992 Patterns of allozyme variation in cultivated and wild Sorghum bicolor. usual loci in our HKA tests (Table 3) departed in the
Theor. Appl. Genet.85:451–460. direction of excess polymorphism. Of these six, loci
Baudry, E., C. Kerdelhue, H. InnanandW. Stephan, 2001 Species 1056, 1218, and 1249 have five, seven, and one nonsyn- and recombination effects on DNA variability in the tomato
ge-nus. Genetics158:1725–1735. onymous polymorphism(s), respectively, while coding
Bergelson, J., M. Kreitman, E. A. StahlandD. Tian, 2001 Evolu-sites were not identified in the other three loci.
Interest-tionary dynamics of plant R-genes. Science292:2281–2285. ingly, theoretical work (Nordborg et al. 1996) has Bishop, J. G., A. M. DeanandT. Mitchell-Olds, 2000 Rapid
evolu-tion in plant chitinases: molecular targets of selecevolu-tion in plant-shown that high rates of selfing increase the
signal-pathogen coevolution. Proc. Natl. Acad. Sci. USA97:5322–5327. to-noise ratio for diversifying selection, making it easier
Bowers, J. E., C. Abbey, S. Anderson, C. Chang, X. Drayeet al., to detect than in outcrossing species. 2003 A high-density genetic recombination map of sequence-tagged sites for Sorghum, as a framework for comparative struc-Our power to detect strong evidence of selection at
tural and evolutionary genomics of tropical grains and grasses. particular loci in this study is impaired because
detec-Genetics165:367–386.
tion of selection was not the major motivation of the Bustamante, C. D., R. Nielsen, S. A. Sawyer, K. M. Olsen, M. D. Puruggananet al., 2002 The cost of inbreeding in Arabidopsis. study and the amount of data at any one locus is quite
Nature416:531–534. small. None of the departures that we identify in Table
Charlesworth, B., 1998 Measures of divergence between popula-3 is significant; they simply identify candidate regions tions and the effect of forces that reduce variability. Mol. Biol.
Evol.15:538–543. for further investigation. Conversely, there are regions
Charlesworth, B., M. T. MorganandD. Charlesworth, 1993 not highlighted in Table 3 for which independent
evi-The effect of deleterious mutations on neutral molecular varia-dence suggests that they may be associated with pheno- tion. Genetics134:1289–1303.
Chittenden, L. M., K. F. Schertz, Y. R. Lin, R. A. WingandA. H. types under selection. On LG D, for example,at loci
Paterson, 1994 A detailed RFLP map of Sorghum bicolor⫻ 747 (57 cM) and 161 (59 cM) is eightfold less than
S. propinquum, suitable for high-density mapping, suggests an-average, while divergence is more than three times the cestral duplication of Sorghum chromosomes or chromosomal
segments. Theor. Appl. Genet.87:925–933. average (see arrow in Figure 1). These loci are within the
Clegg, M. T., M. P. CummingsandM. L. Durbin, 1997 The evolu-likelihood intervals for QTL affecting tillering, regrowth
tion of plant nuclear genes. Proc. Natl. Acad. Sci. USA94:7791– (Patersonet al. 1995), and leaf morphology (R.Ming 7798.
Cui, Y. X., G. W. Xu, C. W. Magill, K. F. SchertzandG. E. Hart, and A. H.Paterson, unpublished results), traits likely
1995 RFLP-based assay of Sorghum bicolor (L.) Moench genetic to have been under strong directional selection during
diversity. Theor. Appl. Genet.90:787–796.
sorghum domestication. Deu, M., D. L. D. Gonzalez, J. C. Glaszmann, I. Degremont, J.
Chantereauet al., 1994 RFLP diversity in cultivated sorghum
Conclusions:On the basis of a survey of almost 30,000
in relation to racial differentiation. Theor. Appl. Genet.88:838– sites throughout the genome of S. bicolor, we find a
844.
frequency of SNPs about one-fourth of that observed in Dje, Y., M. Heuertz, C. LefebvreandX. Vekemans, 2000 Assess-ment of genetic diversity within and among germplasm accessions a comparable sample of maize accessions. There is no
in cultivated sorghum using microsatellite markers. Theor. Appl. evidence of a skew to rare alleles; thus many of these
Genet.100:918–925.
SNPs are found in the frequency range useful for LD Doyle, J. J., andJ. L. Doyle, 1987 A rapid DNA isolation procedure for small amounts of leaf tissue. Phytochem. Bull.19:11–15. mapping and association studies. While the high level
Eyre-Walker, A., R. L. Gaut, H. Hilton, D. L. FeldmanandB. S. of intralocus LD in sorghum may prevent phenotypic
Gaut, 1998 Investigation of the bottleneck leading to the do-differences from being attributed to individual se- mestication of maize. Proc. Natl. Acad. Sci. USA95:4441–4446. Fay, J. C., G. J. WyckoffandC.-I Wu, 2001 Positive and negative quence variants, interlocus LD does not appear to be
selection on the human genome. Genetics158:1227–1234. so high as to reduce the utility of genome scans.
Compar-Gale, M. D., andK. M. Devos, 1998 Plant comparative genetics isons of polymorphism and divergence suggest that both after 10 years. Science282:656–659.
Gaut, B. S., andJ. F. Doebley, 1997 DNA sequence evidence for directional and diversifying selection have played
impor-the segmental allotetraploid origin of maize. Proc. Natl. Acad. tant roles in the evolutionary history of sorghum and
Sci. USA94:6809–6814.
that identification of the targets of that selection may Hill, W. G., 1974 Estimation of linkage disequilibrium in randomly mating populations. Heredity33:229–239.
agro-Hudson, R. R., M. KreitmanandM. Aguade´, 1987 A test of neutral Remington, D. L., J. M. Thornsberry, Y. Matsuoka, L. M. Wilson, S. R. Whittet al., 2001 Structure of linkage disequilibrium and molecular evolution based on nucleotide data. Genetics 116:
153–159. phenotypic associations in the maize genome. Proc. Natl. Acad. Sci. USA98:11479–11484.
Hudson, R. R., M. SlatkinandW. P. Maddison, 1992 Estimation
of levels of gene flow from DNA sequence data. Genetics132: Rooney, W. L., andC. W. Smith, 2000 Techniques for developing new cultivars, pp. 329–347 inSorghum, edited by C. W.Smith
583–589.
Kahler, A. L., C. O. GardnerandR. W. Allard, 1984 Nonrandom and R. A.Frederiksen. John Wiley & Sons, New York.
Rozas, J., andR. Rozas, 1999 DnaSP version 3: an integrated pro-mating in experimental populations of maize Zea-Mays. Crop Sci.
24:350–354. gram for molecular population genetics and molecular evolution analysis. Bioinformatics15:174–175.
Kimber, C., 2000 Origins of domesticated sorghum and its early
diffusion to India and China, pp. 3–98 in Sorghum, edited by Savolainen, O., C. H. Langley, B. P. LazzaroandH. Freville, 2000 Contrasting patterns of nucleotide polymorphism at the C. W.Smithand R. A.Frederiksen. John Wiley & Sons, New
York. alcohol dehydrogenase locus in the outcrossing Arabidopsis lyrata and the selfing Arabidopsis thaliana. Mol. Biol. Evol.17:645–655.
Kondrashov, F. A., I. B. Rogozin, Y. I. WolfandE. V. Koonin,
2002 Selection in the evolution of gene duplications. Genome Schloss, S. J., S. E. Mitchell, G. M. White, R. Kukatla, J. E. Bowers et al., 2002 Characterization of RFLP probe sequences for gene Biol.3:RESEARCH0008.
Liu, F., D. CharlesworthandM. Kreitman, 1999 The effect of discovery and SSR development in Sorghum bicolor (L.) Moench. Theor. Appl. Genet.105:912–920.
mating system differences on nucleotide diversity at the
phospho-glucose isomerase locus in the plant genus Leavenworthia. Genet- Shepard, K. A., andM. D. Purugganan, 2003 Molecular population genetics of the Arabidopsis CLAVATA2 region: the genomic scale ics151:343–357.
Long, A. D., andC. H. Langley, 1999 The power of association of variation and selection in a selfing species. Genetics163:1083– 1095.
studies to detect the contribution of candidate genetic loci to
variation in complex traits. Genome Res.9:720–731. Sunyaev, S. R., W. C. Lathe, III, V. E. RamenskyandP. Bork, 2000 SNP frequencies in human genes: an excess of rare alleles and
McDonald, J. H., andM. Kreitman, 1991 Adaptive protein
evolu-tion at the Adh locus in Drosophila. Nature351:652–654. differing modes of selection. Trends Genet.16:335–337.
Tajima, F., 1989 Statistical method for testing the neutral mutation
Morrell, P. L., K. E. LundyandM. T. Clegg, 2003 Distinct
geo-graphic patterns of genetic diversity are maintained in wild barley hypothesis by DNA polymorphism. Genetics123:585–595.
Tenaillon, M. I., M. C. Sawkins, A. D. Long, R. L. Gaut, J. F.
(Hordeum vulgare ssp. spontaneum) despite migration. Proc.
Natl. Acad. Sci. USA100:10812–10817. Doebleyet al., 2001 Patterns of DNA sequence polymorphism along chromosome 1 of maize (Zea mays ssp. mays L.). Proc.
Nei, M.,1987 Molecular Evolutionary Genetics. Columbia University
Press, New York. Natl. Acad. Sci. USA98:9161–9166.
Vigouroux, Y., M. McMullen, C. T. Hittinger, K. Houchins, L. Nordborg, M., 2000 Linkage disequilibrium, gene trees and selfing:
an ancestral recombination graph with partial self-fertilization. Schulzet al., 2002 Identifying genes of agronomic importance in maize by screening microsatellites for evidence of selection Genetics154:923–929.
Nordborg, M., andP. Donnelly, 1997 The coalescent process with during domestication. Proc. Natl. Acad. Sci. USA99:9650–9655.
Wakeley, J., 1996 The variance of pairwise nucleotide differences selfing. Genetics146:1185–1195.
Nordborg, M., B. B. CharlesworthandD. Charlesworth, 1996 in two populations with migration. Theor. Popul. Biol.49:39–57.
Wakeley, J., andN. Aliacar, 2001 Gene genealogies in a metapopu-Increased levels of polymorphism surrounding selectively
main-tained sites in highly selfing species. Proc. R. Soc. Lond. Ser. B lation. Genetics159:893–905.
Wang, R. L., A. Stec, J. Hey, L. LukensandJ. Doebley, 1999 The Biol. Sci.263:1033–1039.
Nordborg, M., J. O. Borevitz, J. Bergelson, C. C. Berry, J. Chory limits of selection during maize domestication. Nature398:236– 239.
et al., 2002 The extent of linkage disequilibrium in Arabidopsis
thaliana. Nat. Genet.30:190–193. Watterson, G. A., 1975 On the number of segregating sites in genetical models without recombination. Theor. Popul. Biol.7:
Ohta, T., 1993 Pattern of nucleotide substitutions in growth
hor-mone-prolactin gene family: a paradigm for evolution by gene 256–276.
duplication. Genetics134:1271–1276. White, S. E., andJ. F. Doebley, 1999 The molecular evolution of
Ohta, T., 2002 Near-neutrality in evolution of genes and gene regu- terminalear1, a regulatory gene in the genus Zea. Genetics153:
lation. Proc. Natl. Acad. Sci. USA99:16134–16137. 1455–1462.
Paterson, A. H., Y. R. Lin, Z. Li, K. F. Schertz, J. F. Doebleyet al., Whitlock, M. C., andN. H. Barton, 1997 The effective size of a 1995 Convergent domestication of cereal crops by independent subdivided population. Genetics146:427–441.
mutations at corresponding genetic loci. Science269:1714–1718. Wright, S. I., B. LaugaandD. Charlesworth, 2003 Subdivision
Pollak, E., 1987 On the theory of partially inbreeding finite popula- and haplotype structure in natural populations of Arabidopsis tions. I. Partial selfing. Genetics117:353–360. lyrata. Mol. Ecol.12:1247–1263.
Rafalski, A., 2002 Applications of single nucleotide polymorphisms