Push and Pull Based Smart Antenna System
Dighe Sujata Balasaheb
Assistant Professor, Amrutvahini College of Engineering, Electronics Department, Sangamner, India
ABSTRACT: In environments with locality of client demands, the use of multiple directional antennas at the Broadcast Server has been shown to increase performance. In many cases however, such broadcasting systems fail to exploit the full potential of the multiple antennas as they do not take into account the geographical distribution of clients within the coverage area of the system[1]. This system proposes an adaptive smart antenna based wireless push system where the beam width of each smart antenna is altered based on the current placement of clients within the system area. Coupled with a modification of the broadcast schedule, the system significantly increases the performance observed by the system clients. Data broadcasting, which has emerged as an efficient way of information dissemination in wireless networks, can be characterized by locality of client demands. However, depending on the actual placement of clients within the coverage area of the system, there can exist cases where the use of directional antennas of fixed beam width limits the amount of performance improvement over single antenna systems .This is because the coverage area of each such antenna is fixed and does not follow the geographical distribution of clients within the coverage area of the system. When this distribution is not uniform, but rather there exist areas with higher density of client groups, there can exist cases where one or more antennas serve a very small, possibly even zero, number of clients, a fact that leads to underutilization of these antennas and consequently to their small contribution to performance improvement.
KEYWORDS: Multiple Directional Antennas, Smart Antenna System , Communication System, Broadcasting Server
I. INTRODUCTION
Data broadcasting has emerged as an efficient means for the dissemination of information over asymmetric wireless networks [17]. Examples of data broadcasting applications are traffic information, weather information, and news distribution systems. In such applications, client needs for data items are usually overlapping. Consequently, broadcasting stands to be an efficient solution, as the broadcast of a single information item will likely satisfy a (possibly large) number of client requests. Moreover, in many applications, such as weather information and news distribution, the locations of clients determine their demands. Communications asymmetry is due to a number of facts, such as asymmetry in equipment (e.g., lack of client transmission capability and client power limitations), asymmetry in the network system and application asymmetry (e.g., traffic pattern of client–server applications). The goal pursued in most of the proposed data-delivery approaches is twofold: 1) determination of an efficient sequence (broadcast program) for the transmission of the server’s data items in a way that the average response time (overall mean access time among the clients) is minimized and 2) management and operation of client local memory (cache) so that a client’s performance degradation is reduced when mismatches occur between the client’s demand pattern and the server’s program. This paper focuses on the minimization of response time under dynamic and location-dependent client demand patterns.
Existing system:
also we cannot fix a set of clients to it. It has to be noted that such a requirement is nowadays easy to implement by already proposed smart antenna technology, by supporting Space Division Multiple Access (SDMA), a technique that requires from the smart antenna to form a transmission beam able to follow the movement of a specific mobile[3]. The clients are grouped each one located at a different place with members of each group having similar demands, different from those of clients at other groups. The clients are equipped with GPS receivers. Each client acknowledges reception of the item it is waiting for via Code Division Multiple Access (CDMA) [6].
II.RELATEDWORK
A. Push and Pull based systems
Push based system consist of client server and a group of clients. The server broadcast the common information to all the clients present in the system. By using the push based systems all clients presented in the system should receive common information, and should not perform any queries about the information. In these system the server is assumed to have an a priori estimate of the demand per information item and makes item broadcasts according to these estimates[17]. In Pull based system the server only broadcast the information that is demanded by the clients. The server broadcasts [20] information after explicit requests made by the mobile clients via the uplink channel. This approach is able to adapt to dynamic client demand patterns; however, it is inefficient from the point of view of scalability. This is because when the client population becomes too large, the client requests will either collide with each other or saturate the server.
B. Proposed System
Fig.1 Proposed System Block Diagram
Due to some disadvantage over the existing system we propose technique called smart antennas with rescheduling application. A Smart Antenna system combines multiple Antenna element with a signal processing capability to optimize its radiation and or/reception pattern automatically in response to the signal Environment[18]. In this system we are mainly discussing about the multi directional broadcasting this should be done by providing smart antennas [13] at the broadcast server. Each broadcast server consist of a number of smart antennas, it is mainly depends upon the number of clients present in the system. And also we fulfill the client needs according to their requirement. This should be done by using learning automaton tools on the broadcast server [15]. The information is sent by the broadcasting server should be arranged in a specific format. According to the client response it should be rearranged, this should be done by various type scheduling techniques. By using these kinds of techniques we fulfill the client’s requirements and also provide the uniform distribution among all users present in the group[2]. The system consists of three major steps of modulous explaination such as:
several numbers of groups. Broadcasting server uses multiple antennas for transmitting the signals to the clients. According to the number of clients the antennas used on the broadcasting server should be changed [4]. The information sent from the BS to clients as a control packet, each information present in the broadcasting server should be arranged in a specific format according to their characteristics, they are said to be “Broadcasting Schedule”. After the information sent by the broadcasting server it should be accessed by the group of clients, according to their response the broadcasting schedule should be arranged by using the learning automaton tool present in this system[15]. The server is equipped with an S-model learning automaton, which contains the server’s estimate Pi of the demand probability di for each data item i among the set of the items the antenna broadcasts,where N is the number of items in the server’s database. The server estimates the next transmission by using the cost function present in this system. It consists of Vaidya and Hameed [21] which proposes a scheduling algorithm that tries to equalize the space between successive instances of the same item i. According to it, the construction of the broadcast when all users are tuned to the same channel is based on two arguments.
Argument 1: Broadcast schedules with minimum overall mean access time are produced when the intervals between successive instances of the same item are equal.
Argument 2: Under the assumption of equally spaced instances of the same items, the minimum overall mean access time occurs when the server broadcasts an item i with the spacing between consecutive instances of i being proportional to the factor where pi is the demand probability for item i, and li is the item’s length[15]. Thus the broadcast scheduler selects to broadcast item i having the largest value of cost function G. The cost function mainly used to find the next transmission, by comparing the current transmission with the previous transmission.
G(i)=(T-R(i))²Pi/((1+E()/1-E())
In this cost function, T is the current time, R(i) the time when i item was last broadcast, li is the length of item i and E(li) is the probability that an item of length li is erroneously received. For items that haven’t been previously broadcast, R is initialized to -1. If the maximum value of (i) is shared by more than one item, the algorithm selects one of them arbitrarily. Upon the broadcast of item i at time T, (i) is changed so that R(i)=T.
2. Probability Updating Scheme: The learning automaton uses a vector, P(n) {p (n) p (n) p (n)} M , ,..1 2 = which represents the probability distribution for choosing one of the actions M a ,a ,..., a 1 2 at cycle[24].
The core of the operation of the learning automaton is the probability updating algorithm, also known as the reinforcement scheme, which uses the environmental response triggered b (n) by the action i a selected at cycle ‘n’ to update the probability distribution vector ‘p’. After the updating is finished, the automaton selects the action to perform at cycle n+ 1, according to the updated probability distribution vector p(n +1) [5]. After the transmission of item i, the broadcast server awaits for an acknowledging pulse from every client that was waiting item i. The aggregate received pulse power is used at the server to update the automaton. The probability distribution vector p that is maintained by the automaton estimates demand probability di of each information item i. For the next broadcast, the server chooses which item to transmit by using the updated vector p. When the transmission of an item i does not satisfy any waiting client, the probabilities of the items do not change. However, following a transmission that satisfies clients, the probability of item i is increased. The following Linear Reward–Inaction (LR−I )[18] probability updating scheme is employed after the transmission of item I (assuming it is the server’s kth transmission), i.e.,
Pz,j(k+1)-Pz,j(k)-L(1-βz(k))(Pz,j(k)-a), Pz,j(k+1)=Pz,j(k)+L(1-βz(k))(Pz,j(k)-a)
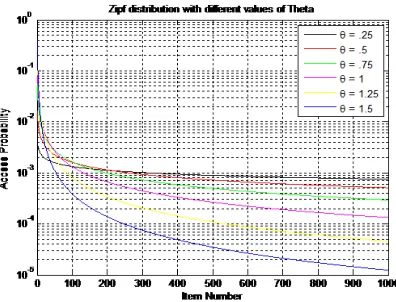
according to a Poisson process with rate , as in [21]. Finally, there do not exist common demands for items between any two clients belonging to different groups. Assume that such a subset comprises Num items. The demand probability di for each item in place i in that subset is computed according to the following Zipf distribution, which deals with data broadcasting as wel l where θ is a parameter named access skew coefficient.
For θ = 0, the Zipf distribution reduces to a uniform distribution of demand for the items in a subset. For large values of
θ, the Zipf distribution produces increasingly skewed demand patterns. The Zipf distribution can thus efficiently model applications that are characterized by a certain amount of commonality in client demands [14].
III.DISTRIBUTION TECHNIQUES USED
Poisson distribution:
In probability theory and statistics, the Poisson distribution is a discrete probability distribution that expresses the probability of a given number of events occurring in a fixed interval of time and/or space if these events occur with a known average rate and independently of the time since the last event. The Poisson distribution can also be used for the number of events in other specified intervals such as distance, area or volume.
Gaussian Distribution:
In probability theory, the normal (or Gaussian) distribution is a continuous probability distribution, defined on the entire real line that has a bell-shaped probability density function, known as the Gaussian function. The normal distribution is considered the most prominent probability distribution in statistics. There are several reasons for this. First, the normal distribution arises from the central limit theorem, which states that under mild conditions, the mean of a large number of random variables independently drawn from the same distribution is distributed approximately normally, irrespective of the form of the original distribution. This gives it exceptionally wide application in, for example, sampling. Secondly, the normal distribution is very tractable analytically, that is, a large number of results involving this distribution can be derived in explicit form. For these reasons, the normal distribution is commonly encountered in practice, and is used throughout statistics, the natural sciences, and the social sciences as a simple model for complex phenomena.
Uniform Distribution:
In probability theory and statistics, the discrete uniform distribution is a probability distribution whereby a finite number of equally spaced values are equally likely to beobserved; every one of n values has equal probability 1/n.
Zipf Distribution:
An empirical law formulated using mathematical statistics refer to the fact that many types of data studied in the physical and social sciences can be approximated with a zipfian distribution, one of the family related to the discrete power law probability distributions. It is observed by plotting the data on a log-log graph, with the axes being log (rank order) and log (frequency).It is also possible to plot reciprocal against frequency or reciprocal frequency or interword interval against rank. The data conform to zipf’s law to the extent that the plot is linear.
IV.EXPERIMENTAL RESULTS
Assume that each such subset comprises items. The demand probability for each item in place in that subset is computed according to the Zipf distribution.
Where, ∈ [1.. ].
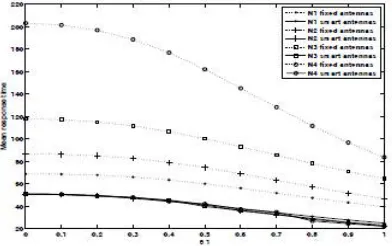
meaning that the majority of clients in the system will belong to a small number of certain client groups. For a total of groups, the total number of the data items in the BS is equal to ∗ . In these results the smart antenna system is compared to the directional antenna system of [11] which uses antennas of the same fixed beamwidth covering the entire area around the BS [11] also employs a LA per antenna for estimating the data item demand probabilities. The comparison is made in terms of mean response time (in item transmission times) versus group size skew coefficient 1. Mean response time is the mean amount of time units that a client has to wait until it receives a desired information item.
Fig. 1. The mean response time versus group size skew coefficient 1 in networks 1, 2, 3, 4 using four antennas.
Figure 1 compares the mean response time of the proposed smart system against the system of [11] in an environment. We consider a coverage area divided into 4 quadrants. We study four network configurations, 1, 2, 3 and 4, in which the groups of clients are positioned randomly at the 1 to 4 ℎ, 1 to 3 , 1 to 2 and exclusively in the 1 quadrant respectively. Thus, in 2, 3 and 4 the clients are not spread across all the quadrants and therefore there exist empty quadrants. Figure 2 shows that the mean response time of the proposed smart antenna-based system is significantly lower than that of [11]. This is due to the fact that the proposed system adjusts its beamwidth so as to efficiently assign the client groups to its antennas. It is worth mentioning the performance difference is increased in networks where the clients are located in fewer quadrants, as in such cases antennas in the system of [11] remain unused. It is also noticeable that while the performance of the system [12] is affected by the geographic distribution of the groups (it exhibits different mean response time for networks 1, 2,3 and 4), the proposed scheme has the same performance, despite differences in client placement. This is due to the fact that the ability for beamwidth alteration of the antennas enables the proposed system to assign a similar number of clients to each antenna and thus yield the same performance despite differences in client placement. In order to study cases where the item demands of the clients follow a different pattern, we also included results where the item demand probabilities are produced according to a uniform, Poisson and Gaussian distribution. Thus, Figure 2 shows the mean response time versus group size skew coefficient 1 when employing the above-mentioned probability distributions for producing the client item demands in network 2. It can be observed that the performance superiority of the proposed system is again confirmed.
To study the effect on system performance of clients that are moving around at high speeds, Figure 3 compares the proposed approach to that of [11], under the assumption that 10% of the population of each group of clients migrates to a new position in networks 1, 2, 3, 4 using four antennas. Thus the moving users are moving at a relatively high speed compared to the rate of antenna adjustment.
Fig. 3. The mean response time when 10% of the population of each group of clients migrates to a new position every 100 item broadcasts in networks 1, 2, 3, 4 using four antennas.
We have to check the transmission for individual clients, So that we can calculate the performance of the entire system. After that we have to change the number of clients present in that particular antenna. So after finding the results we are checking the zipf distribution for corresponding group size coefficient
Fig.4 Zipf Distribution with different valuesof Theta
Fig.5 Mean Response time versus in mobile networks with different no. of clients
V.CONCLUSION
This system proposed an adaptive smart antenna-based wireless push system where the beam width of each smart antenna is altered based on the current placement of clients within the system. After the antenna assignment procedure, each antenna excludes from its broadcast schedule the information items that refer to geographic areas that are out of its coverage. In a few locations, Smart Antennas may be unable to automatically optimize the signal. Smart Antenna systems are used capture, convert and modulate analog signals for transmission as digital signals and reconvert them to analog information on the other end. In adaptive antenna systems, this fundamental signal-processing capability is augmented by advanced techniques (algorithms) that are applied to control operation in the presence of complicated combinations of operating conditions. It helps in achieving equal performance on uplink and downlink as well as real-time calibration of the receiver and transmitter chains. Simulation results reveal that the above-mentioned properties of the proposed system provide a significant performance increase [11] over the system of that utilizes multiple antennas of fixed beam width.
REFERENCES
[1] C. Liaskos, S. Petridou, and G. Papadimitriou, “Towards realizable, low cost broadcast systems for dynamic environments,” IEEE Trans. Netw., vol. 19, no. 2, pp. 383–392, Apr. 2011.
[2] P. Nicopolitidis, G. I. Papadimitiou, P. G. Sarigiannidis, M. S. Obaidat, and A. S. Pomportsis, “Adaptive wireless networks using learning automata,”IEEE Wireless Commun. Mag., vol. 18, no. 2, pp. 75–81,Apr. 2011.
[3] A. B. Waluyo, W.Rahayu, D. Taniar, and B. Scrinivasan, “A novel structure and access mechanism for mobile data broadcast in digital ecosystems,” IEEE Trans. Industrial Electron., vol. 58, no. 6, pp. 2173–2182, June 2011.
[4] C. Liaskos, S. Petridou, G. I. Papadimitriou, P. Nicopolitidis and A. S. Pomportsis, “On the analytical performance optimization of wireless data broadcasting,” IEEE Trans. Veh. Technol., vol. 59, no. 2, pp. 884– 895, Feb. 2010.
[5] P. Nicopolitidis, G. I. Papadimitiou, and A. S. Pomportsis, “Adaptive data broadcasting in underwater wireless networks,” IEEE J. Oceanic Eng., vol. 35, no. 3, pp. 623–634, July 2010.
[6] Y. De-Nian and C. Ming-Syan, “Data broadcast with adaptive network coding in heterogeneous wireless networks,” IEEE Trans. Mobile Comput., vol. 8, no. 1, pp. 109–125, Jan. 2009
[7] I. Stojanovic, W. Zeyu, M. Sharif, and D. Starobinski, “Data dissemination in wireless broadcast channels: network coding versus cooperation,”IEEE Trans. Wireless Commun., vol. 8, no. 4, pp. 1726–1732, Apr. 2009s
[8] P. Nicopolitidis, G. I. Papadimitiou, and A. S. Pomportsis, “Continuous flow wireless data broadcasting for high-speed environments,” IEEE Trans. Broadcast., vol. 55, no. 2, pp. 260–269, June 2009.
[9] V. L. Kakali, G. I. Papadimitriou, P. Nicopolitidis, and A. S. Pomportsis,“A new class of wireless push systems,” IEEE Trans. Veh. Technol., vol. 58, no. 8, pp. 4529–4539, Oct. 2009.
[10] C. Liaskos, S. Petridou, G. I. Papadimitriou, P. Nicopolitidis, M S. Obaidat, and A. S. Pomportsis, “Clustering-driven wireless data broadcasting,” IEEE Wireless Commun. Mag., vol. 16, no. 6, pp. 80–87, Dec. 2009.
[12] C. A. Balanis and P. I. Ioannides, Introduction to Smart Antennas.Morgan & Claypool Publishers, 2007.
[13] P. Nicopolitidis, G. I. Papadimitriou, and A. S. Pomportsis, “Exploiting locality of demand to improve the performance of wireless data broadcasting,”IEEE Trans. Veh. Technol., vol. 55, no. 4, pp. 1347–1361, July 2006.
[14] M. A. L. Thathachar and P. S. Sastry, Networks of Learning Automata,Techniques for Online Stochastic Optimization. Kluwer Academic Publishers,2004.
[15] P. Nicopolitidis, G. I. Papadimitriou, and A. S. Pomportsis, “Learningautomata-based polling protocols for wireless LANs,” IEEE Trans.Commun., vol. 51, no. 3, pp. 453–463, Mar. 2003.
[16] P. Nicopolitidis,M. S. Obaidat, G. I. Papadimitriou, and A. S. Pomportsis, Wireless Networks. Hoboken, NJ: Wiley, 2003.
[17] P. Nicopolitidis, G. I. Papadimitriou, and A. S. Pompotsis, “Using learning automata for adaptive push-based data broadcasting in asymmetric wireless environments,” IEEE Trans. Veh. Technol., vol. 51, no. 6, pp. 1652–1660, Nov. 2002.
[18] P. H. Lehne and M. Pettersen, “An overview of smart antenna technology for mobile communication systems,” IEEE Commun. Surveys &Tutorials, Fourth Quarter 1999, vol. 2, no. 4.
[19] D. Aksou and M. Franklin, “RxW: A scheduling approach for large scale on-demand data broadcast,” ACM/IEEE Trans. Netw., vol. 7, no. 6, pp. 846–860, Dec. 1999