Human capital, innovation and technology
diffusion
George Messinis
Centre for Strategic Economic Studies, Victoria University
Abdullahi Ahmed
Centre for Strategic Economic Studies, Victoria Universit
Working Paper No. 43
Centre for Strategic Economic Studies Victoria University
Melbourne
March 2009
PO Box 14428
Melbourne VIC 8001 Australia Telephone +613 9919 1340 Fax +613 9919 1350
Human capital, innovation and technology diffusion
1George Messinis
†and Abdullahi D. Ahmed
Centre for Strategic Economic Studies, Victoria University, Australia
Abstract
This paper develops a new latent index of human capital identified as valuable skills for seventy countries for the period 1970-2003. The index is compared to existing measures of human capital in assessing the Benhabib and Spiegel (2005) model of logistic technology diffusion. The study undertakes extensive sensitivity analysis and accounts for alternative production functions, capital-skill complementarity (CSC), skill-unskilled labour complementarity (CNC), and skill-biased-technical-change (SBTC). The evidence shows that (i) the new index outperforms existing indicators; (ii) the index also facilitates innovation and technology diffusion, and is consistent with the theoretical model; (iii) the valuable skills-education gap has widened in Africa and advanced OECD countries, and (iv) the CSC, SNC and SBTC hypotheses are confirmed but the effects are nonlinear.
Keywords: Education; Skills; Human capital; Growth; Innovation; Technology
diffusion; CSC; SBTC
JEL Classification: J24, O10, O30, O40,
1 We are grateful for valuable comments provided by the editor, two anonymous referees,
and participants at the 2nd International Conference on Educational Economics, in Athens,
September 2008, as well as at a University of Queensland seminar in October 2008. Any remaining errors are our responsibility.
1.
Introduction
Since Schultz (1961), Becker (1964) and Romer (1990), human capital2 is
considered to be the engine of economic growth.3 Several hypotheses have been
proposed to explain why human capital is important but Nelson (2005) has condensed these into two schools of thought: accumulation theories and assimilation theories. The first envisage a direct effect of human capital on labour productivity as an explicit factor of production embodied in effective labour. This approach leads to the
prediction that it is new investment in human capital that matters for economic growth. In contrast, the second school of thought explores the relation between the level of human capital and total factor productivity growth or technological change; the emphasis here is on the link between human capital and disembodied knowledge as manifested in technology. The former school highlights the role of human capital accumulation when it is the stock of human capital that is important in the latter; what Dowrick (2003) calls growtheffects and level effects respectively.
The second school of thought has emerged as a synthesis of two ideas. One is that technical progress can be understood as a process of new product development, and thus, greater understanding of the role knowledge and skills play can shed light on the process of technology growth. This draws on earlier insights on the link between R&D, innovation and market value in Schumpeter (1934) and Griliches (1981) and is central in first generation models of endogeneous growth where human capital is the engine of innovation and sustainable growth (Romer 1990; Aghion and Howitt 1998). The second idea highlights the importance of knowledge externalities as the source of spillovers from technology leaders to less developed countries. However, the adoption of foreign technology depends on the ‘absorptive capacity’ or ‘social capability’ of the imitator (Wolff 2001; Falvey, Foster and Greenaway 2007). Here, human capital is a key determinant of absorptive capacity since it enables workers to understand and assimilate new technology; a particular formulation of the convergence process whereby less developed economies catch-up with the developed
2 As a concept, human capital has been defined as the ‘knowledge, skills, competencies and
other attributes’ that are relevant to economic activity (OECD 1998).
3 See Aghion and Howitt (1998), Barro (2002), Hanushek and Wößmann (2007), Ehrlich
world.4 The idea originates in Nelson and Phelps (1966) who assessed education to be
a catalyst in the diffusion of new technologies. Their model rests on two key assumptions: the further an economy is from the technology frontier, the stronger is the incentive to exploit externalities; and the bigger the human capital the greater is the capability to learn and adopt the new technology.
Benhabib and Spiegel (1994) integrate the two ideas in a generalised model of human capital that aims to explain both innovation and technology diffusion. They build on the intuition that the two views of human capital are complementary rather than competing, for they explain different stages of economic development; i.e., nations closer to the technology frontier have accumulated high levels of human capital that could support innovation while countries far from the frontier focus on technology diffusion.5
Although intuitively appealing, the original Nelson-Phelps hypothesis, suggests that the imitation of foreign technology is always beneficial provided that educated workers ‘follow and understand new technological developments’ (Nelson and Phelps 1966, p.69). Moreover, the hypothesis implies that a backward economy could overtake the technology leader by simply relying on investment in human capital.6 As
discussed in Benhabib and Spiegel (2005), this seems to ignore obstacles to free-riding and limits to imitation. In particular, they contradict Schumpeter (1934) and current economic intuition that emphasise the role of intellectual property rights and innovation as a credible path to competitive advantage. This limitation also applies to Benhabib and Spiegel (1994) whose particular model also suggests that imitation can even dominate the benefits of innovation the further the country is from the frontier.
New evidence on the world distribution of income motivated further work in the assimilationist research program. First, the facts confirmed the view that, rather than factor accumulation, it is the Solow ‘residual’ or total factor productivity (hereafter TFP) that explained most of the cross-country differences in growth rates. Second, per capita incomes for a number of countries seemed to diverge rather than converge.7
Third, substantial investment in education failed to protect less developed countries
4 The literature of ‘international spillovers’ have also considered FDI and trade as channels
of knowledge transfer (Coe and Helpman 1995 and Acharya and Keller 2007).
5 This has been empirically confirmed by Vandenbussche, Aghion and Meghir (2006). 6 This problem persists in other studies of the Nelson-Phelps hypothesis that replace the
concept of ‘theoretical level of technology’ (i.e., exogenously determined frontier technology) with that of technology in the leading country. An example is Dowrick and Rogers (2002).
(LDCs) from stagnation (Pritchett 2001). In order to account for inconsistencies between theory and facts, Benhabib and Spiegel (2005) have revisited Benhabib and Spiegel (1994) to further extend the Nelson-Phelps hypothesis.8 They consider a
logistic diffusion process that acknowledges impediments to imitation and allows for divergence in world income. In their empirical application of their model, they find that logistic diffusion better explains world income growth patterns. Further, they are able to identify a number of countries that have been at risk of falling into poverty traps but this number appears to have diminished over time.
This paper contributes to the empirical literature of technology diffusion on three levels. First, it extends the approach of Dagum and Slottje (2000) to address the issue of unobservable human capital. It utilises data on international test scores (TIMSS), scientific research output, book production, and capital equipment to obtain a new multi-dimensional index of human capital as a latent factor closely identified as ‘valuable cognitive skills’. This approach rests on three insights: (a) human capital is too rich to be captured by a single variable such as years of education (Le, Gibson and Oxley 2003; Dagum and Slottje 2000); (b) rather than skills, it is the value of skills
that counts in economics (Schultz 1961: Becker 1964; Nelson 2005), and (c) given the scarcity of valid instruments,9 the unobserved latent factor approach provides a
solution to the endogeneity and measurement error problems (Heckman, Stixrud and Urzua 2006; Flossmann, Piatek and Wichert 2006).
Second, the paper deals with model uncertainty following Durlauf, Johnson and Temple (2005). It explores two types of model uncertainty: specification, and production technology.10 On the first, we examine three specifications of technology
diffusion: Benhabib and Spiegel’s (1994) exponential diffusion; Dowrick and Rogers’ (2002) exponential diffusion with conditional convergence, and Benhabib and Spiegel’s (2005) logistic diffusion. Further, we test the performance of the new index against three alternative measures of human capital in the logistic diffusion model of Benhabib and Spiegel (2005). In addition, we conduct exhaustive sensitivity analysis to test the robustness of the new latent index with respect to assumptions regarding (a) the indicators used in factor analysis; (b) the technology leader; (c) the number of lags
8 An alternative account of economic stagnation is Acemoglu, Aghion and Zilibotti (2002). 9 For further discussion of the issue, see Durlauf, Johnson and Temple (2005).
10 By convention, the term ‘production technology’ refers to the form of the production
used as instruments in GMM estimation, and (d) production technology. With regard to the latter, we relax the Benhabib and Spiegel (2005) assumption of a Cobb-Douglas production function to consider two alternative production technologies: the constant-elasticity of substitution (CES) production function of Duffy, Papageorgiou and Perez-Sebastian (2004), and the translog production function of Papageorgiou and Chmeralova (2005). This is motivated by the proliferation of the literature on capital-skill complementarity (CSC) and capital-skill-biased-technical-change (SBTC) where the latter is a more flexible approach that facilitates the differentiation between CSC and skill-biased-technology-change (SBTC). Note, however, that the principal objective here is to examine the robustness of Benhabib and Spiegel’s (2005) logistic model within the framework of CES and translog production technologies.
In a third contribution to the literature, the paper extends the Benhabib and Spiegel (2005) model of logistic diffusion by employing dynamic panel data econometrics for two main reasons. For one, it seems intuitive to utilise available information on the time-series data generating processes of key variables explaining economic growth as a dynamic relation. Second, panel data estimation techniques are advantageous in finite cross-sectional data when complemented with a methodology that minimises some of the limitations11 associated with reverse causality, measurement errors and
heterogeneity. This paper acknowledges that model heterogeneity may also arise in the technology diffusion process.
The rest of the paper is structured as follows. Section two traces the evolution of technology diffusion theory and outlines three key models. Section three estimates two alternative human capital indices as latent unobserved factors. Section four presents comparative dynamic panel data estimation results for four alternative measures of human capital in the logistic diffusion model of Benhabib and Spiegel (2005). Section five conducts sensitivity analysis to go beyond the Cobb-Douglas production function and consider CES and translog production technologies. Section six summarises the new evidence and concludes.
2.
Knowledge Diffusion: Three Models
In general, assimilation theories of human capital and growth define output, Y, to be of the general functional form: Y j t, F (A j t, (H j t, ), X1 ,j t, ..., X n j t, )where Yj, t is per capita output in country j in period t, A represents technology being a
function of human capital, H, and X1, …, Xn are n factors of production.
Below, we outline three models of technology diffusion as first proposed. For brevity, we drop the country indicator that is implicit. All three models assumed a Cobb-Douglas production function. We begin with the Benhabib and Spiegel (1994) model with the production function:
0
t t t t
Y A K L (1)
where A0, K, L and represent initial technology, physical capital, labour and an
error term respectively. Technology interacts with human capital implying that technical change cannot be seen independently of human capital (i.e., the idea of human capital being the ‘engine of growth’ in new growth theories). Combining the role of human capital and technological development – where a country’s level of human capital enhances absorption of its own and foreign technology – in an endogenous growth framework, Benhabib and Spiegel (1994) specify technological
progress, a, as:
max max
( )
t t t
t t t t t t
t t
A A A
a gh mh g m h mh
A A
(2)
Here, ht is the natural logarithm of Ht, and g, m >0.12 In this equation, the first term
represents domestic innovation and the second term is the Nelson and Phelps (1966) idea of technological diffusion being the product of a country’s level of human capital (i.e., absorptive capacity) and the gap between the technological level of a leading
12 Benhabib and Spiegel (1994) specify
Ht instead of ht and then equate Ht with educational
country,Atmax, and that of the home country, At, (this gap is also known as ‘distance
to the frontier’). Benhabib and Spiegel (1994) take the log difference of (1) and substitute for (2) to arrive at the growth equation:
max
( ) ( )
c k
t t t t t t t t
y
l g m h mh A A u (3)
where yt, kt and lt are Yt, Kt and Lt in logs respectively. Equation (3) predicts that,
in addition to growth in physical capital and labour, k and l, economic growth will also depend on the stock of human capital and the distance to the frontier; ut is a
serially correlated error term. Note, technology diffusion is an exponential process; i.e., countries further away from the frontier catch-up faster than those closer, and any country in some distance from the frontier could specialise in imitation without any R&D effort (Jones 2008). Further, the model also implies that imitation could be more beneficial than innovation for countries closer to the frontier, as long as the distance to the frontier is greater than (g-m)/m.
In a second model, Dowrick and Rogers (2002) propose a hybrid model that is different to Benhabib and Spiegel (1994) in three ways. First, it accounts for growth effects by allowing human capital to enter as a direct factor of production. Second, although it maintains Nelson and Phelps’ (1966) original idea of diffusion, it does not admit a human capital effect in local innovation. Third, it controls for neoclassical convergence; that is, initial per worker output, Y0, enters as an independent factor.
More formally, their empirical specification is of the type:
0 max
ln( )Y ln( ) k
t t t t t t t
y mh A A
h u (4)
Dowrick and Rogers (2002) define yt as the growth rate of real GDP per worker.
The first two terms in (4) represent a hybrid model of technological catch-up: neoclassical convergence to the steady state of y, and technology diffusion. These
sources compare with (2) in Benhabib and Spiegel (1994) who focus on endogeneous catch-up; i.e., domestic innovation and technology diffusion.
role in domestic innovation and to acknowledge the potential for poverty traps due to barriers to assimilation of foreign technology. Logistic diffusion again emphasises the interaction of human capital and the technology gap except that the rate of adoption of foreign technology is further moderated by the inverse of the distance to the frontier13
due to technology clusters or an incompatibility with domestic technology or social values (Rogers 2005). More formerly, logistic diffusion takes the following form14:
max
max ( ) max
t t t t
t t t t t t
t t t
A A A A
a gh mh g m h mh e
A A A
(5)
Compared to the exponential model in (2), diffusion in (5) is moderated by the inverse of the distance to the frontier, henceforth ‘backwardness’, (A/Amax). As a result, the innovation effect of human capital is larger and the catch-up process is slower when the country is very far or very close to the frontier.
3.
Human Capital as Valuable Skills: A New Index
Background
Benhabib and Spiegel (2005, 1994) and Dowrick and Rogers (2002) abstract from measurement issues and utilise quantitative measures of human capital; educational attainment and school enrolments respectively. However, these uni-dimensional measures are highly problematic in international panel data studies for several reasons.15 First, they are poor indicators of education quality. Second, they ignore
factors other than formal education that impact on skill formation. Also, they often
13 All three theoretical models take the USA to be the technology leader. We follow suit but
all results are robust to the alternative of the data determining the leader (see section 4 below).
14 max
( ) ( / )s
t t t t c c
a g h h A A s s
is the more generalised model proposed by Benhabib and
Spiegel (2005). It nests two limiting cases: the exponential diffusion model of Benhabib and Spiegel (1994) when s=-1, and the logistic model when and s=1. On the basis of the evidence in Benhabib and Spiegel (2005), this study considers only these two scenarios.
15 For a review of measurement errors in the estimation of educational attainment, see
evolve in correlation with other macroeconomic variables that introduces endogeneity or reverse causality biases in estimation. Last but not least important, they fail to measure the value of education.16
Towards a multi-faceted measure of human capital, Hanushek and Kimko (2000) introduce school quality indicators in growth equations, as complementary to quantity measures. They find that international test scores of student achievement in mathematics and science are significant predictors of growth. Coulombe, Tremblay, and Marchand (2004) and Hanushek and Wößmann (2007) have confirmed the link between test scores and economic performance. According to Hanushek and Wößmann (2007), the cognitive skills deficit is greater in developing countries and quality indicators are less susceptible to estimation problems such as endogeneity, although recent evidence suggests that selection and endogeneity biases remain (Glewwe 2002; Galiani and Schargrodsky 2002; Paxson and Schady 2007).17
The search for improved multi-dimensional measures of human capital has moved to new directions. One involves the relaxation of the Nelson and Phelps (1966) assumption of education as the means to understanding and adopting new technologies. Thus, several papers explore the role of skill decomposition where primary or secondary education is more suitable for adoption and higher education is more appropriate for innovation (Acemoglu, Aghion and Zilibotti 2002; Ciccone and Papaioannou 2005; Vandenbussche, Aghion and Meghir 2006).18 Jones and Schneider
(2006) and Jones (2008), on the other hand, propose IQ test scores as a better measure of cognitive skills and abilities.
An alternative methodology invokes the Mincerian approach to human capital and seeks to decipher key insights.19 So far, the literature has highlighted two principal
ideas. One is that human capital is a composite index of skills acquired at school and skills learnt at work. Moreover, it is the current market value of these skills that counts as human capital. Although this micro approach focuses on private returns to
16 These problems have been well documented in Bils and Klenow (2000), Wößmann
(2003), Le, Gibson and Oxley (2003), Abowd et al. (2005).
17 Lévy-Garboua et al. (2004) challenge the idea that test scores are good indicators of human
capital. They call for a return to the notion of ‘market value of school outputs’.
18 Hanushek and Wößmann (2007) and the skill decomposition approach are two
alternative interpretations of why higher education failed to translate into growth in LDCs (Pritchett 2001).
19 This is the approach adopted in Krueger and Lindahl (2001) and Abowd
et al. (2005).
education, the general methodology is employed here at the macro-level to account for both the quality and value of human capital.
Aristotle (1976), Dewey (1916) and Bourdieu (1977) all emphasised the view that knowledge is a social product generated within contexts of experience. More recent developments in biology, sociology and anthropology closely associate knowledge with ‘evolving skills’ being generated in the process of people’s engagement in the ordinary business of life (Ingold 2000). The discrepancy between education and knowledge has been emphasised in various forms and fields. One expression is Sen’s (1997) distinction between ‘human capital’ and ‘human capability’ where the latter emphasises ‘functionings’ (i.e., outcomes and achievements) that enable individuals to participate in current markets and adapt to change (Lanzi 2007). Another expression is the ‘knowing-doing gap’ that Joss (2001) describes as the ‘ability to implement what is known’ and not abstract knowledge. The innovation literature also pays attention to a balance between the ‘body of practice’ and the ‘body of understanding’ as key to explaining knowledge transfer (Nelson 2005). Finally, the gap between schooling and skills is implicit in the emerging literature of job training and workplace learning (Borghans and Heijke 2005; Nordman and Wolff 2007; Destre, Levy-Garboua and Solloboub 2008; Robst 2007).
An early but brief observation of the skills deficit in developing countries was by Tsoukalas (1976). His data clearly show that less developed South European countries in 1960 had markedly lower rates of tertiary student enrolments in applied sciences and technology than the more advanced OECD economies.
A New Human Capital Index
latent factor estimation approach as an effective strategy in dealing with biases associated with measurement errors and endogeneity.20
We maintain that the approach is particularly suitable for the task of integrating the education quality literature and the market value perspective of human capital. The debate about quality vs. value is equivalent to the search for a measure of patent quality in the innovation literature. Lanjouw and Schankerman (2004) settle the issue with a composite index of patent quality that measure both ‘the technological and value dimensions of an innovation’. We adapt the Lanjouw and Schankerman (2004) approach to associate ‘quality of education’ with ‘valuable skills’ in order to highlight the importance of both ‘cognitive skills’ and the market ‘value’ of education.
In particular, we adapt Hanushek and Kimko (2000), and Dagum and Slottje (2000) to obtain new estimates of human capital as a latent factor identifiable as ‘valuable cognitive skills. Hanushek and Kimko (2000) utilise international test scores in maths and science (TIMSS) to impute cross-section measures of cognitive skills from regressions, assuming that quality of schooling evolves slowly over time. Dagum and Slottje (2000) on the other hand estimate human capital as a latent variable using indicators available in household survey data. Unfortunately, none of these indicators are direct measures of intelligence or education quality (Le, Gibson and Oxley 2003, p.293).
We employ a multiple-indicator model with one latent common factor:
, S ,
k jt k k jt k jt
I h e (6)
Ik,jt is the log of indicator k=1,…,n of country j at time t, h
S is the common factor,
k is the factor loading, and ek is an idiosyncratic error term. The common factor is the
unobserved characteristic of education quality that drives the n indicators. In search
for appropriate indicators, we seek to include variables that measure cognitive skills as well as the economic value of skills. Thus, we select the following variables: TIMSS test scores lagged two periods (TSt-2), per capital scientific publications in
science (SciP), per capita book publications in the field of pure and applied science (BKS), per capita capital equipment (Ke), and per capita manufactured exports (Xm);
20 See, for instance, Temple (1999), Durlauf, Johnson and Temple (2005), and Heckman,
for full details on the sources and definitions of all variables used in this study, see Appendix A. The use of TIMSS as a proxy for cognitive skills has been established in the literature cited earlier. Yet, TIMSS scores measure skills by pupils in low secondary schools and would not necessarily summarise the skills of the labour force. Thus, we use estimates of TIMSS two 5-year periods earlier. It also seems intuitive that our bibliometrics measure, SciP, would reflect the quality of human capital. Gault (2005) argues that the process of knowledge creation - closely interlinked with technological progress - by academic scientist can be measured by academic publications. In a historical study of early modern Europe, Baten and van Zanden (2008) have proposed that book production is a powerful proxy for human capital since it summarises both literacy skills and economic demand for books. In this study,
we have utilised UNESCO data on non-periodical printed publications (BOOKS). However, we have only accounted for books in the fields of pure and applied sciences in an attempt to measure technical skills that are more comparable to the TIMSS and SciP series. The choice of capital equipment is based on evidence showing that equipment capital complements human capital (Dulleck and Foster 2008) and relates to the wage premium of skilled labour (Karnit and Hercowitz 2000). Finally, the literature suggests that manufactured exports associate with ‘skills and know-how’.21
Hence, we expect that TSt-2, SciP and BKS contain information on cognitive skills
while BKS, Ke and Xm contribute to the estimation of an unobservable measure of the economic value of skills. In factor analysis, if a single common factor exists that drives all five indicators (i.e., they all correlate highly with the single hidden factor), that factor must be an index of both cognitive skills and economic value.
Note, however, missing observations is a major limitation of existing data on TSt-2
and, to a less extend BKS.22 We overcome this problem by following Hanushek and
Kimko (2000) who impute test scores. Here, we impute TSt-2 by splicing two sets of
imputed TIMSSt (in logs). The first is the expected value of TIMSSt with respect to a
contemporaneous information set It, Et[TIMSSt | It], where Et is an expectations
operator. The second is the expected value of TIMSSt with respect to the information
21 Kaldor (1962, p.495) but also see Fryges and Wagner (2007).
22 TIMSS data for pupils aged 13-14 years old in maths and/or science are available for 16
set at time t+2, Et+2[TIMSSt | It+2]. We splice the two series at period three (i.e.,
1980-84) and construct the composite series TSt-2 that equals Et+2[TIMSSt | It+2] in the first
two periods (i.e., 1970-79) and Et-2[TIMSSt-2 | It-2] (i.e., TIMSS lagged twice) in all
other periods (i.e., 1980-2003). We consider the following variables in logs: secondary (SECO) and higher education (HIGH) attainment rates, average years of education (EDU), infant mortality rate (MoR), labour participation rate (LPR). The education variables are intended to capture the effect of parental and public education on student test performance. Infant mortality rates are used on the basis of a close association between mortality and education quality (Jamison, Jamison and Hanushek (2007). Fortson (2008) also shows that mortality risk reduces the returns to education due to life uncertainty and thus, serves as a disincentive to investing in skills. Labour market participation also seems relevant for it provides extra information on the capacity of adults to apply their skills and, thus, contribute in the acquisition of cognitive skills by young students participating in TIMSS tests.
In addition, we use two indicator variables. ‘D_miss’ takes the value of one if three missing values of TIMSS are observed during the period 1980-1994 and zero otherwise. This is in order to control for unobservable factors that have impinged on the stock of human capital, such as famine or epidemics. ‘D_East_Euro’ is a regional dummy variable that controls for the absence of market signals in East European socialist economies (Russia, Romania, Bulgaria, Slovakia, Poland and Hungary). Note, we have also considered per capita income as a predictor of TIMMS scores but it was not statistically significant.
Columns 1-2 in Table 1 present panel feasible GLS estimation results that are robust to heteroskedasticity in the errors. These suggest that young students perform better in TIMSS tests when a higher proportion of the general population has attained secondary and post-secondary education. Students also benefit from greater labour force participation. However, higher infant mortality or more years of education have an adverse effect on student performance. The former seems intuitive while the latter may be due to a trade off between quantity and quality of education. The results also confirm the suspicion that missing values associate with a deficit in human capital while pupils in transitional economies as a group seem to have performed better than students in other countries.
In column three of Table 1, we also impute BOOKS by utilising extra information. We, thus, include the log of per capital scientific publications in science (SciP) and a new series that measures the number of years at war due to an armed conflict (WAR); see Appendix A for more details. The results show that armed conflict and higher mortality rates impact adversely on the production of new books in science. Scientific publications, on the other hand, stimulate the production of new books as it would be expected given that BOOKS and SciP are complements.
Next, the coefficient estimates in Table 1 are used to impute TIMSS and BOOKS and construct TSt-2 and BKS respectively for all countries. These imputed series are
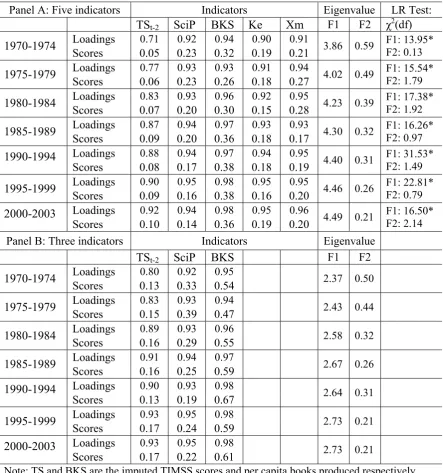
subsequently used together with SciP, Ke, and Xm to conduct principal component factor analysis. We allow for the possibility that these five indicators might associate with two latent factors. The results appear in panel A, Table 2 and can be summarised as follows. First, both the eigenvalues and Likelihood Ratio (LR) tests indicate that there exists a single factor.23 Second, the factor loadings (i.e., the correlations between the indicator and the factor; assuming a single factor) are quite high and increase over time. Third, the estimated factor ‘scores’ suggest that books (BKS) weighs by far as the most important indicator. Fourth, the cumulative weight of TSt-2 and SciP
decreased from 28% in 1970-74 to 24% in 2000-03. In contrast, the score for the BKS series increased from 32% to 36% in the corresponding periods. Given that BKS measures both skills and value, we interpret the above as evidence of the increasing importance of economic value of skills. We conclude that there exists a single latent index that we call ‘valuable skills’, VS, and is the weighted sum of the five indicators with the ‘scores’ as the weights.
- Table 2 about here -
The new index can be seen as a human capital estimate with measurement errors. Although the index is not directly comparable to existing quantity or quality measures of education, we follow the literature convention and examine the reliability of the new measure in a horse race with the following alternatives: years of education (EDU); the original series for TIMSS; the imputed TSt-2; and the IQ series of Lynn
23 That is, only the eigenvalue of factor 1 is greater than 1, and the LR test cannot reject the
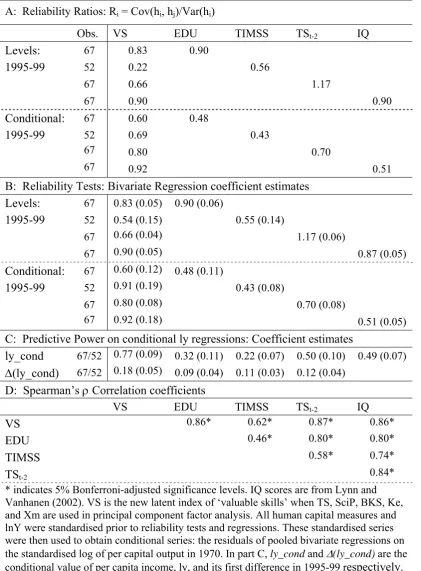
and Vanhanen (2002). First, in Table 3, we present reliability ratios. These ratios measure the relative co-movement of two alternative estimates, hi and hj, of an
unobservable series, h. The reliability ratio is their covariance Cov(hi, hj) divided by
the variance of the measure in question, Var(hi) (Cohen and Soto 2007). In part A of
Table 3, we present reliability ratios for the five (standardised) measures in both levels and conditional on the log of per capital real GDP in 1970-73.24 For clarity, the reliability ratio of VS, in comparison to EDU, is 0.83 while that of EDU with respect to VS is 0.90. The new index, VS, seems to be inferior to others in levels data but it records much higher reliability ratios in conditional series. In part B, we emulate Krueger and Lindahl (2001) to present coefficient estimates of the series in bivariate regressions. With the exception of TSt-2, the new index seems to perform as well as
others in levels but, again, it outperforms all alternatives in conditional regressions. In part C, we extend the analysis with bivariate regressions where the dependent variable is the conditional log of per capita real GDP, ly_cond, or its first difference, (ly_cond). This is in order to examine the predictive power of the five measures. The results suggest that the new index has the greatest impact on real GDP and its growth rate. Finally, part D of the table presents Spearman’s correlation coefficients that show that VS correlates highly with EDU, TSt-2 and IQ. Overall, we conclude that the
new latent index of ‘valuable skills’ seems to perform better than existing measures.
- Table 3 about here -
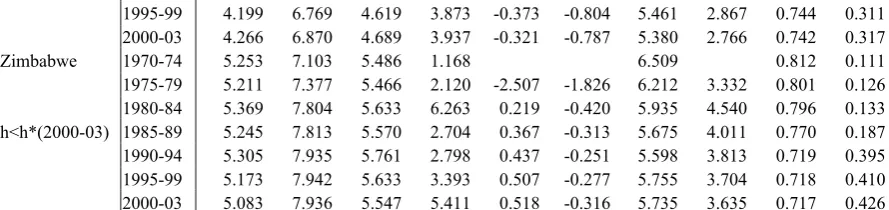
Figure 1 (top panel) compares the time-series pattern of the imputed measure of TIMSS, TSt-2, to that of the new index of ‘valuable skills’, VS,25 for six regional
groups: OECD20 countries, South America, Asia (excluding Japan and South Korea), Africa, transitional economies in Europe and South Europe.26 The results confirm the
24 We use the 1995-99 period since it is the one with the highest number of observations
given that sample size directly associates with greater power in reliability tests (Duane 2007).
25 See Appendix A for details. Note also that, for comparability, all human capital measures
used in this study (i.e., TIMSS, TSt-2, IQ and VS) were rescaled into equivalent years of
education by setting them equal to the predicted value of years of education (EDU) in separate bivariate regressions (ie., robust panel FGLS). Lane (2002) shows that GLS estimation minimises the bias in random variable transformations. Note that the rescaled measures maintain a correlation coefficient of 1 with its corresponding original series.
26 The OECD20 group comprises of Austria, Australia, Belgium, Canada, Denmark,
Hanushek and Wößmann (2007) claim of a skills deficit in developing economies since TSt-2 (the dotted line) is lower in Africa, South America and Asia when
compared to the OECD20 group. In contrast, however, the new index of human capital, VS, indicates that the stock of skills with economic value has declined in Africa and East Europe since the mid 1970s. In OECD20 countries, the index increased during the 1970s and has declined sharply since the early 1990s. In South America, on average, the index recorded a fall in the mid-1980s and a surge in the 1990 to overtake the OECD20 group, though it remains below the average in Asia and South Europe who have witnessed the greatest improvement over the whole period.27
- Figure 1 about here -
The lower panel of Figure 1 depicts scatter plots of equivalent years of education for TIMSS, TSt-2 and VS against average GDP growth rates, all conditional on the log
of real per capital GDP in 1970 as in Hanushek and Wößmann (2007). The charts display a positive relation between skills and GDP growth for all three series, a result consistent with Hanushek and Wößmann (2007). Further, the positive slope of the fitted regression line is higher when the VS index is used when compared to slopes corresponding to TIMSS or TSt-2. This makes intuitive sense since the new index of
education quality or ‘valuable skills’ is the unobserved market value of skills.
Dynamic Panel Data Estimation
In this section, four alternative measures of human capital are utilised to test the logistic diffusion model of Benhabib and Spiegel (2005) in (5). In order to account for non-linear errors and the potential for endogeneity, we employ the System GMM panel
estimator of Arellano and Bover (1995).28 Although lagged variables are not a full
proof strategy to control for endogeneity, we employ lags 2-3 to instrument both the
Zealand, Norway, Sweden, Switzerland, UK and the USA. Italy, Greece, Portugal and Spain form the ‘South Europe’ group.
27 We have also observed that the years of education (EDU) series has surged in most
regions, in sharp contrast to the trends observed in ‘valuable skills’, VS.
28 The ‘xtabond2’ STATA 10 procedure of Roodman (2006) was employed in a two-step
human capital stock, h, and technology diffusion, h(A/Amax), the latter being in view
of Acemoglu, Aghion and Zilibotti (2002).
As a first step, we utilised the new latent index of ‘valuable skills’ in system GMM regressions to estimate the three models of technology diffusion outlined above. For comparison, we expressed the Benhabib and Spiegel (1994) and Dowrick and Rogers (2002) models in terms of a as the dependent variable. Not reported here
due to space considerations, we can show that the results clearly point to the logistic model of diffusion as the model most consistent with the data.29
Below, we focus on the main objective of this paper which is to examine the empirical validity of the Benhabib and Spiegel (2005) model of logistic technology diffusion, and examine the performance of four alternative measures of human capital in explaining logistic technology diffusion. The four measures are: average years of education (EDU); the original TIMSS series (TIMSS); the imputed lagged TIMSS series (TSt-2), and the new latent index of valuable skills, VS. This study utilises Penn
World Tables, World Development Indicators and the Barro and Lee (2001) series of average years of education of the total population aged 25 years and over (EDU) – henceforth BL (2001) - to extend the EDU series to 2000-03 as per Kyriacou (1991).
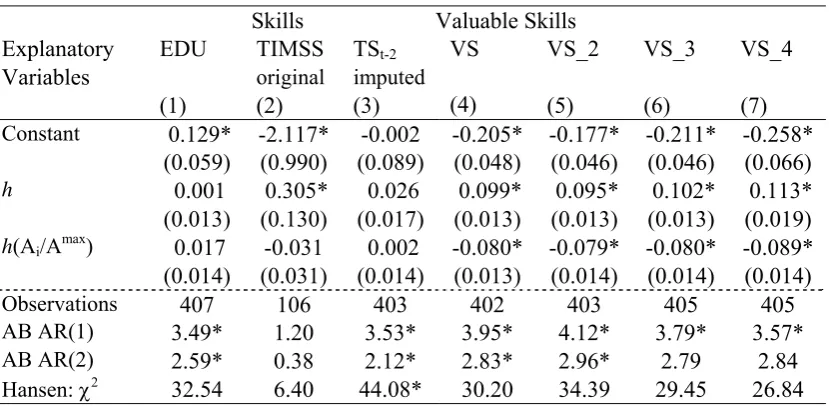
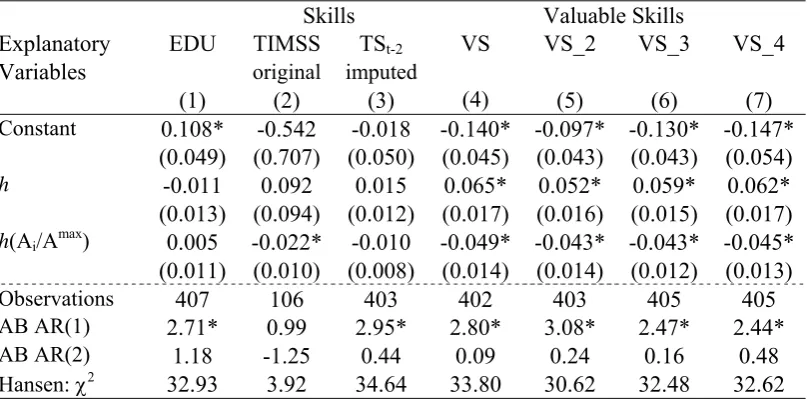
Table 4 presents system panel GMM estimates of the Benhabib and Spiegel (2005) model.30 Regression (1) utilises the quantity measure of education, EDU, columns 2-3 use the cognitive skills measures, TIMSS and TSt-2, and regression (4) utilises the new
valuable skills measure, VS. The results indicate that only when TIMSS and VS are used as measures of human capital we obtain statistically significant coefficients that have the expected sign. Note, however, that the estimated coefficient of h in
regression (2) is implausible, when compared to that of h(A/Amax).31 In contrast, the
estimated parameters in column (4) are reasonable. Table 4 also reports the Arellano-Bover AR(1) and AR(2) tests for autocorrelation, as well as the Hansen test of over-identifying restrictions. While the AR(1) is expected to be significant at 5% level, AR (2) is a specification test. In all regressions, the AR (2) and Hansen statistics are not significant, the latter confirming the validity of the instruments used.
29 Similar results and further discussion are in Messinis and Ahmed (2008). 30 We follow Benhabib and Spiegel (2005) to estimate the log of TFP or ln(A
t) as a residual
by assuming =(1/3) and =(2/3); i.e., ln(At) = ln(Yt) – (1/3)ln(Kt) – (2/3)ln(Lt).
31 This is on the basis of equation (7) below that suggests that the threshold of h below
- Table 4 about here -
Benhabib and Spiegel (2005) also explore the implications of the logistic diffusion process for developing nations and their capacity to catch up with the developed economies. That capacity, they argue, depends on a critical threshold level of human capital. Nations with human capital levels below that threshold stagnate and remain behind for decades. They derive this threshold or ‘catch-up condition’ to be:
max * exp ln( t ) t
sg h
h
sg m
(7)
In the case of logistic diffusion, s=1, htmaxis human capital in the leading country in period t (see footnote 13 above), and g and m are estimates of the human capital stock and diffusion parameters in model (5). Benhabib and Spiegel (2005) use average years of education (EDU) as a measure of human capital. They estimate h* to be 1.78 in 1960, and 1.95 in 1995. In 1960, there were 27 countries with EDU being below the threshold. By 1995, the number of nations at risk had declined to 4.
We emulate their approach using the new index of ‘valuable skills’ as a measure of human capital and the empirical estimates in column four in Table 4. Figure 2 summarises the results by human capital and distance to the frontier, D1970, in 1970 for three regional groups using h* (i.e., 4.17 in 1970) and the top 25% quartile of D1970 (i.e., nations closest to the frontier, that is the USA) as thresholds. Using the new index of human capital, we find that there were 25 countries that were unable to meet condition (7) in 1970. Three decades later, that number had reduced to 22 in 2000-03.32 This finding contrasts with that of Benhabib and Spiegel (2005) reported above and calls for greater attention to skills that matter in development policy. This is consistent with the evidence in Hulten and Isaksson (2007) who find that the gap between rich and poor is likely to persist for some time.
32 Note, h* was estimated to be 4.32 in 2000-03. Asia was represented by China, Indonesia,
- Figure 2 about here -
The top panel of Figure 2 illustrates the fact that nations that failed to meet the ‘catch-up condition’ (top left) experienced minimal TFP productivity growth since 1975. On the other hand, countries that were far from the frontier and met condition (7) grow faster than others (see top centre). As a result, economies with very low levels of human capital stock in 1970 failed to catch-up; that is, they witnessed little change in terms of their level of backwardness (bottom left). In fact, in this group, small improvements in human capital associate with divergence. In contrast, nations that were far from the frontier but had enough skills in 1970 have improved their position substantially as they invested in skills since 1970 (bottom centre). Developed nations closest to the frontier (bottom right) have benefited little from higher skills since the diffusion effect dominates the human capital effect in (5).
4.
Sensitivity Analysis
In this section, we undertake sensitivity analysis to assess whether our empirical results are robust to four main assumptions. First, in factor analysis, we assumed that the latent index we call ‘valuable skills’ was composed of five key indicators: TSt-2,
SciP, BKS, Ke, and Xm. We seek to examine how sensitive the estimates are to individual indicators. For instance, it may be argued that Ke and Xm may introduce a bias in the estimation of (5) if they correlated with the log of physical capital stock, K, or its growth rate, ΔK.33 In panel B of Table 2, we re-estimate a latent factor by excluding both Ke and Xm from the indicator matrix. Surprisingly, we obtain similar results as earlier: all three remaining indicators are significant; there exists a single latent factor, and BKS weighs as the most important indicator of this alternative latent index, VS_2. Column (5) in Table 4 presents GMM estimation results using VS_2 as a measure of human capital. The coefficient estimate of h in (4) seems much lower
than the 0.073 valued observed in column (4). Yet, a Wald test cannot reject the hypothesis that this new coefficient is equal to 0.073. Thus, it appears that the exclusion of Ke and Xm from factor analysis does not alter the results observed
33 We owe this idea and that of reliability tests to an anonymous referee. Indeed, the
earlier. In regression (6), we repeat the exercise by excluding this time the imputed TIMSS series, TSt-2 in factor analysis. Again, the GMM estimates are very similar to
those reported in column (4). In regression (7), we go further to exclude both TSt-2 and
BKS. Once again, the results remain almost identical to those in column (4).
Analysis so far has presumed that the USA has been the technology leader in all the sample periods. This seems arbitrary and we next allow the data to determine the leader. Although not reported in Table 4, we obtained the estimation coefficients of 0.069 (0.016) and -0.057 (0.017) for h and h(A/Amax) respectively; standard errors in
parentheses. These findings confirm those presented in Table 4.34
Even so, we go further to examine the sensitivity of our results to different lags in the instruments set. Although the main advantage of system GMM estimation rests on its capacity to utilise instruments for each time period, variable and lag distance (e.g. regression (4) in Table 4 uses 34 instruments in total), we also allow for a fourth lag in the instruments. Again, the estimation results are very similar to those observed in Table 4. Further, we seek to examine whether the results are sensitive to the choice of the second lag as an instrument, for it may contaminate the results with endogeneity bias. Thus, we re-estimate model (5) using only lags 3-4 in the instrument set. Again, the results are not reported in Table 4 but are very similar to those in column (4) of the table. Using VS as a measure of h, we found the coefficient estimates of h and
h(A/Amax) to be 0.081 (0.022) and -0.073 (0.026) respectively.35 Hence, the above
suggest that the evidence in regression (4) of Table 4 is robust to assumptions regarding the technology leader, the composition of the latent factor, and the set of instruments used in GMM estimation.
Next, we investigate the sensitivity of our empirical results to alternative production functions. An emerging literature has cast doubt on the validity of Cobb-Douglas production functions in understanding long-term growth patterns. This literature points to growing evidence in favour of production functions that account for capital- skill complementarities (CSC) and/or skill-biased-technical-change
34 Note that we also run cross-section regressions as in Benhabib and Spiegel (2005). We
obtained the following coefficient estimates for h and hln(A/Amax) respectively: 0.023 (0.007)
and -0.019 (0.006) for 1970 values and 0.037 (0.007) and -0.029 (0.006) for average 1970-2003 values of VS; standard errors in parentheses. Although still higher, these estimates are more comparable to those of Benhabib and Spiegel (2005).
35 Sensitivity test results as reported here carry through to the analysis using CES and
(SBTC)36. Nelson and Phelps (1966) and Benhabib and Spiegel (1994, 2005) briefly discussed the former but they never abandoned Cobb Douglas technology.
We seek to test the robustness of the logistic diffusion model (5) when we allow for CES and translog production technologies. This is particularly important in the light of Lopez-Pueyo, Barcenilla and Sanau (2008) who show that TFP growth and the identification of knowledge spillovers are sensitive to the form of production function assumed. Furthermore, we wish to examine whether the results in Table 4 stand when we account for CSC and SBTC, especially in view of the proposed idea of a direct link between valuable skills and human capital.
CES Production Technology: Calibration
First, we consider the CSC hypothesis. We adopt the two-level CES production function of Duffy, Papageorgiou and Perez-Sebastian (2004) but allow technology growth to be endogeneous, as proposed by Benhabib and Spiegel (2005). More
formally, we define the log of TFP, lnAt, as follows:
/
lnAt yt (1/ )ln
a bK( t (1 b S) t (1 a N) tet (8)
Here, ytis again the log of per capital GDP, St is skilled labour, Nt is unskilled
labour, is the Allen intra-class elasticity-of-substitution parameter between K and S, is Allen inter-class elasticity-of-substitution between K and N. We calibrate (8) based on evidence in Krusell et al. (2000); i.e., we set a=1/3, b=0.5, =-0.4 and =0.5.
Duffy, Papageorgiou and Perez-Sebastian (2004) ponder about the definition of skilled labour, S, and experiment with various measures. Here, we use the Barro and Lee (2001) series of primary school attainment (PRIM), for it is consistent with the evidence in Duffy, Papageorgiou and Perez-Sebastian (2004), and compares with the translog model below. Table 5 displays coefficient estimates that are very similar to those observed in Table 4, except that the new coefficients for TIMSS and alternative
36 Seminal papers are Krusell
et al. (2000), Acemoglu and Zilibotti (2001), Duffy,
measures of ‘valuable skills’ seem higher in absolute value than those in Table 4. Thus, it seems that the innovation and diffusion effects of human capital observed in Cobb-Douglas technology are also present in CES production with capital-skill complementary. Yet, we reserve judgment until we consider a translog production function that allows both the CSC and SBTC hypotheses to be nested.
- Table 5 about here –
Translog Production Technology: Calibration
The translog production function is a more flexible functional form that allows one to disentangle capital-skill complementary (CSC) effects from skill-biased-technical-change (SBTC) effects. We adapt Papageorgiou and Chmeralova (2005) who take the physical capital stock to be a quasi-fixed factor but we also draw on Young (1992) and Mazumdar and Quispe-Agnoli (2004) to allow for technology in the translog variable cost function:
0
2 2 2
2
ln ln ln ln ln ln ln
1
(ln ) ln ln (ln ) (ln )
2 1
ln ln (ln ) ln ln ln ln
2
i
j
j j
Y i i K A YK
YY i i j KK AA
i
ij i j AA Yi i AK
i
C Y W K A Y K
Y W W K A
W K A Y W A K
(9)Wi is the price of variable production input i (where i = S, N), K is physical capital,
and Ai is technology. Using Shepard’s lemma, we obtain an expression for the share
of skilled labour in the variable cost function as:
ln
ln ln ln ln
ln
S S Y S j j K A
j S
C
Y W K A
P
(10)
Assuming homogeneity of degree one in variable input prices (i.e., S + N =0) we have
ln( / ) ln( / ) ln( / ) ln
S
S
K K Y
S WS WN
Y Y L
A AModel (11) says that the share of skilled labour in the wage fund, S, is a function
of the capital-output ratio, (K/Y), the relative price of skilled labour, (WS/WN), real
output per worker, (Y/L), and technology, A; all in logs. It nests the following hypotheses: (a) complementarity (substitutability) between K and S: K>0 (K<0); (b)
complementarity (substitutability) between S and N: S>0 (S<0); (c) homothetic
production: Y=0; and (d) skill-biased technical change (SBTC) in favour (at the
expense) of skilled labour: A>0 (A<0).
Following Young (1992) with constant returns to scale, lnA can be expressed as
lnAlnY
ln( ) (1K
) S ln( ) (1S S)ln( )N (12)We construct a measure of lnA in the following steps: (a) we utilise estimates of (WS/WN) in Papageorgiou and Chmeralova (2005, column five, Table A.1); (b) we
impute (WS/WN) for all countries,37 and (c) calculate S as in Papageorgiou and
Chmeralova (2005, p.64).38 The latter facilitates a translog measure of lnA as in (12)
and the estimation of models (5) and (11). Once again, we define skilled labour, S, on the basis of primary school attainment, PRIM, since this is also the measure used by Papageorgiou and Chmeralova (2005). We follow their approach to add ln(Y/L) in the list of regressors to allow for a non-homothetic production function. Panel 1 in Table 6 summarises the panel estimates of (5). FGLS estimates of (5) confirm the key role of valuable skills as an engine of total factor productivity growth. We again observe that the coefficient estimates for human capital and diffusion are positive and negative respectively, as expected. These estimates compare in absolute value to those in Table 4 rather than those in Table 5, except that the h coefficient is now smaller in most
regressions and it is not statistically significant in regression (2). Overall, we conclude that the new latent index of ‘valuable skills’ plays a significant role in innovation and technology diffusion irrespective of the form of the production function assumed.
37 The imputed measure of (W
S/WN) was on the basis of simultaneous quantile regressions
of the Papageorgiou and Chmeralova (2005) estimates of (WS/WN) on urban density (URB),
infant mortality (MoR), export manufactures (Xm), book publications (BKS), and a dummy variables for African nations (D_Africa).
38 We apply the formula
( / ) ( / )
S WS WN S WS WN S N
. For a complete table of these and
- Table 6 about here -
Finally, we utilise the new estimates of S, (K/Y) and (WS/WN) to estimate (11)
the results of which appear in Table 7. Feasible GLS estimates in column one suggest that capital and skilled labour are complementary, confirming the CSC hypothesis. Further, skilled and unskilled labour are also complementary while there is strong evidence of a skill bias in technical change, given the positive coefficient for ln(A). The latter is in support of the SBTC hypothesis.
In order to compare our results with Papageorgiou and Chmeralova (2005), we employ simultaneous quantile regressions (i.e., simultaneous estimation of the lowest and highest quartiles) to account for nonlinearities and report results for 1970-1979 and 1995-2003, columns 2-5 in Table 7. The results are qualitatively similar to those in column one. However, they shed new light on the spatial distribution of CSC and SBTC overtime, given that S exhibits a high, positive correlation with the level of
education and the capital to labour ratio. The results suggest that the CSC effect was stronger in more developed nations in the 1970s but it has become a global effect in the 1990s. Also, the complementarity between S and N has been confined to less developed nations in the late 1990s, in contrast to the evidence in Papageorgiou and Chmeralova (2005) who find the complementarity between skilled and unskilled labour (SNC) to be stronger in more developed economies. Finally, the skill bias of technology has been stronger in the developed world during the 1970s but it seems to be exclusively a developing world phenomenon in the late 1990s. Note, inter-quantile regressions reveal that both of these effects are statistically significant.
- Table 7 about here -
Hence, the overall evidence in this section seems to support the CSC, SNC and SBTC hypotheses and the presence of nonlinear effects whereby SNC and SBTC effects have become much more important in developing countries in the late 1990s.39
39 We also experimented with an alternative series of skilled labour, S, where the latent
5.
Summary and Conclusion
This paper develops a new index of human capital as a latent unobservable factor identified as valuable cognitive skills. Also, it tests the performance of this new index
in a horse race against three alternative measures of human capital in the logistic model of technology diffusion proposed by Benhabib and Spiegel (2005). The robustness of the empirical results with respect to alternative assumption is tested in sensitivity analysis. This includes extensions to the model beyond the Cobb-Douglas production function to consider CES and translog production technologies in order to assess the importance of CSC and SBTC hypotheses in explaining growth patterns.
Overall, the evidence shows that the new ‘valuable skills’ index outperforms existing measures of human capital. Moreover, it is the only measure that is consistent with the logistic model of diffusion in dynamic panel data analysis. Thus, we conclude that valuable skills facilitate innovation and technology diffusion.
This new measure of human capital also reveals that long-term income disparities persist in countries that pay little attention to valuable skills. In contrast to previous evidence, we find that the number of countries that are susceptible to poverty traps is much larger than previously thought. Most of these countries have remained stagnant and incapable of catching up over a thirty-year period. Although Africa and advanced OECD economies have invested heavily on education, they have witnessed a decline in valuable skills in recent times. In contrast, Asia and South Europe have invested heavily in the quality of education in terms of valuable skills. The new evidence calls
for a re-think of development policy to pay more attention to skills that matter in the global economy. Finally, there is strong evidence in favour of the SCS, SNC and SBTC but the latter two effects are increasingly associated with the developing world.
References
Abowd, J. M., Haltiwanger, J., Jarmin, R., Lane, J., Lengermann, P., McCue, K., McKinney, K. and Sandusky, K. (2005). The relation among human capital, productivity and market value: Building up from micro evidence, in Corrado, C., Haltiwanger, J. C. and Sichel, D. E. (eds.), Measuring capital in the new economy, 153-204, Studies in income and wealth, 65, Cambridge: National Bureau of Economic Research (NBER).
Acemoglu, D., Aghion, P. and Zilibotti, F. (2002). Distance to frontier, selection, and economic growth, NBER Working Paper No. 9066, Cambridge: NBER.
Aghion, P. and Howitt, P. (1998). Endogenous growth theory, Cambridge, MA: MIT Press.
Alders, P. (2005). Human capital growth and destruction: The effect of fertility on skill obsolescence, Economic Modelling, 22 (3), 503-520.
Arellano, M. and Bover, O. (1995). Another look at the instrumental variable estimation of Error-Components Models, Journal of Econometrics, 68 (1), 29-52.
Aristotle (1976). Nicomachean Ethics, Revised Edition, Tranlation by J. Thomson, London: Penguin.
Baten, J. and van Zanden, J. (2008). Book production and the onset of modern economic growth, Journal of Economic Growth, 13 (3), 217-35.
Barro, R. J. (2002). Education as a determinant of economic growth, in Lazear, E. P. (ed.), Education in the twenty-first century, 9-24, Stanford: Hoover Institution Press.
Barro, R. and Lee, J. (2001). International data on educational attainment: Updates and Implications, Oxford Economic Papers, 53 (3), 541-543.
Becker, G.S. (1964). Human capital: A theoretical and empirical analysis with special reference to education, New York, NBER.
Benhabib, J. and Spiegel, M. (1994). The role of human capital in economic development: Evidence from aggregate cross-country data, Journal of Monetary Economics, 34 (2), 143-174. Benhabib, J. and Spiegel, M. (2005). Human capital and technology diffusion, in Aghion, P. and
Durlauf, S. N. (eds.), Handbook of economic growth, 1A, 935-966, Handbooks in economics, 22, Amsterdam and San Diego: Elsevier, North-Holland.
Bils, M. and Klenow, P. J., (2000). Does schooling cause growth?, American Economic Review, 90 (5), 1160-83.
Borghans, L. and Heijke, H. (2005). The production and use of human capital: Introduction, Education Economics, 13(2), 133–142.
Bourdieu, P. (1977). Outline of a theory of practice, Cambridge University Press.
Brogan, R. D. and Erickson, E. W. (1975). Capital-skill complementarity and labor earnings, Southern Economic Journal, 42 (1), 83-88.
Caselli, F. (2005). Accounting for cross-country income differences, in Aghion, P. and Durlauf, S. N. (eds.), Handbook of economic growth, 1A, 679-741, Handbooks in economics, 22, Amsterdam and San Diego: Elsevier, North-Holland.
Cheng, M. Y. and Ghulam, R. (2007). Knowledge gap and earnings differential in the knowledge-based economy, Applied Economics Letters, 14 (3), 219-222.
Ciccone, A. and Papaioannou, E. (2005). Human capital, the structure of production, and growth, European Central Bank, Working Paper Series: 623.
Coe, D. T. and Helpman, E. (1995). International R&D spillovers, European Economic Review, 39 (5), 859-887.
Cohen, D. and Soto, M. (2007). Growth and human capital: Good data, good results, Journal of Economic Growth, 12 (1), 51-76.
Coulombe, S., Tremblay, J. and Marchand, S. (2004). Literacy scores, human capital and growth in fourteen OECD countries, Human Resources and Skills Development Canada, Statistics Canada, Minister of Industry, Catalogue No. 89-552-MIE.
Dagum, C. and Slottje, D. J. (2000). A new method to estimate the level and distribution of household human capital with application, Structural Change and Economic Dynamics, 11 (1-2), 67-94.
Destre, G., Levy-Garboua, L. and Sollogoub, M. (2008). Learning from experience or learning from others? Inferring informal training from a human capital earnings function with matched employer-employee data, The Journal of Socio-Economics, 37 (3), 919-38.
DeLong, J. B. and Summers, L. H. (1991). ‘Equipment Investment and Economic Growth’,
Quarterly Journal of Economics 106 (2), 445-502.
Dewey, J. (1916). Democracy and education: An introduction to the philosophy of education,
New York: Macmillan.
Dowrick, S. (2003). Ideas and education: level or growth effects?, NBER Working Paper No. 9709, Cambridge: NBER.
Dowrick, S. and Rogers, M. (2002). Classical and technological convergence: beyond the Solow-Swan growth model, Oxford Economic Papers, 54 (3), 369-385.
Duffy, J., Papageorgiou, C. and Perez-Sebastian, F. (2004). Capital-skill complementarity? Evidence from a panel of countries, Review of Economic and Statistics, 86 (1), 327-344.
Dulleck, U. and Foster, N. (2008). Imported equipment, human capital and economic growth in developing countries, Economic Analysis & Policy, 38 (2), 233-250.
Durlauf, S. N., Johnson, P. A. and Temple, J. R. W. (2005). Growth econometrics, in Aghion, P. and Durlauf, S. N. (eds.), Handbook of economic growth, 1A, 555-677, Handbooks in economics, 22, Amsterdam and San Diego: Elsevier, North-Holland.
Easterly, W. and Levine, R. (2001). It’s not factor accumulation: Stylized facts and growth models, The World Bank Economic Review 15 (2), 177-219.
Ehrlich, I. (2007). The mystery of human capital as engine of growth, or why the US became the economic superpower in the 20th century, NBER Working Paper 12868, Cambridge: NBER. Falvey, R., Foster, N. and Greenaway, D. (2007). Relative backwardness, absorptive capacity and
knowledge spillovers, Economics Letters, 97, 230–234.
Flossmann, A. L., Piatek, P. and Wichert, L. (2006). Going beyond returns to education: The role of noncognitive skills on wages in Germany, Working Paper, University of Konstanz, ZEW, September.
Fortson, J. (2008). Mortality risk and human capital investment: The Impact of HIV/AIDS in Sub-Saharan Africa, American Economic Association Annual Meeting, January 2008.
Fryges, H. and Wagner, J. (2007). Exports and productivity growth: First evidence from a Continuous Treatment Approach, IZA Discussion Paper No. 2782, Institute for the Study of Labor, Bonn.
Galiani S. and Schargrodsky, E. (2002). Evaluating the impact of school decentralization on education quality, Economia, Journal of the Latin American and Caribbean Economic Association, 2 (2), 275-314.
Gallup, J. L., Sachs, J. and Mellinger, A. D. (1999). Geography and economic Development, International Regional Science Review, 22 (2), 179-232.
Gault, F. (2005). Measuring knowledge and its economic effects: The role of official statistics, Advancing Knowledge and the Knowledge Economy Conference, National Academies of Science, Washington D. C.
Gorlich, D. and de Grip, A. (2007). Human capital depreciation during family-related career interruptions in male and female occupations, Kiel Institute for the World Economy, Working Paper No. 1379.
Griliches, Z. (1981). Market value, R&D, and patents, Economic Letters, 7, 183-187.
Hanushek, E. A. and Kimko, D. D. (2000). Schooling, labor-force quality, and the growth of nations, American Economic Review, 90 (5), 1184-1208.
Hanushek, E. and Wößmann, L. (2007). The role of school improvement in economic development, NBER Working Paper No. 12832, Cambridge: NBER.
Hartog, J. and Oosterbeek, H. (2007). What should you know about the private returns to education?, in Hartog, J. and van den Brink, H. M. (eds.), Human capital: theory and evidence, 7-10, New York: Cambridge University Press.
Heckman, J., Stixrud, J. and Urzua, S. (2006). The effects of cognitive and noncognitive abilities on labor market outcomes and social behavior, Journal of Labor Economics, 24 (3), 411-482. Hulten, C. R. and Isaksson, A. (2007). Why development levels differ: The sources of differential
economic growth in a panel of high and low income countries, NBER Working Paper No. 13469, Cambridge: NBER.
Ingold, T. (2000). Evolving skills, in Rose, H. and Rose, S. (eds.), Alas, poor Darwin: Arguments against evolutionary psychology, 225-246, London: Jonathan Cape.
Jamison, E.A, Jamison, D.T. and Hanushek, E. (2007). The effects of education quality on income growth and mortality decline, Journal of Economic Growth, 26 (6), 772-789.
Jones, G. (2008). Cognitive ability and technology diffusion: An empirical test, American Economic Association Annual Meeting, January 2008.
Jones, G. and Schneider, W. J. (2006). Intelligence, human capital, and economic growth: A Bayesian averaging of classical Estimates (BACE) Approach, Journal of Economic Growth, 11 (1), 71-93.
Joss, R. L. (2001). Management, Australian Journal of Management, 26 (Special Issue), 89-103. Kaldor, N. (1962). International trade and economic development, The Journal of Modern African