ISSN (Print) : 2320 – 3765 ISSN (Online): 2278 – 8875
I
nternational
J
ournal of
A
dvanced
R
esearch in
E
lectrical,
E
lectronics and
I
nstrumentation
E
ngineering
(An ISO 3297: 2007 Certified Organization)
Website: www.ijareeie.com
Vol. 6, Issue 3, March 2017
A Comparative Study of Electricity
Generation by Solar and Wind Energy in
India
Ankit Dwivedi1, Bhavishya Chandra Anand2, Chetan Purohit3, Dikesh Kumar Sen4, Dinesh Singh
Rajpurohit5, Dharmendra Kumar Bansal6
UG Students, Department of Electrical Engineering, Poornima College of Engineering, Jaipur, India1, 2,3,4,5
Assistant Professor, Department of Electrical Engineering, Poornima College of Engineering, Jaipur, India 6
ABSTRACT: In present scenario energy resources are being used at an alarming high rate. In order to ensure that younger generation are least deprived of their energy usage. Renewable energy resources needs to get more attention and research. India now considers Wind, Solar and Piezo as an alternate source of future energy generation. In India incidence of Solar energy in land area alone is 5000 trillion kilowatt hours which exceeds energy outcome of all possible non-renewable energy reserves in India. Next higher potential after Solar comes from Wind. In India Wind flows at an average speed of 55 kmph. Also, India contains largest Railway network in the world along with network of local trains in Bombay and metro in Delhi, Jaipur, Mumbai, Pune etc. This network adds to the potential of wind energy in India. maximum energy generated in one hour is 3.86 KWh.
KEYWORDS: Wind energy, Renewable energy, wind turbines, Stress, fuel.
I.INTRODUCTION
Today the demand for energy has drastically increased as a result of which fossil fuels are consumed at a high rate.Keeping in view the problems related to energy reserves, India has identified Solar and Wind as potential renewable energy sources that can mitigate the issues related to depletion of fossil fuels. India’s total renewable energy capacity has reached around 33GW. The target is to achieve 175GW by 2022. India is planning to extend by 100GW of solar and 60 GW of wind capacity with nearly 25 solar parks with capacity of 1000MW.
Now taking into consideration the numerical data of wind and solar in India as on 30st September is, 28082.95MW power i.e. vibration based generators.Conversion of vibration to electrical energy is possible using piezoelectric, electromagnetic and electrostatic based device. It is stated in that, generally, electrostatic device is able to produce electrical energy up to 2% of efficiency while electromagnetic device according to, it can generate electrical powedue to wind grid interactive power generation and 8513.23MW power due to solar grid interactive power.
Wind energy is considered as one of the most clean and easy to use energy. The cost of storing it and using it also low. In India total installed wind power capacity of India was 21136.3 MW in 2014-15 and ranks 5th in the world. Another promising device for producing electricity power is Piezo-electrr up to 1.4mW with 25% efficiency. In India the gross installed capacity of solar grid intereactive power is 4879 MW. Also the grid connected solar PV power.
ISSN (Print) : 2320 – 3765 ISSN (Online): 2278 – 8875
I
nternational
J
ournal of
A
dvanced
R
esearch in
E
lectrical,
E
lectronics and
I
nstrumentation
E
ngineering
(An ISO 3297: 2007 Certified Organization)
Website: www.ijareeie.com
Vol. 6, Issue 3, March 2017
II.EXISTING SYSTEM
Thermal power plant have been the main source of power in the world for centuries.
With our experience in Thermal and Gas power plant as a part of India’s largest power generating companies the following are the Pros and Cons that come to my mind.
Needs large amount of Coal and Water so has to be placed a large water sources and coal mine. Else the
• Logistics cost will be too high. A Power plant of 3000MW typically requires 35,000 to 45,000 tons of coal. • It is the prime contributor to CO2 emissions all over the world. With the Climate change a restriction is now
placed on all countries in this regard.
• Nearly 20% to 30% of coal is rejected as Ash, which is a waste and needs to be dumped. Unutilized ash is collected in Ash dykes that form the largest land usage in a typical thermal power plant. It is also detrimental to environment.
ISSN (Print) : 2320 – 3765 ISSN (Online): 2278 – 8875
I
nternational
J
ournal of
A
dvanced
R
esearch in
E
lectrical,
E
lectronics and
I
nstrumentation
E
ngineering
(An ISO 3297: 2007 Certified Organization)
Website: www.ijareeie.com
Vol. 6, Issue 3, March 2017
• Some liquid effluents are also discharged as the byproduct of water / chemical treatment and runoff of various oil / chemicals.
• Thermal power plant take a lot of time to start up (generally 4–8 hrs.) and don’t do well in cycling that is large up and down in power generation and mostly designed for constant load. Therefore any fluctuation is power demand can be detrimental to it life cycle.
• A large quantity of ash is released from the Chimney and the coal dust that lead to a high particulate matter in the surrounding areas. Though nearly 99% is captured using ESP still a significant amount escapes.
III. RENEWABLE ENERGY POTENTIAL
India has an estimated renewable energy potential of about 900 GW of which Wind contributes 102 GW, Solar Power contributes 750 GW.
Renewable energy has a great potential to usher in universal energy access in a decentralized or standalone mode, renewable energy is an appropriate, scalable and viable solution for providing power to un-electrified or power
deficient villages and hamlets. Around 1.1 million households are using solar energy to meet their lighting energy needs and almost similar numbers of the households meet their cooking energy needs. Solar Photovoltaic (PV) power systems are being used for a variety of applications such as rural electrification, railway signalling, microwave repeaters, TV transmission and reception and for providing power to border outposts. Over 10,000 remote and inaccessible villages and hamlets have been provided with basic electricity services through distributed renewable power systems.
ISSN (Print) : 2320 – 3765 ISSN (Online): 2278 – 8875
I
nternational
J
ournal of
A
dvanced
R
esearch in
E
lectrical,
E
lectronics and
I
nstrumentation
E
ngineering
(An ISO 3297: 2007 Certified Organization)
Website: www.ijareeie.com
Vol. 6, Issue 3, March 2017
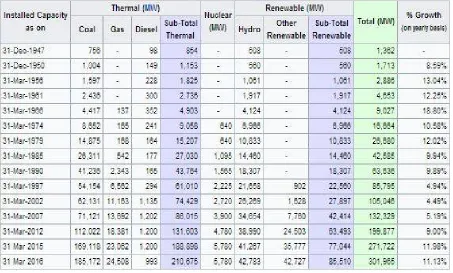
IV. RENEWABLE POWER INSTALLED CAPACITY
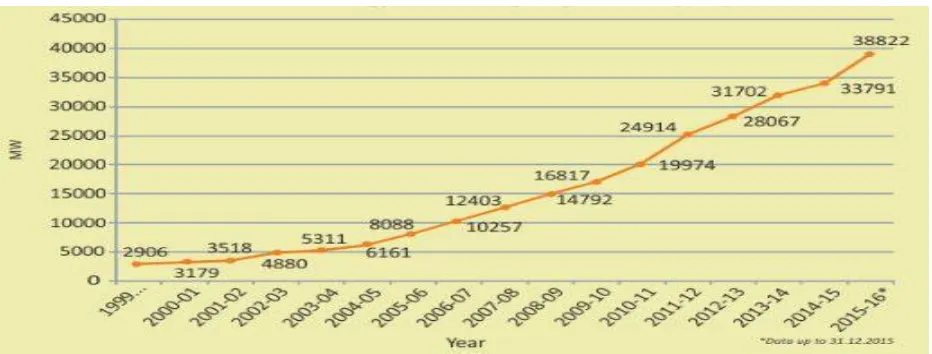
The gross installed capacity of grid interactive renewable power in the country stood at about 33.8 GW as on 31st December 2015 as shown in Table 1.2. As of December 2015, solar, wind, biomass and small hydropower contribute about 13.60 per cent of the total installed capacity for electricity. Renewable energy has been witnessing over 20 per cent growth in the last five years. From the total renewable power installed capacity of 14,400 MW at the beginning of 2009, it has reached a capacity of 38,822 MW at the end of December 2015. Wind energy continues to dominate India’s renewable energy industry, accounting for over 64 % of installed capacity (25,088 MW), followed by solar power (4,879 MW), biopower (4,677 MW) and small hydro power (4,177 MW).
Fig 3- All India Power Installed Capacity (MW) and Renewable Power Installed Capacity (MW)
V. RENEWABLE ENERGY FOR RURAL, URBAN, INDUSTRIAL AND COMMERCIAL APPLICATIONS
APPLICATIONS
ISSN (Print) : 2320 – 3765 ISSN (Online): 2278 – 8875
I
nternational
J
ournal of
A
dvanced
R
esearch in
E
lectrical,
E
lectronics and
I
nstrumentation
E
ngineering
(An ISO 3297: 2007 Certified Organization)
Website: www.ijareeie.com
Vol. 6, Issue 3, March 2017
Under the National Biomass Cookstoves Initiative, several pilot projects have been taken up during the year for deployment of improved biomass cookstoves for demonstration among domestic and large sized community cooking in Anganwadis, Mid-day meal schemes in schools, Tribal Hostels etc. Projects taken up under Unnat Chulha Abhiyan are now eligible for Carbon Credits under the CDM mechanism with Sardar Swaran Singh National Institute of Renewable Energy (SSS-NIRE), an autonomous institute of MNRE, located at Jalandhar, Punjab has been designated as Coordinating and Managing Entity (CME). At present 40 models of improved cookstoves have been approved by the Ministry, as per the Test Reports issued by the Test Centres.
Rice husk gasifier based 12 village level projects of 32 kWe each have been installed based on sustainable business model by entrepreneurs in various villages of Bihar. In addition, 10 systems are under various stages of installation / commissioning. Off-grid power capacity from biomass gasifier in 10 rice mills and 12 other industries including bakeries for meeting captive demand of electricity and thermal applications have been added. A grid connected biomass gasifier based project of 1 MW capacity in Haryana has been installed for meeting the captive power needs of the industry.During the year 2015-16, the physical achievement under the programme is 14.1 MWeq. and cumulative achievement in the sector is 265.4 MWeq. As part of the new initiatives the Government has amended the National Tariff Policy to make Distribution Licencees to 100% procure power produced from WTE plants. A cumulative capacity of 601.87 MW has so far been commissioned mainly in the states of Tamil Nadu, Uttar Pradesh, Haryana, Karnataka, Andhra Pradesh, Uttarakhand, Punjab and Rajasthan. CEA have notified norms for determination of Generic Tariff for MSW, RDF and Biogas based WTE projects along with Generic Tariff for FY 2015-16. As a part of new initiative of supporting Bio-CNG production, two MNRE supported projects for cumulative production of 9,538kg/day of Bio-CNG, got commissioned during the financial year FY 2015-16, in Ahmedabad, Gujarat and Delawas, Jaipur.
VI. SOLAR POWER IN INDIA
Solar power in Indiais a fast-growing industry and as of 31 December 2016, the country's solar grid had a cumulative capacity of 9,012.66 megawatts (MW) or 9.01 gigawatts (GW). In January 2015, the Indian government expanded its solar plans, targetingUS$100 billion of investment and 100 GW of solar capacity, including 40 GW's directly from rooftop solar, by 2022. The rapid growth in deployment of solar power is recorded and updated monthly on the Indian Government's Ministry of New and Renewable Energy website. Large scale solar power deployment began only as recently as 2010, yet the ambitious targets would see India installing more than double that achieved by world leaders Chinaor Germanyin all of the period up to 2015 year end.
ISSN (Print) : 2320 – 3765 ISSN (Online): 2278 – 8875
I
nternational
J
ournal of
A
dvanced
R
esearch in
E
lectrical,
E
lectronics and
I
nstrumentation
E
ngineering
(An ISO 3297: 2007 Certified Organization)
Website: www.ijareeie.com
Vol. 6, Issue 3, March 2017
India is ranked number one in solar electricity production per watt installed, with an insolation of 1700 to 1900 kilowatt hours per kilowatt peak (kWh/KWp). On 16 May 2011, India’s first solar powerproject (with a capacity of 5 MW) was registered under the Clean Development Mechanism. The project is in SivagangaiVillage, Sivagangadistrict, Tamil Nadu. India saw a sudden rise in use of solar electricity in 2010, when 25.1 MW was added to the grid, and the trend accelerated when 468.3 MW was added in 2011. Recent growth has been over 3,000 MW per year(see table below)and is set to increase yet further. Government-funded solar electricity in India was just 6.4 MW per year in 2005.
ISSN (Print) : 2320 – 3765 ISSN (Online): 2278 – 8875
I
nternational
J
ournal of
A
dvanced
R
esearch in
E
lectrical,
E
lectronics and
I
nstrumentation
E
ngineering
(An ISO 3297: 2007 Certified Organization)
Website: www.ijareeie.com
Vol. 6, Issue 3, March 2017
The development ofwind power in Indiabegan in the 1986 with first wind farmsbeing set up in coastal areas of Maharashtra (Ratnagiri), Gujarat (Okha) and Tamil Nadu (Tuticorin) with 55 kW Vestas wind turbines. These demonstration projects were supported by the Minstry of New and Renewable Energy (MNRE). The capacity has significantly increased in the last few years and as of 31 Aug 2016 the installed capacity of wind power in India was 27,676.55 MW, mainly spread across the South, West and North regions. [1]Although a relative newcomer to the wind industry, compared with countries such as Denmarkor the United States, by year end 2015 India had the fourth largest installed wind power capacity in the world. (behind 1. China, 2. USAand 3. Germany), having overtaken 5. Spainin 2015 and ahead of 6. UK.
The potential for wind farms in the country was first assessed by Dr. Jami Hossain using a GIS platform to be more than 2,000 GW in 2011. This was subsequently re-validated by Lawrence Berkley National Laboratory, US (LBNL) in an independent study in 2012. As a result, the MNREset up a committee to reassess the potential and through the National Institute of Wind Energy (NIWE, previously C-WET) has announced a revised estimation of the potential wind resource in India from 49,130 MW to 302,000 MW assessed at 100m Hub height. The wind resource at higher Hub heights that are prevailing is possibly even more. In the year 2015, the MNREset the target for Wind Power generation capacity by the year 2022 at 60,000 MW. East and North east regions have no grid connected wind power plant as of March 2015. No offshore wind farm utilizing traditional fixed-bottom wind turbine technologiesin shallow sea areas or floating wind turbinetechnologies in dee0p0 00sea areas are under implementation. However, an Offshore Wind Policy was announced in 2015 and presently weather stations and LIDARsare being set up by NIWE at some locations.
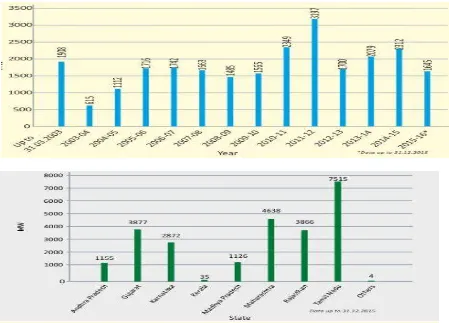
Fig 7-Year-Wise Wind Power Installed Capacity (MW)
Fig 8-State-Wise Wind Power Installed Capacity (MW)
ISSN (Print) : 2320 – 3765 ISSN (Online): 2278 – 8875
I
nternational
J
ournal of
A
dvanced
R
esearch in
E
lectrical,
E
lectronics and
I
nstrumentation
E
ngineering
(An ISO 3297: 2007 Certified Organization)
Website: www.ijareeie.com
Vol. 6, Issue 3, March 2017
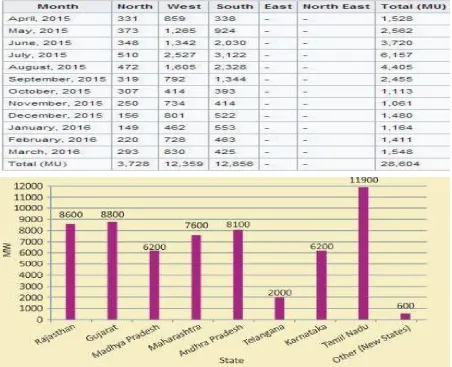
utilization factories nearly 14% in the fiscal year 2015-16 (15% in 2014-15). 70% of wind generation is during the five months duration from May to September coinciding with Southwest monsoon duration.
Fig 9-Monthly Electricity Generation in India (April 2015-March 2016)
Fig 10-Tentative State-Wise Break-up of 60 GW Wind Power Under Renewable Power Target of 175 GW
VII. CONCLUSION
World is developing day by day and technology is advancing with it so, why we are still dependent on nonrenewable source of energy. Wind energy is a renewable energy which can be captured using wind turbines, so we proposed a new design of wind turbine which can be helpful to capture the gust of wind generated by running trains.
There are villages and places where transmission of electricity is not easy but train tracks are everywhere, so by installing wind turbines and piezoelectric materials along parallel to tracks can produce required electricity or power.
This generated electricity will be transmitted to nearby villages to light up the LED’s which consume very less power about 3 watts.
Experimentation is being done at a very small scale in labs to checks its power generating capability and different designs of turbines were also used in this experimentation.
ISSN (Print) : 2320 – 3765 ISSN (Online): 2278 – 8875
I
nternational
J
ournal of
A
dvanced
R
esearch in
E
lectrical,
E
lectronics and
I
nstrumentation
E
ngineering
(An ISO 3297: 2007 Certified Organization)
Website: www.ijareeie.com
Vol. 6, Issue 3, March 2017
ACKNOWLEDGEMENT
We the authors like to thanks Poornima College of Engineering for its full financial and technical support. We also acknowledge Head of Department Electrical Engineering for help and support.
REFERENCES
[1] Chen, Z., Spooner, E., “Wind Turbine Power Converters: A Comparative Study,” 7th International Conference on Power Electronics and VariableSpeed Drives, No. 456, pp. 471-476, Sept. 1998.
[2] S. Kang, K. Park, and H. Kim, “Circuit component requirements for energy scavenging systems,” Trans. KIEE, vol. 57, pp. 1790-1795, Oct.2008.cut-by-rs-1-09-per-litre-588804.
[3] S.U. Lee, K.H. Lee, G.T. Ahn, J.H. Heo, H.W. Kwon, and T.H. Lee, “Study of energy harvesting using piezoelectric element,” RIST Journal,vol. 25, pp. 34-37, Jan. 2011.
[4] A. Erturk and D. J. Inman, “An experimentally validated bimorph cantilever model for piezoelectric energy harvesting from base excitations,Smart Mater. Struct., vol. 18, no. 2, art. No. 025009, Feb.
[5] IEEE Standard on Piezoelectricity. ANSI/IEEE Std. 176–1987,1987.
[6] W. Martienssen, Ed., Ferroelectrics and Related Substances, Landolt-Bornstein New Series III 36–A1, A2, B1, B2, Berlin, Germany:Springer-Verlag, 2001.
[6] J. L. Agorreta, L. Reinaldos, R. Gonzalez, M. Borrega, J. Balda, and L. Marroyo, “Fuzzy switching technique applied to PWM boost converter operating in mixed conduction mode for PV systems,” IEEE Trans. Ind.Electron., vol. 56, no. 11, pp. 4363–4373, Nov. 2009.
[7] N. Khaehintung, K. Pramotung, B. Tuvirat, and P. Sirisuk, “RISC microcontrollerbuilt-in fuzzy logic controller of maximum power point tracking for solar-powered light-flasher applications,” in Proc. 30th Annu. Conf. IEEE Ind. Electron. Soc., 2004, pp. 2673–2678.
[8] A. Hussein, K. Hirasawa, J. Hu, and J. Murata, “The dynamic performanc of photovoltaic supplied dc motor fed from DC–DC converter and controlled by neural networks,” in Proc. Int. Joint Conf. Neural Netw., 2002, pp. 607–612.
[9] X. Sun, W. Wu, X. Li, and Q. Zhao, “A research on photovoltaic energy controlling system with maximum power point tracking,” in Proc. PowerConvers. Conf., 2002, pp. 822–826.
[10] A. Varnham, A. M. Varnham, G. S. Virk, and D. Azzi, “Soft-computing model-based controllers for increased photovoltaic plant efficiencies,IEEE Trans. Energy Convers., vol. 22, no. 4, pp. 873–880, Dec. 2007.
[11] K. H. Hussein, I. Muta, T. Hshino, and M. Osakada, “Maximum photovoltaic power tracking: An algorithm for rapidly changing atmospheri conditions,” Proc. Inst. Elect. Eng., vol. 142, no. 1, pp. 59–64, Jan. 1995.