Portfolio Investment Model Using Neuro Fuzzy
System
Keerti. S.Mahajan*, Shruti. S. Jamsandekar*, Dr. R .V. Kulkarni**
*Asst Proff. Department of Computer Studies, SIBER, Kolhapur. (MS), India-416004 **H.O.D. Department of Computer Studies, SIBER, Kolhapur. (MS), India-416004
Abstract: Stock Market is considered as one of the fundamental building block of developed country so if number of inverstors increases then the economy of the country also increases and every investor invests to get good returns. But as stock market is uncertain and complicated the selection of good scripts are considered as one of the challenge in stock market field.This problem can be modelled using the Neuro-Fuzzy technique that can handle non-linearity and uncertainty in the stock market. Authors proposes a Neuro–Fuzzy model using financial indicators which play a vital role in selection of scripts. In This model past quarter results of selected listed scripts of BSE India are considered for training and setting the parameters of Fuzzy Inference System (FIS) which could signal investors to have profitable script in their portfolio.
Keywords: Fuzzy, Neural network, ROCE, P/E Ratio, EPS, ROI, Portfolio
I. INTRODUCTION :
Today, investment in stock has become a means of individual finance. The concept of Portfolio selection comes from the financial area. As stock market is very uncertain investment in stocks does not usually have a constant profitability, except for a few exceptions, but changes according to certain variables. This variability determines the investment risk, so the higher risk investments have the higher profitability opportunities. Portfolio theory considers a sequential portfolio selection procedure for investing in different sectors of stock market with a goal of predicting the performance of the future market. The performance of a portfolio selection is directly linked to the portfolio prediction, and this Portfolio performance is evaluated based on related past data and using a set of financial indicators.
Therefore, it is significant for investors to estimate the stock price and selecting the trading chance accurately in advance, which will bring high return to stockholders. In this paper we are trying to address this problem of portfolio selection using soft computing technique precisely the Neuro-Fuzzy approach in modeling the problem. The outline of this paper is as follows: we discuss about some closely related work on portfolio selection in Section II. Section III defines some financial indicators. At Section IV we
described the role of NeuroFuzzy in portfolio selection. Section V is the proposed model Section VI is the Experimental Results. Section VII concludes the paper.
II. RELATED WORK Portfolio selection:
An efficient portfolio model with high returns was developed by Markowitz [12]. Portfolio optimization for index fund management using genetic algorithm was
proposed by Oh, Kim, and Min [4]. Fernandez [10] proposed control model that includes ecological and economic uncertainty for managing both types of natural resources. Topaloglou et al [14] worked on international portfolio management using dynamic stochastic programming model to determine capital allocations to international markets and the selection of assets within each market. Talebnia and Fathi [16] compared the Markowitz model with the value at risk for creating the optimal stock portfolio in Tehran Stock Exchange from 2001 to 2008. In a study conducted by Nikoomaram and Hemmati [17] the benchmark of intellectual capital was measured by using six accounting model, and the portfolios network matrix were selected based on the market value of companies from listed companies in Tehran Stock Exchange during 5 years from 2006 to 2010. Portfolio Selection and Risk Management: An Introduction, Empirical Demonstration and R-Application for Stock Portfolios by Angela Hei-Yan Leung [15] this paper serves as an introduction to Portfolio Selection and Risk Management theories founded upon Harry Markowitz's Value-at-Risk calculation methods are described. Masoud Mansoury et.al [9] proposed an enhanced decision support system for portfolio management using financial indicators using a hybrid approach that offers the best suggestions in buying and selling stocks. Amit D.Narote et.al [11] has proposed a mixed portfolio theory model using genetic algorithm and vector quantization to find the effective data related to the stock market behaviour.
III FINACIAL INDICATORS:
1. Return On Capital Employed (ROCE): It is a
financial ratio of earning before interest and tax to capital employed, is calculated as:
ROCE = Earnings before Interest and Tax (EBIT) / Capital Employed [1]
A higher ROCE indicates more recommended. ROCE should be higher than the company’s capital cost; otherwise it indicates that the company is not employing its capital effectively and is not generating shareholder value.[1]
2. EARNING PER SHARE: Earnings per share
represents a portion of a company's profit that is allocated to one share of stock definition from [1]
Basic Earnings Per Share Calculation: EPS = Net Income/Outstanding Shares.[1][2]
3. P/E Ratio: Price-earnings ratio, also known as P/E ratio, is a vital financial indicator that is used by investors to help decide whether they should buy a stock.
Companies with higher P/E ratios generally expect higher earnings growth in the future than companies with low P/Es. The higher the ratio, the stronger is the company’s earning power
P/E Ratio =Market Value per Share /Earning per Share [1][2]
4. LIQUIDITY RATIO: Liquidity Ratio may refer to Reserve requirement, a bank regulation that sets the minimum reserves each bank must hold.If the liquidity ratio is too high, company performance is not good due to too much cash or investment on hand. When the ratio is too low, the company does not have sufficient cash to settle short-term debt. definition from [1][2]
The formula is the following: LR = liquid assets / short-term liabilities. [1][2]
5. RETURN ON INVESTMENT: Return on
investment allows an investor to evaluate the performance of an investment and compare it to others in his or her portfolio.
ROI = Gain from Investment- Cost of Investment/ Cost of investment [1][2]
Role of neuro-fuzzy system in portfolio selection :
Stock market data have non-linearity,therefore soft-computing models could provide better prediction results than linear models such as classification and association mining algorithms. Neuro-Fuzzy System is one of the suiltable alternative among other soft computing models for selection of portfolio scripts. Neuro-Fuzzy combines the advantages of ANN and fuzzy logic that can be employed in the design of the portfolio selection system.
In Many studies so far artificial neural networks have shown the capability of learning the underlying mechanics which is regarded as training phase of it. Also it is a multivariate nonlinear analytical tool, known to be good at recognizing patterns from noisy, complex data. [5][6][7].A fuzzy logic system is good at modeling linguistic terms used in natural language by using a set of if-then rules and also it can deal with uncertainties very easily with higher interpretation.
Portfolio selection should consider realistic constraints such as, transaction cost, and financial indicators such as Return on Investment, earning per share , Price/Earning ratio, risk measurements of each scripts or additional demands from investors rapidly, which adds a complexity. Traditional techniques such as linear programming, goal programming and regression model often fail to forecast future values when data is non-linear and chaotic. This is where neural network with its learning and forecasting characteristics can play can vital role in investment predictions. The fuzzy Inference system can simulate the human knowledge and can deal with nonlinear and uncertainty problems [10].
Neuro Fuzzy systems take the advantage of both neural which is good at learning from past and prediction and fuzzy which is good at handling uncertainty and interpretability. Neuro-Fuzzy System architecture is
formulated based on the theory of fuzzy logic and fuzzy set [9]. It is an approach that the neural network-learning algorithm is applied to the parameters of the fuzzy inference system. FIS is the process of creating the mapping from a recognized input to desired output using fuzzy logic.
IV. PROPOSED MODEL:
In the proposed model for Investment Portfolio Selection we have considered the following financial indicators which have a vital role in selection of scripts for investment such as, ROCE, Liquidity Ratio, EPS, P/E Ratio, ROI, of each Listed Scripts. This model is based on Neuro Fuzzy approach where each of the above listed financial indicators and factors are taken as inputs to neural network with training based on Back Propogation Method. Where the network will be trained to find out the membership functions and rules of the Fuzzy Inference System (FIS). Based on the membership functions and rules the FIS will be generated using Grid Partitioning Method. The proposed model is having five inputs with one output and the output will be the signal to invest in scripts with high returns and low risk. The training data will consider quarter wise results for one year data for Ten Listed Scripts of BSE India.
start
Input training data of quarter wise results of scripts
Set number of input MF and type of Fuzzy set
Generate ANFIS structure with grid
partitioning
Input testing data of 1 quarter into ANFIS
Testing ANFIS
V. EXPERIMENTAL RESULTS :
In experimental model past quarter results of selected sector wise listed scripts of BSE India such as FMCG, Steel, Pharmacy sectors are considered for training and testing.
A total 10 scripts of last 4 quarters are taken that is Q3, Q4 OF FY13-14 AND Q1, Q2 of FY14-15. Q3, Q4 and Q1 are used for training and Q2 for testing.
Experiment is carried out using MATLAB tool ANFIS.
Table 1: Listing ten sector wise scripts of BSE India 2013-2014 and 2014-2015
Table 2: Training data
Company ROCE EPS P/E RATIO LIQUIDITY ROI RESULTS
1 18.7 19.2 21.5 1.8 19 0
1 18.7 19.2 19.9 1.8 24.2 0
1 15.5 17.3 25.9 1.5 16.2 0
2 23.6 25 21.2 2.1 37.9 1
2 23.6 25 22.2 2.1 37.9 1
2 28 31.7 17.2 2.6 39.9 1
3 39.3 4.4 36.4 0.9 33.2 1
3 39.3 4.4 40.7 0.9 33.2 0
3 42.4 5.2 37.8 0.9 30.8 1
4 11.1 59.7 15.6 0.7 11.5 2
4 10.6 89.6 13.5 0.7 10.7 2
4 10.6 89.6 13.2 0.7 10.7 0
5 14.5 33.4 5.4 1.3 10.2 0
5 5.5 13 25.3 1.3 7.7 1
5 5.5 13 29.3 1.3 7.7 1
6 22.4 51.2 10.9 0.7 19.5 1
Year Qauter Script ROCE (Cr.) EPS (Cr.) P/E ratio Liquidity ratio ROI Result
13-14 Q3 CIPLA 18.7 19.2 21.5 1.8 19 HOLD
13-14 Q4 CIPLA 18.7 19.2 19.9 1.8 24.2 HOLD
14-15 Q1 CIPLA 15.5 17.3 25.9 1.5 16.2 HOLD
14-15 Q2 CIPLA 15.5 17.3 25.9 1.5 16.2 HOLD
13-14 Q3 WIPRO 23.6 25 21.2 2.1 37.9 BUY
13-14 Q4 WIPRO 23.6 25 22.2 2.1 37.9 BUY
14-15 Q1 WIPRO 28 31.7 17.2 2.6 39.9 BUY
14-15 Q2 WIPRO 28 31.7 17.5 2.6 39.9 BUY
13-14 Q3 DABUR 39.3 4.4 36.4 0.9 33.2 BUY
13-14 Q4 DABUR 39.3 4.4 40.7 0.9 33.2 HOLD
14-15 Q1 DABUR 42.4 5.2 37.8 0.9 30.8 BUY
14-15 Q2 DABUR 42.4 5.2 42.9 0.9 30.8 HOLD
13-14 Q3 JSW STEEL 11.1 59.7 15.6 0.7 11.5 SELL
13-14 Q4 JSW STEEL 10.6 89.6 13.5 0.7 10.7 SELL
14-15 Q1 JSW STEEL 10.6 89.6 13.2 0.7 10.7 HOLD
14-15 Q2 JSW STEEL 10.6 89.6 13.1 0.7 10.7 HOLD
13-14 Q3 JK CEMENT 14.5 33.4 5.4 1.3 10.2 HOLD
13-14 Q4 JK CEMENT 5.5 13 25.3 1.3 7.7 BUY
14-15 Q1 JK CEMENT 5.5 13 29.3 1.3 7.7 BUY
14-15 Q2 JK CEMENT 5.5 13 48.4 1.3 7.7 BUY
13-14 Q3 MAHINDRA & MAHINDRA 22.4 51.2 10.9 0.7 19.5 BUY
13-14 Q4 MAHINDRA & MAHINDRA 22.4 51.2 15 0.7 25.9 HOLD
14-15 Q1 MAHINDRA & MAHINDRA 22.4 51.2 14.9 0.7 25.9 HOLD
14-15 Q2 MAHINDRA & MAHINDRA 18.3 55.8 14 0.8 22.4 BUY
13-14 Q3 SUN PHARMA 34.3 14.5 42.3 2.2 43.6 BUY
13-14 Q4 SUN PHARMA 34.3 14.5 41.2 2.2 43.6 BUY
14-15 Q1 SUN PHARMA 34.3 14.5 41.2 2.2 43.6 BUY
14-15 Q2 SUN PHARMA 34.3 27.6 38.7 3.5 46.8 BUY
13-14 Q3 SESA GOA 1.3 26.2 7.1 2.2 1.3 HOLD
13-14 Q4 SESA GOA 8.8 21.2 8.5 1.7 9.2 HOLD
14-15 Q1 SESA STERELITE 8.8 21.2 13.6 1.7 9.2 HOLD
14-15 Q2 SESA GOA 8.8 21.2 12 1.7 9.2 HOLD
13-14 Q3 ONGC 19.6 28.3 9.6 1.2 22.4 BUY
13-14 Q4 ONGC 19.7 28.3 14.4 1.2 22.4 BUY
14-15 Q1 ONGC 18.6 31 13.5 0.8 18.9 BUY
14-15 Q2 ONGC 18.6 31 12.8 1.5 31.2 BUY
13-14 Q3 DR. REDDYSLABS 19.2 126.7 22.3 1.8 26 HOLD
13-14 Q4 DR. REDDYSLABS 19.2 98.8 26.4 1.6 25 HOLD
14-15 Q1 DR. REDDYSLABS 19.2 126.7 22.3 1.8 26 HOLD
Company ROCE EPS P/E RATIO LIQUIDITY ROI RESULTS
6 22.4 51.2 15 0.7 25.9 0
6 22.4 51.2 14.9 0.7 25.9 0
7 34.3 14.5 42.3 2.2 43.6 1
7 34.3 14.5 41.2 2.2 43.6 1
7 34.3 14.5 41.2 2.2 43.6 1
8 1.3 26.2 7.1 2.2 1.3 0
8 8.8 21.2 8.5 1.7 9.2 0
8 8.8 21.2 13.6 1.7 9.2 0
9 19.6 28.3 9.6 1.2 22.4 1
9 19.7 28.3 14.4 1.2 22.4 1
9 18.6 31 13.5 0.8 18.9 1
10 19.2 126.7 22.3 1.8 26 0 10 19.2 98.8 26.4 1.6 25 0 10 19.2 126.7 22.3 1.8 26 0
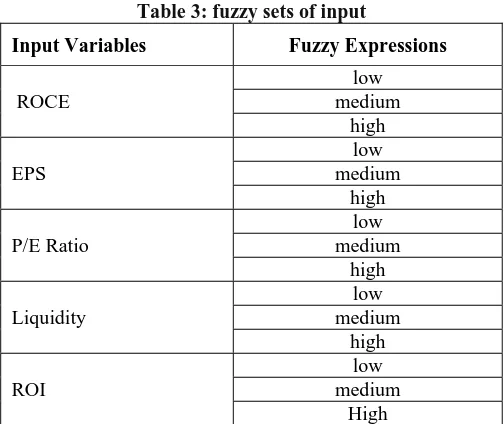
In this study Trapezoidal fuzzy shape is used for Membership Functions of input variables and number of fuzzy rules in the system is related to number of fuzzy sets for each input variable. The five inputs (p,q,r,s,t) of the fuzzy inference system is classified into 3 fuzzy sets each shown in table 3 There maximum no. of rules for the system can be 243,thus typical rule will look as follows , Ra = aipi +biqi+diri+eisi+fiti +ci (1)
Where pi,qi, ri, si and ti are design parameters referred as consequent parameters. ai is ROCE, bi is EPS, di is P/E ratio, ei is liquidity ratio and fi is ROI . During the training in ANFIS 30 training data is used to conduct 100 cycles of learning, the values of premise parameters for trapezoidal MF in table 4 and that of consequent parameters for trapezoidal MF in table 5
The results shows that average error for recommendation during training is 0.328 % and average testing error is 0.56557.
Table 3: fuzzy sets of input
Input Variables Fuzzy Expressions
ROCE
low medium
high
EPS
low medium
high
P/E Ratio
low medium
high
Liquidity
low medium
high
ROI
low medium
High
Table 4: Premise parameters for fuzzy system for Trapezoidal MF
V W x y
Low -13.085 -4.865 7.465168 15.68492
medium 7.465193 15.68517 28.01498 36.23494
High 28.01499 36.23498 48.565 56.785
EPS V W x y
Low -38.405 -13.945 22.74506 47.20502
medium 22.74521 47.20506 83.89507 108.3551
High 83.89508 108.3551 145.045 169.505
P/E Ratio V W x Y
Low -7.515 -0.135 10.93482 18.31446
medium 10.93616 18.31482 29.38494 36.76378
High 29.385 36.76494 47.835 55.215
Liquidity V W x Y
Low 0.035 0.415 0.985557 1.361148
medium 0.986118 1.36555 1.934751 2.314703
High 1.934736 2.314751 2.885 3.85
ROI V W x Y
Low -13.505 -5.045 7.645136 16.10511
medium 7.64555 16.10514 28.795 37.25499
Fig-1: FIS of the Model Fig-2: ANFIS Structure of the model
VII CONCLUSION:
The proposed model has considered the five financial indicators as a input to the Neuro-Fuzzy system and based on the past quarter results trained to predict the scripts selection. Rules dominating the selection and recommendation model are that
IF ROCE is high and EPS is med and P/E ratio is low and liquidity is low and ROI is high then RECOMMEND is Buy.
This model could be enhanced by considering the key factors such as Risk measurement, Diversification which also plays a vital role in building effective portfolio.
REFERENCES:
1. Http://En.Wikipedia.Org/Wiki/Portfolio_(Finance)
2.
Www.Accountingformanagement.Org/Earnings-Per-Share-Eps-Ratio/
3. P.Divya, P. Ramesh Kumar , “ The Investment Portfolio Selection
Using Fuzzy Logic And Genetic Algorithm, International Journal Of Engineering Research And Applications (IJERA), Vol. 2, Issue 5, September- October 2012, Pp.2100-2105.
4. Oh, K.J., T.Y. Kim, S.H. Min, “Using Genetic Algorithm To
Support Portfolio Optimization For Index Fund Management”, Expert System With Application, 2005,28,Pp 371-379.
5.
Http://Www.Investinganswers.Com/Financial-Dictionary/Technical-Analysis/Return-Investment-Roi-1100
6. Http://Www.Financeformulas.Net/Return_On_Investment.Html
7. Http://Www.Brighthub.Com/Money/Investing/Articles/112657.Aspx
8. M. Gunasekaran , K.S. Ramaswami , “Portfolio Optimization Using
Neuro Fuzzy System In Indian Stock Market” Journal Of Global Research In Computer Science Volume 3, No. 4, April 2012
9. Masoud Mansoury, Bijan Mansoury, Seyyed Alireza Hashemi
Golpayegani, “ Enhanced Decision Support System For Portfolio Management Using Financial Indicators”, International Journal Of Business Information Systems Strategies (IJBISS) Volume 1, Number 1,November 2012.
10. Alberto Fernández, Sergio Gómez “Portfolio Selection Using Neural
Networks”,Science Direct, Elsevier, Journal Of Computers & Operations Research Vol. 34 (2007)
11. Mr.Amitd.Narote, Mr. Lobo. L.M.R.J, “A Mixed Portfolio Theory
Model On Genetic Algorithm And Vector Quantization”,International Journal Of Engineering Research And Applications (Ijera) Issn: 2248-9622
12. Markowitz H., “Portfolio Selection”, Journal Of Finance, 1952, 7 ,
Pp 77-91.
13. J.S.R., Jang, C.T.Sun And E.Mizutani, “Neuro Fuzzy And Soft
Computing: A Computational Approach To Learning And Machine Intelligence”, Prentice Hall, 1997.
14. Topaloglou, N., Vladimirou, H., And Zenios, S. A. (2008). “A
Dynamic Stochastic Programming Model For International Portfolio Management” European Journal Of Operation Research 185(3), 1501–1524.
15. Angela Hei-Yan-Leung, “Portfolio Selection And Risk
Management”, Thesis Submitted To University Of California.2009
16. Talebnia, G. Fathi, M. 2010. “ A Comparative Evaluation Of The
Optimal Portfolio Selection Of Stocks In Tehran Stock Exchange Through The Markowitz Model And The Value At Risk”, Journal Of Financial Studies, 6: 71-94. 12.
17. Nikoomaram H, Hemmati H, 2012. “Network Model Based On