T he Im pact o f O ptical M od u lation
Schem es on Fibre N on-L inearities
in D -W D M S ystem s
Thesis Submitted for the Degree of
Doctor of Philosophy
in Electronic and Electrical Engineering
January 2001
G eorgios E. K atsaros
Departm ent of Electronic and Electrical Engineering
All rights reserved
INFORMATION TO ALL USERS
The quality of this reproduction is dependent upon the quality of the copy submitted. In the unlikely event that the author did not send a complete manuscript and there are missing pages, these will be noted. Also, if material had to be removed,
a note will indicate the deletion.
uest.
ProQuest U643749
Published by ProQuest LLC(2016). Copyright of the Dissertation is held by the Author. All rights reserved.
This work is protected against unauthorized copying under Title 17, United States Code. Microform Edition © ProQuest LLC.
ProQuest LLC
789 East Eisenhower Parkway P.O. Box 1346
I am grateful to Dr. Izzat Darwazeh for his invaluable guidance and support, par
ticularly his willingness to oversee the final stages of this research.
I wish to extend my sincerest thanks to Dr. Phil Lane for his guidance and encour
agement during the period of my studies. Phil introduced me to the field of optical
communications and was there for me, with answers to my questions.
I am grateful to Professor John O ’Reilly for his informative comments and wealth
of knowledge.
A big thank you to Dr. Chris Matrakidis for his help and stim ulating discussions in
the course of my studies.
Financial support for this research has been provided from SDL Integrated Optics
Ltd, together with use of their laboratory facilities. My sincere thanks to Dr. Mike
Murphy for his help during the last four years.
A special mention to my previous tutor Professor Clive Parini whom I consider as
my mentor in electronic engineering.
I would like also to thank Dr. Mick Flanagan for his support during the last phase
of this work.
Finally, I would like to express my deepest appreciation to my parents, Niki and
Nondas who have supported, encouraged and believed in me throughout my time in
This thesis investigates alternative optical modulation schemes and their im pact on
the non-linear effects in a dense WDM optical network. In detail, two alternative
modulation schemes, duobinary and dicode modulation are extensively studied in
the context of optical transmission and their application in WDM optical networks.
Two-level and three-level duobinary modulation schemes are applied to a simple
optical system in order to explore the level of the reduction of Stimulated Brillouin
Scattering (SBS) effects relative to binary transmission. The two duobinary schemes
are compared to each other and to binary transmission and the techniques are as
sessed in terms of system penalties. Two-level duobinary suppresses SBS effects,
giving an eye-opening improvement of 0.25 dB to 1.2 dB relative to binary trans
mission over a range of input power levels. An experimental study follows, where
duobinary modulation is applied in a dense WDM system. The modulation scheme
successfully suppresses the Four Wave Mixing products by a maximum of 3 dB. The
suppression is maintained over a range of channel spacings. An investigation of the
impact of fibre dispersion on Four Wave Mixing products under binary, duobinary
and dicode modulation in a three channel dense WDM system is then performed
through simulation. The interchannel spacing is varied from a maximum of 100 GHz
to a minimum of 37.5 GHz, and the optical power applied to the fibre is also varied
over a typical range of values. Results guide the choice of modulation schemes over
a range of operating conditions. A basic study on the dispersion tolerance of di
code modulation, relative to normal binary transmission is also performed. Dicode
fies the merits and drawbacks of using duobinary and dicode modulation in dense
WDM systems. The thesis comes to a conclusion by summarising the main results
1 In trod u ction 21
1.1 Dense WDM Optical Networks ... 21
1.2 Thesis O rganisation...22
1.3 Outline of Main C o n trib u tio n s... 24
1.4 S u m m a r y ... 26
2 H igh S peed Long H aul O ptical W D M Fibre S y stem s 29 2.1 In tro d u c tio n ...29
2.2 Description of Optical Components F u n c t i o n s ... 30
2.2.1 The Optical F ib r e ... 30
2.2.2 Transm itter T e c h n o lo g y ... 31
2.2.5 Dispersion Compensation ... 33
2.2.6 Optical Amplifiers ... 35
2.2.7 Optical F ilte rs ... 35
2.2.8 Optical Add Drop Multiplexer ( O A D M ) ...36
2.2.9 Optical S w itch in g ...37
2.3 WDM S y s t e m s ...37
2.3.1 Description of a WDM S y stem ... 38
2.3.2 Commercial WDM S y s t e m s ... 39
2.3.3 Experimental WDM Systems ... 41
2.4 Optical F u n c tio n s ... 44
2.4.1 Wavelength Conversion... 45
2.4.2 Optical Signal Monitoring F u n c t i o n s ... 45
2.4.3 Optical 3R R eg e n eratio n ... 45
2.4.4 Network Survivability... 45
2.4.6 Optical Packet S w itching...46
2.5 D iscu ssio n ... 46
2.6 S u m m a r y ... 48
3 D u ob in ary and D ico d e M od u lation 53 3.1 In tro d u c tio n ...53
3.2 The Duobinary C o n c e p t ... 56
3.2.1 Spectral Density of the Duobinary Pulse t r a i n ... 57
3.2.2 Applying the Duobinary Technique to Rectangular Pulses . . 60
3.2.3 Duobinary Implementation in Optical S y ste m s ... 62
3.3 Dicode M o d u la tio n ...70
3.3.1 Dicode Implementation in Optical S y ste m s...73
3.4 D iscu ssio n ... 75
3.5 S u m m a r y ... 78
4.3 The SBS Simulation M odel... 85
4.4 Simulation R e s u l t s ... 90
4.5 D iscu ssio n ... 95
4.5.1 Two-level Duobinary M o d u la tio n ... 96
4.5.2 Three-level Duobinary M o d u la tio n ...98
4.6 S u m m a r y ... 100
5 E xp erim en tal D em o n stra tio n o f th e R ed u ctio n o f F W M w ith D u o b i nary M od u lation 103 5.1 In tro d u c tio n ...103
5.2 Four Wave Mixing ...104
5.2.1 Definition of Four Wave M ix in g ... 104
5.2.2 Impact of Four Wave Mixing on WDM S y s te m s ... 105
5.2.3 Theoretical Background of F W M ... 106
5.3 Experimental Reduction of FWM Effects with Duobinary Coding . . 109
5.3.3 Spectrum Plots for Binary and Duobinary Transmission . . . . I l l
5.3.4 Variation of the FWM Levels under Binary and Duobinary
Transmission for a Range of Channel S p a c in g s... 113
5.4 Duplication of the Experimental Results on OptSim Simulator . . . .1 1 7 5.5 D iscu ssio n ... 122
5.6 S u m m a r y ... 125
6 T h e Im pact o f A ltern a tiv e O ptical M od u lation Schem es on th e L evel o f Four W ave M ixing P ro d u cts in D -W D M S y stem s 129 6.1 In tro d u c tio n ... 129
6.2 Spectral Densities of Binary-Duobinary-Dicode M o d u la tio n ...130
6.3 Simulation M o d e l... 130
6.3.1 Mach-Zehnder M odulator Model in O p t S i m ...133
6.4 Simulation R e s u l t s ... 136
6.5 D isc u ssio n ... 145
7 D isp ersio n Tolerance o f D ico d e M od u lation in O p tical T ransm is
sion S ystem s 151
7.1 In tro d u c tio n ... 151
7.2 Dispersion T o le r a n c e ... 152
7.3 Simulation R e s u l t s ... 153
7.4 D iscu ssio n ... 153
7.5 S u m m a r y ... 157
8 A SW O T A n alysis o f th e M od u lation Schem es considered in th is T h esis 158 8.1 In tro d u c tio n ... 158
8.2 Binary M o d u la tio n ...159
8.2.1 S t r e n g t h s ... 159
8.2.2 W e a k n e s se s ... 159
8.2.3 O p p o rtu n itie s ...160
8.2.4 T h r e a t s ... 160
8.3.1 S t r e n g t h s ... 161
8.3.2 W e a k n e s se s ... 162
8.3.3 O p p o rtu n itie s ...162
8.3.4 T h r e a t s ... 163
8.4 Dicode M o d u la tio n ...163
8.4.1 S t r e n g t h s ... 163
8.4.2 W e a k n e s se s ... 164
8.4.3 O p p o rtu n itie s ...165
8.4.4 T h r e a t s ... 165
8.5 S u m m a r y ...165
9 C oncluding R em arks 169 9.1 Research O u tc o m e s...170
9.1.1 Comparison of the Robustness of Two-Level and Three-Level Duobinary Modulation to S B S ... 171
9.1.3 The Impact of Duobinary and Dicode M odulation on the Level
of the FWM Products in a D-WDM s y s t e m ...173
9.1.4 An Evaluation of the Dispersion Tolerance of Dicode Modu
lation in an Optical Transmission S y ste m ... 173
9.1.5 A Basic SWOT Analysis between Binary, Duobinary and Di
code modulation ... 174
9.2 C o n c lu s io n s... 175
2.1 WDM System D e s c rip tio n ... 38
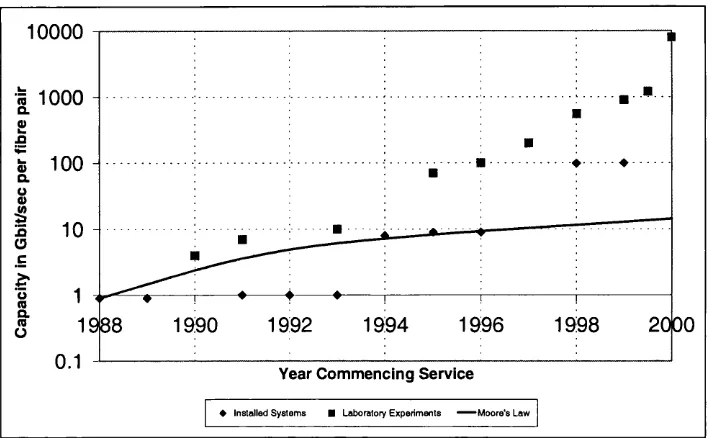
2.2 Transmission Capacity of Laboratory Experiments and Installed Sys tems vs. the Year in which they were Demonstrated or Installed. The line indicates Moore’s Law... 47
3.1 Filter for Generating a Polybinary S ig n a l... 54
3.2 Spectral Density of Binary and Duobinary S ig n a ls ... 61
3.3 Three-Level Electrical Duobinary Transm itter and R eceiver...63
3.4 Eye P attern for Electrical Duobinary S i g n a l ...63
3.5 Electrical Duobinary Transm itter and Receiver for Two-Level Optical Duobinary G e n e r a tio n ... 65
3.6 Operation of the MZ-modulator for a Binary S ig n a l... 65
3.7 Operation of the MZ-modulator for a Duobinary S ig n a l... 67
3.8 Schematic of the Novel Duobinary T ra n sm itte r...68
3.9 Signal at the MZ Electrodes (VI,V2) Resulting the Difference in the MZ Branch V o lta g e s ... 69
3.10 Spectral Density of Binary and Dicode W a v e s ...73
3.11 Electrical Dicode Transm itter and R eceiver... 74
3.12 Dicode Electrical Transm itter ( T x ) ... 75
4.1 First Order Marching Scheme in order to calculate the Wave Fields at Point (z.Az, ( t + l ) A t ) ... 87
4.2 Phase Transition for 19.8 k m ... 88
4.3 Phase Transition for 1 km, Reference M o d e l ... 89
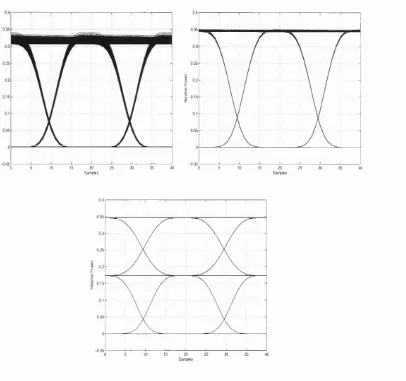
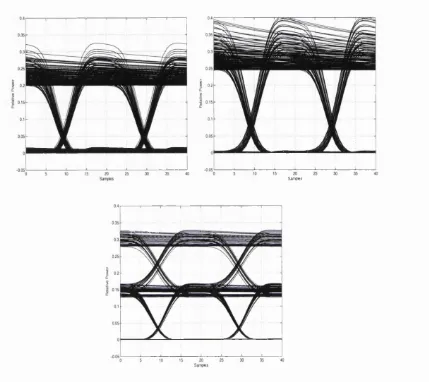
4.4 Eye Diagrams for (a) Binary, (b) 2-Level Duobinary and (c) 3-Level Duobinary Transmission at 7.7 mW of Input P o w e r ... 91
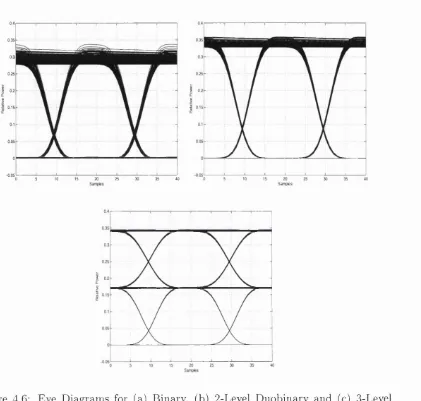
4.5 Eye Diagrams for (a) Binary, (b) 2-Level Duobinary and (c) 3-Level Duobinary Transmission at 11.6 mW of Input Power ...92
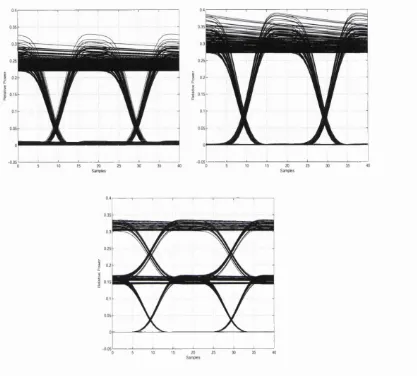
4.6 Eye Diagrams for (a) Binary, (b) 2-Level Duobinary and (c) 3-Level Duobinary Transmission at 15.4 mW of Input Power ...93
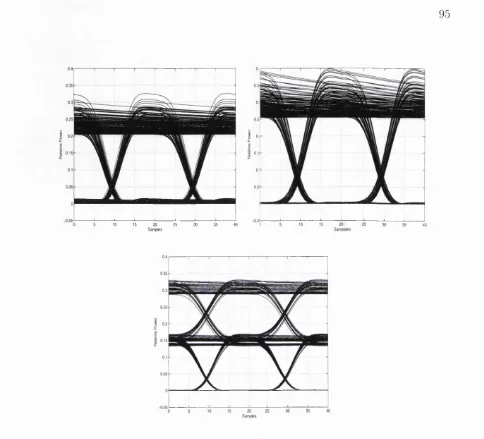
4.8 Eye Diagrams for (a) Binary, (b) 2-Level Duobinary and (c) 3-Level
Duobinary Transmission at 46.2 mW of Input Power ... 95
4.9 Eye Diagrams for (a) Binary, (b) 2-Level Duobinary and (c) 3-Level
Duobinary Transmission at 61.6 mW of Input Power ... 96
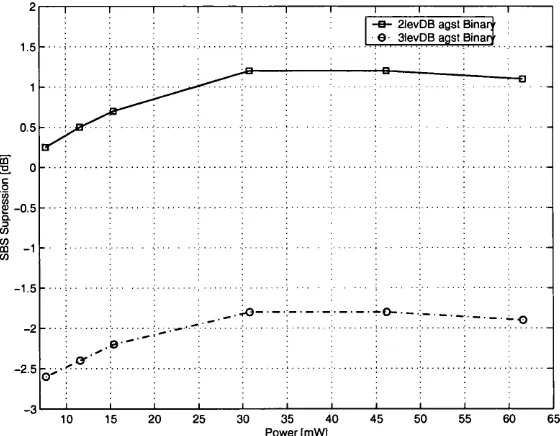
4.10 Suppression of SBS. Solid line indicates gain (dBs) in terms of eye
opening of 2-level duobinary modulation against binary over various
power levels. The dashed line indicates the gain (dBs) for the 3-level
duobinary against binary over various power levels. In the 3-level
duobinary there is an attendant 3 dB penalty... 98
5.1 FWM Efficiency Versus Effective Signal Frequency Difference or Chan
nel Separation [ 2 ] ...109
5.2 The Experimental S e t-u p ... 110
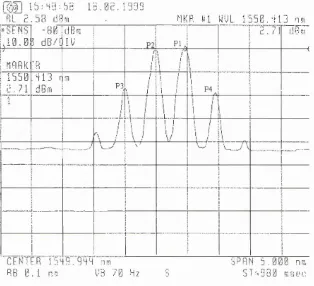
5.3 Spectral Plots at Fibre O utput for Binary Modulation at 50 GHz
Channel S p a c i n g ...112
5.4 Spectral Plots at Fibre O utput for Duobinary Modulation at 50 GHz
Channel Spacing ...113
5.5 Spectral Plots at Fibre O utput for Binary Modulation at 100 GHz
5.6 Spectral Plots at Fibre O utput for Duobinary Modulation at 100 GHz
Channel S p a c i n g ...115
5.7 Average Suppression of FWM Products Relative to Average D ata C h an n e ls... 117
5.8 OptSim Simulator Screen S h o t...119
5.9 Average Suppression of FWM products Relative to Average D ata Channels under Simulation and Laboratory E x p e rim e n ts ...121
6.1 Spectral Density of Binary, Duobinary and Dicode S i g n a l s ... 131
6.2 D-WDM System Under S t u d y ...132
6.3 Validation Circuit of the Transm itter M o d e l ...134
6.4 Electrical Probe O utput for Binary Transmission ... 134
6.5 Electrical Probe O utput for Dicode M o d u la tio n ...134
6.6 Electrical Probe O utput for Duobinary M o d u la tio n ... 135
6.7 Average FWM Products under 132 mW of Power Launched in DS F i b r e ... 137
6.9 Average Suppression of FWM Products Relative to Average D ata
Channels under 132 mW of Power Launched in DS F i b r e ...139
6.10 Average FWM products under 90 mW of Power Launched in DS Fibre 140
6.11 Average Suppression of FWM Products Relative to Average D ata
Channels under 90 mW of Power Launched in DS Fibre... 140
6.12 Average FWM Products under 132 mW of Power Launched in Zero
Dispersion F ib re ... 141
6.13 Average Suppression of FWM Products Relative to Average D ata
Channels under 132 mW of Power Launched in Zero Dispersion Fibre 141
6.14 Average FWM Products under 90 mW of Power Launched in Zero
Dispersion F ib r e ... 142
6.15 Average Suppression of FWM Products Relative to Average D ata
Channels under 90 mW of Power Launched in Zero Dispersion Fibre . 142
6.16 Average FWM Products under 132 mW of Power Launched in Stan
dard F i b r e ... 143
6.17 Average Suppression of FWM Products Relative to Average D ata
Channels under 132 mW of Power Launched in Standard Fibre . . . . 143
6.18 Average FWM Products under 90 mW of Power Launched in Stan
6.19 Average Suppression of FWM Products Relative to Average D ata
Channels under 90 mW of Power Launched in Standard Fibre . . . . 144
6.20 Summary of Results for 0.3 and 0.4 nm Spacing. Recommends
use of the Modulation Scheme under the Operating Conditions, x
Indicates Modulation Scheme is not Optimum, f Indicates Marginal
Situation... 148
6.21 Summary of Results for 0.5 and 0.6 nm Spacing,
yj
Recommendsuse of the Modulation Scheme under the Operating Conditions, x
Indicates Modulation Scheme is not O ptim um ...149
6.22 Summary of Results for 0.8 nm Spacing, y Recommends use of
the Modulation Scheme under the Operating Conditions, x Indicates
Modulation Scheme is not O ptim um ... 149
7.1 Eye-diagrams for Back-to-Back Transmission: Left for Binary, Right
for Dicode M odulations... 154
7.2 Eye-diagrams after 35 km Transmission: Left for Binary, Right for
Dicode M odulations...154
7.3 Eye-diagrams after 50 km Transmission: Left for Binary, Right for
Dicode M odulations...155
7.4 Eye-diagrams after 70 km Transmission: Left for Binary, Right for
7.5 Eye-diagrams after 80 km Transmission: Left for Binary, Right for
2.1 Indicative Characteristic D ata for some Types of Single Mode Fibres. 31
2.2 Characteristic D ata for Commercial D-WDM Systems... 40
2.3 Characteristic D ata of the most recent Experimental D-WDM Systems. 42
3.1 Example of Original Binary, 3-Level Duobinary, Optical 2-Level Duobi
nary, Receiver 0 / P Signal... 67
3.2 Example of Original Binary, 3-Level Dicode, Optical Dicode, Receiver
0 / P Signal... 75
5.1 Levels of the Optical Signals in the Binary and Duobinary Case for
50 GHz Channel S p a c in g ...113
5.2 Levels of the Optical Signals in the Binary and Duobinary Case for
100 GHz Channel S p a c in g ...114
5.3 Experimental Results for Binary M o d u la tio n ... 116
5.4 Experimental Results for Duobinary M o d u la tio n ... 116
5.5 Simulation Param eters were set Equal as those of Experiment . . . . 118
5.6 Calculation of Component Losses in the Experimental S e t-u p ...120
In trod u ction
1.1
D en se W D M Optical N etw orks
In order to meet the huge capacity demands imposed on the core transmission
network by the explosive growth in data communications, the number of optical
channels in dense WDM optical networks is being increased [1, 2, 3]. Since the gain
bandwidth of EDFAs is limited (1525-1607 nm) [1], these requirements for a very
large number of channels mean th at the channel spacing will have to be small.
The current ITU grid specifies a 100 GHz channel spacing, but dense WDM systems
are being considered with 50 GHz to 25 GHz channel spacing [2, 4]. For these systems
the linear and non-linear properties of the optical fibre can induce serious system
impairments limiting the performance of dense WDM systems.
The research presented in this thesis is concerned with the application and im
plementation of alternative m odulation schemes in dense WDM optical systems in
order to suppress the non-linear effects of the optical fibre, while in the same time
controlling the spectrum of the signal. In detail, duobinary and dicode modulation
schemes are considered in dense WDM systems and their impact on Stimulated
Brillouin Scattering and Four Wave Mixing effects.
1.2
T hesis O rganisation
Following this brief introduction, chapter two provides a review of high speed long
haul optical WDM fibre systems. Here, the fundamental structure and properties of
WDM systems are examined together with the building blocks of such systems. In
particular, attention is drawn to the structure of record breaking experimental dense
WDM systems th a t are involved in T erabit/s capacity experiments. The chapter
concludes with a discussion on the trends of dense WDM optical networking.
Building upon this, chapter three is a study of duobinary and dicode modulation
schemes. Fundamental properties of both the schemes are presented together with
a m athem atical analysis, leading to spectral density formulas for each modulation
scheme. Implementation approaches for the modulation techniques in optical sys
tems are discussed. The chapter concludes with a brief review of the reported merits
of using duobinary modulation in optical systems.
Chapter four presents a comparison of the robustness between two-level and three-
In th a t context, equations th at describe the effect are presented. Duobinary modu
lation is applied in order to suppress the onset of the SBS effect and this is studied
using simulation techniques. The discussion section of the chapter brings out the
findings and their significance to optical systems.
Having looked at scattering fibre non-linear effects, chapter five moves to the im
pact of duobinary modulation on Kerr effects. An experimental demonstration of
the reduction of Four Wave Mixing (FWM) products with duobinary modulation is
presented. An analysis of the FWM effects and their impact on WDM systems is
also included. It is shown th at duobinary modulation can offer im portant benefits
to dense WDM systems by significantly reducing the FWM non-linear effects. Sim
ulation results are also taken based on the experimental arrangements in order to
provide confidence in the experimental measurements.
Chapter six presents a simulation-based investigation of the impact of alternative
modulation schemes on the level of FWM products in dense WDM systems. Both
duobinary and dicode modulation schemes are considered in a three channel dense
WDM system, and parameters such as linear fibre dispersion, fibre input power and
channel spacing are varied. The aim of this chapter is to investigate the variation
of the FWM products for the modulation schemes, identify factors th a t infiuence
these variations, and to produce a guide to the choice of modulation schemes for a
range of operating conditions.
Chapter seven investigates, in basic terms, the impact of fibre linear dispersion on
system.
Chapter eight builds on the previous chapters and is a SWOT (Strengths, Weak
nesses, O pportunities and Threats) analysis of the alternative modulation schemes
relative to binary transmission in the context of WDM systems. The analysis iden
tifies the advantages and disadvantages of applying the modulation techniques to
dense WDM systems. This analysis can possibly influence network planners in mak
ing their decision to implement the alternative modulation schemes considered, in
order to overcome some of the limitations th at dense WDM networks face.
Finally, chapter nine concludes the thesis by summarising the main findings of the
research and provides suggestions for further work.
1.3
O utline o f M ain C ontributions
The major contributions resulting from this work may be summarised as follows:
• A comparison of the robustness of two-level and three-level duobinary mod
ulation to Stimulated Brillouin Scattering is presented. This comparison is
made between the two types of duobinary modulation relative to normal bi
nary transmission.
• An experimental demonstration of the reduction of Four Wave Mixing effects
with two-level duobinary modulation in a two-channel dense WDM system.
The experiments are also duplicated using a simulation tool.
• The impact of duobinary and dicode modulation schemes on the FWM prod
ucts of a dense WDM system, and the influences which parameters such as
flbre input power, channel separation and flbre dispersion play on the FWM
products. A guide of choice between binary, duobinary and dicode modulation
under different system operating conditions is developed from this study.
• An evaluation of the dispersion tolerance of dicode modulation in a simple
optical transmission system. This tolerance is investigated over various lengths
of standard flbre, relative to binary transmission.
• A SWOT analysis, between binary, duobinary and dicode modulation schemes
in the context of dense WDM systems.
The contributions made during the course of this research have led to the following
publications:
1. G. Katsaros, P. Lane, M. Murphy, M. Green, P. Jiang, ’’Experimental demon
stration of the reduction of FWM with duobinary m odulation” , 25th European
Conference on Optical Communication (ECOC), Volume I, pages 1-402, 1-403,
France, September 1999.
2. G. Katsaros, P. M. Lane, M. Murphy, ”Investigation and Modelling of FWM
effects in various flbre types under Partial response Signalling using the Opt-
with 26th European Conference on Optical Communication (ECOC), Ger
many, September 2000.
3. G. Katsaros, P.M. Lane, M. Murphy, ” A comparison of the impact of FWM
on binary, duobinary and dicode modulation in DWDM systems” , 13th IEEE
Lasers and Electro-Optics Society (LEOS) Annual Meeting, Volume 1, pages
27-28, USA, November 2000.
4. G. Katsaros, P.M. Lane, M. Murphy, ’’The Impact of Alternative Optical
Modulation Schemes on the Level of Four Wave Mixing Products in DWDM
Systems” submitted for publication in lEE Proceedings-Optoelectronics, mi
nor corrections required are pending.
5. G. Katsaros, C. Matrakidis, P.M. Lane, P. Jiang, M. Murphy, ”Comparison
of the robustness of 2-level and 3-level duobinary modulation to stimulated
Brillouin scattering” subm itted for publication in 35th Annual Conference
on Information Sciences and Systems (CISS), The Johns Hopkins University,
USA, March 2001.
1.4
Sum m ary
This chapter has outlined the motivation and background for the investigation of the
impact of optical modulation schemes on fibre impairments in dense WDM optical
systems. Having outlined the structure of the thesis and provided a summary of the
[1] B. C. Collings, M. L. Mitchell, L. Boivin, W. H. Knox, ”A 1021 Channel WDM
System” , IEEE Photonics Technology Letters, Vol. 12, No. 7, pages 906-908,
July 2000.
[2] H. Suzuki, J. I. Kani, H. Masuda, N. Takachio, K. Iwatsuki, Y. Tada, M.
Sumida, ” l-T b /s (100 x 10 G b/s) Super-Dense WDM Transmission with 25-
GHz Channel Spacing in the Zero-Dispersion Region Employing Distributed
Raman Amplification Technology” , IEEE Photonics Technology Letters, Vol.
12, No. 7, pages 903-905, July 2000.
[3] R. C. Alferness, H. Kogelnik, T. H. Wood, ’’The Evolution of Optical Systems:
Optics Everywhere” , Bell Labs Technical Journal, pages 188-202, January-
March 2000.
[4] K. Imai, T. Tsuritani, N. Takeda, K. Tanaka, N. Edagawa, M. Suzuki, ”500
G b/s (50 X 10.66 G b/s) WDM Transmission Over 4000 km Using Broad-Band
EDFA’s and Low Dispersion Fiber” , IEEE Photonics Technology Letters, Vol.
12, No. 7, pages 909-911, July 2000.
H igh Speed Long H aul O ptical
W D M Fibre S ystem s
2.1
Introduction
Optical network planning activities have to reflect a variety of physical, as well as
practical, conditions and constraints in order to produce useful results. Among
the activities is a set of available optical functions which are to be used for the
construction of the optical networks.
In this chapter, the state of the art optical functions, as they are available now,
or will be in the near future, are presented. The performance characteristics of
available WDM systems are discussed together with powerful WDM systems which
are involved in Terabit capacity laboratory experiments.
The state of the art optical components and the roles th a t they take in WDM
systems are progressing very rapidly. Thus it is necessary to update the information
on the presently available optical functions fairly often.
2.2
D escription o f O ptical C om ponents Functions
2.2.1 T he O ptical Fibre
All optical networks are based on a passive fibre infrastructure which serves as the
physical transport medium between the network nodes. The most relevant properties
of the transmission fibres are attenuation, dispersion, and non-linearities. Standard
single mode fibres (SMF) as well as dispersion shifted (DSF), dispersion compen
sating (DCF), non zero dispersion (NZDF) fibres are commercially available with
standardised properties according to ITU-T recommendations. True Wave, LEAF,
Teralight, are some of the innovative fibres available th a t mainly treat dispersion and
non-linearities of SMF. In table 2.1 below indicative characteristic d ata of various
Table 2.1: Indicative Characteristic D ata for some Types of Single Mode Fibres. Name Zero Disp. A Disp. Goeff. at 1.55//m Disp. slope
ifim)
(ps/nm /K m ) (ps/nm ^/K m )SMF 1.55 16 to 17 0.059
DSF 1.55 <-2.7 0.066
LEAF 1.53 1 to 6 0.09
NZDSF 1.52 3 to 3.8 0.09 to 0.092
DGF 1.55 -108 to -73.2 -0.81 to -0.28
TrueWave 1.55 5.6 0.037
Teralight 1.55 8 0.057
2.2.2
Transm itter T echnology
Laser D io d e w ith D irect M o d u la tio n
The standard optical transm itter element in WDM systems is a laser diode. In
tegrated laser modulation or direct modulation offers a high dispersion tolerance
through the use of an electroabsorption m odulator on the same laser chip. Key
features of these devices include, optical output power in the range of 0 to +10 dBm
and accuracy of optical frequency of 0.05 nm [4, 5].
Laser D io d e w ith E xtern al M o d u lation
External modulation is mostly used in optical systems since it reduces the chirp
of the optical transm itter therefore increasing its dispersion tolerance. Modulators
are commercially available operating at bit rates of 20 G bit/s and laboratory ex
periments with modulation bandw idth of 100 GHz have been demonstrated. Some
2.2.3
O ptical R eceiver
Optical receivers are mainly PIN photodiodes and are found in optical line term i
nations and in transponders where they convert the optical signal into the electrical
domain. Optical receivers reach sensitivities around -30 dBm for 2.5 G bit/s, -25
dBm for 40 G bit/s transmission [6].
2.2.4
W D M M ultip lexers-D em u ltiplexers
Wavelength multiplexers are specialised devices th at combine a number of optical
streams at distinct wavelengths and launch all their powers in parallel into a single
fibre channel. Multiplexers must have little loss, preferably no loss. Demultiplexers
divide a composite multiwavelength optical signal into different output fibres ac
cording to wavelength with minimum splitting loss. Two main types of multiplexers
or demultiplexers exist, the Phased Array Based Multiplexers and the Fibre Grating
Multiplexers.
P h ased A rray B ased M u ltip lex ers\D em u ltip lex ers
This device is based on an arrayed waveguide grating. It consists of input and
output slab waveguides and two identical focusing planar star couplers connected
by grating array waveguides. The length of the grating array waveguides differ by a
constant value AL [5]. This device can function as a multiplexer, a demultiplexer,
Fibre G rating M u ltip lex ers\D em u ltip lex ers
A fibre grating is another device th a t can be used as a multiplexer, a demultiplexer,
or an add/drop element [5]. Fabrication of these devices is based on the inherent
photosensitivity of conventional germanium-doped silica fibres. When a wavelength
satisfying the Bragg condition encounters the grating, the energy from this wave
length is reflected and all others pass through the device with low loss. To extract
the desired wavelength, a circulator is used in conjunction with the grating [5].
2.2.5
D ispersion C om pensation
Fibre chromatic dispersion is the effect which limits the transmission length in op
tical links. The origin of the effect is the variation of the group delay as a function
of the optical frequency [6]. In fibre optical transmission lines the dispersion effect
increases linearly with the fibre length and width of the optical spectrum and causes
pulse distortion and bit interference. Since chromatic dispersion is a linear effect it
can be compensated for by inserting additional appropriate optical elements into the
transmission link [6]. These elements can be specially fabricated optical fibre with
negative dispersion value and/or fibre gratings. Moreover, modulation or coding
techniques can be applied to the electrical signal before transmission, to minimise
D isp ersio n C om p en satin g Fibre (D C F ) and N on-Z ero D isp ersio n Fibre
(N Z D F )
Dispersion compensating fibre is a special type of fibre which for light in the 1550
nm wavelength region has negative dispersion coefficient in the order of -80 ps/(nm
km). Mixtures of SMF and DCF are used to compensate for dispersion in fibre
spans and dispersion maps th at bring the total dispersion of the link close to zero
are created with mixing the SMF with the DCF or other special use fibres. DCF is
commercially available in large quantities [2].
Other types of fibre exist th at compensate for the dispersion slope, one of which is
the reduced dispersion slope fibre TrueWave with dispersion of 5.6 p s/n m /k m and
dispersion slope 0.037 ps/nm ^/km [1, 3].
Non-Zero Dispersion fibre seems to be the choice for future optical systems due do
to low dispersion and non-linearities. NZDF does not need dispersion compensation
as often as standard fibre. As an example for 40 G b it/s transmission NZDF needs
dispersion compensation at six times longer fibre length than standard fibre [6].
C hirped B ragg Fibre G ratings
Another option for dispersion compensation is by the use of chirped Bragg fibre
gratings. These devices provide a low loss solution. Their non-linearities are around
zero and th a t makes them attractive for the high bit rate systems together with the
Signal Form ats
Modulation and coding techniques are reported, th at allow the signal to achieve
dispersion tolerance. The most well known technique is duobinary modulation.
Duobinary modulation is one of the subjects of study in this thesis and its principles
are extensively covered in the following chapters.
2.2.6
O ptical Am plifiers
Erbium doped fibre amplifiers (EDFAs) are one of the building blocks for WDM sys
tems since they allow the power amplification of all the signals in the WDM channels.
The most im portant properties of an EDFA include, power gain, saturated output
power, noise figure and optical bandwidth. The power gain is calculated as the
ratio of output to input signal power of the amplifier, and this value determines the
spacing between amplifiers, typical values vary from 20 dB to 30 dB. The saturated
output power of the amplifier is the upper limit of the total output power from the
amplifier for high input power [4, 7].
2.2.7
O ptical Filters
The optical filter is the basic building block of WDM systems, providing the neces
sary wavelength selection to isolate independent channels. The transmission char
acteristics of the filter are very im portant as they have a significant effect on the
systems include, fixed interference filters, tunable Fabry-Perot filters and grating
based filters. Some of the basic concepts of grating based optical filters are [4, 6]:
Fibre B ragg G rating F ilters
These filters are based on photosensitivity in Ge-doped core optical fibres. Fibre
Bragg gratings have proven successful as line filters, and advantages include low loss,
with a narrow pass band characteristic in the order of 0.5 nm and low cost. Tuneable
filtering is achieved by stretching the fibre where the Bragg filter is deposited [4].
D iffraction G ratings
G rating devices are suited to address several wavelengths simultaneously since they
pass a discrete set of predefined wavelengths. Two types of gratings exist, the
Arrayed Waveguide Grating (AWG) with typical insertion loss of 5 dB and crosstalk
of 25 dB and the micro-optic diffraction grating with typical insertion loss of 3 dB
for each channel with a -30 dB adjacent crosstalk level. Gommercial components
are available, th at filter channels spaced at 0.8 nm or 100 GHz [4].
2.2.8
O ptical A dd D rop M u ltip lexer (G A D M )
Optical add drop multiplexers are key elements in achieving network management.
This is facilitated by wavelength multiplexed transmission, in which narrow band
anywhere in the optical link. Recently there have been reported, OADMs th a t can
add-drop 40 channels at 100 GHz spaced, with dynamic equalisation devices [4].
2.2.9 O ptical Sw itching
Switching matrices are available which are suited for realising flexible optical add
drop multiplexers and optical crossconnect (OXC) operations. Various approaches
have been followed to perform the switching functions. Devices relying on mechan
ical operation contain motors and electro-statically or piezo-electrically deflected
micro mirrors for the switching of the optical signal. There are other approaches
followed in realising the switching, using therm al or electro-optic technology [4, 8].
The switching times vary for every other technology from less than 2 ms up to 500
ms for the mechanical switches. Insertion losses vary from 2 dB up to 8 dB for the
thermal and electro-optic switches and channel isolation figures vary from 30 dB to
60 dB for the mechanical switches [4, 8].
2.3
W D M System s
This section describes what is generally called a WDM point-to-point system. Rep
resentative commercial and experimental WDM systems are compared and finally,
2.3.1
D escription o f a W D M S ystem
Some WDM systems are bi-directional consisting of multi fibre pairs with in-line
amplification. Figure 2.1 shows a WDM system consisting of two fibre pairs, one
for each direction [4]. Each of the optical signals coming from the SDH terminals
provide a wavelength compatible signal to the WDM terminal. The WDM terminal
contains a multiplexer and a booster for each direction and a demultiplexer and pre
amplifier at its other side. The optical multiplex is launched into the transmission
fibre and regularly amplified. The optical amplifiers are spaced between 50 to 100
km. Another WDM terminal similar to the first one is placed at the end of the line
and the signals are received by the SDH terminal.
SDH
SDH
W DM Terminal
_Q_
J2L
-Q_ _Q_
_Q_ _Q_
amplifier amplifier
W DM Terminal
SDH
SDH
Figure 2.1: WDM System Description
One way to manage a WDM system is by using an Optical Supervisory Channel
(OSC) at a wavelength which is dedicated to transporting fault, configuration and
performance information. This channel is processed in the WDM terminal sites and
2.3.2
Com m ercial W D M S ystem s
Commercial systems have been announced with Terabit/s capacities and with ninety
(90) optical channels. Some of the systems accept 40 G bit/s, 10 G b it/s and 2.5
G b it/s input rates and possibly lower rates of 622 M bit/s or even 155 M bit/s. In
terms of SDH equipment the maximum bit rate per channel is 40 G bit/s, STM-256.
However, equipment for STM-256 are not commercially available as yet.
ITU-T recommendations address four or eight optical channels, extended to 16 or
32 channels, multiplexed together. The channel grid is defined from the ITU with
100 GHz or 0.8 nm interchannel spacing and recommendations are shifting towards
50 GHz or 0.4 nm [4].
Table 2.2 below shows a comparison between some representative commercial avail
able WDM systems on which information is publicly available. It indicates the
supplier and the name of the product, the maximum system bit rate capacity, the
number of optical wavelengths and the maximum transmission distance, which de
pends on the number of cascaded spans. The availability of these systems vary
together with the maximum span, depending on the type and characteristics the of
fibre.
WaveStar OLS 400G WDM system from Lucent Technologies can support up to
eight fibre spans of 80 km each [9].
Nortel, state for their OPTera Long Haul 4000 system a maximum span without
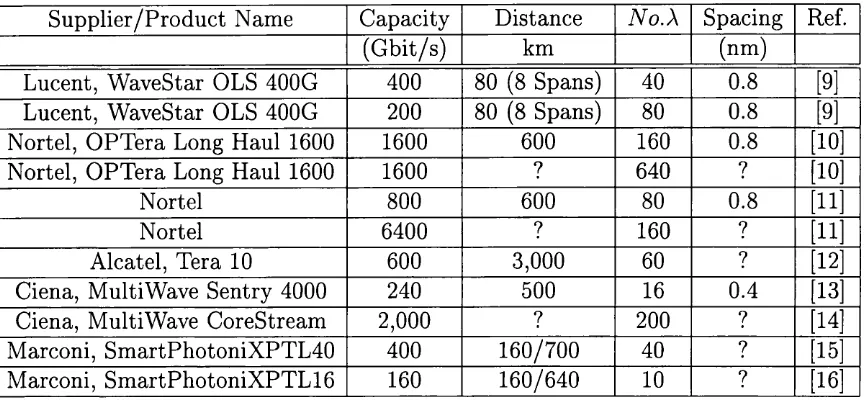
Table 2.2: Characteristic D ata for Commercial D-WDM Systems.
Supplier/Product Name Capacity Distance
No.X
Spacing Ref.(G bit/s) km (nm)
Lucent, WaveStar OLS 400G 400 80 (8 Spans) 40 0.8 [9] Lucent, WaveStar OLS 400G 200 80 (8 Spans) 80 0.8 [9]
Nortel, OPTera Long Haul 1600 1600 600 160 0.8 [10]
Nortel, OPTera Long Haul 1600 1600 ? 640 ? [10]
Nortel 800 600 80 0.8 [11]
Nortel 6400 ? 160 7 [11]
Alcatel, Tera 10 600 3,000 60 7 [12]
Ciena, MultiWave Sentry 4000 240 500 16 0.4 [13]
Ciena, MultiWave CoreStream 2,000 7 200 7 [14]
Marconi, SmartPhotoniXPTL40 400 160/700 40 7 [15]
Marconi, SmartPhotoniXPTL16 160 160/640 10 7 [16]
at 10 G b it/s for each channel, giving a total system capacity of 800 G b it/s over 600
km of fibre. The channel spacing is at the ITU standard, i.e. 100 GHz or 0.8 nm
[10]. Another system th at will soon be commercially available has 160 channels at
a rate of 10 G bit/s per channel, giving a total system capacity of 1.6 T b it/s over
600 km of fibre at a closer channel spacing of 50 GHz or 0.4 nm [10]. In the longer
term, a system of 6.4 T b it/s capacity will become available, with 160 channels at a
rate of 40 G bit/s for each channel. The total system span and the amplifier spacing
together with details of the channel spacing are not presently available [11].
Alcatel’s, Tera 10 [12] has 400 G b it/s system capacity and repeaters are spaced every
55 km. The maximum system span is 3,000 km. Moreover, their Tera 10 system can
support eight fibre pairs, therefore a total capacity of 4.8 T b it/s. System OALW40
from Alcatel [12], supports 16 channels of 2.5 G b it/s per channel capacity. Repeaters
Finally, Marconi’s SmartPhotoniX PTL40 system can reach a total span of 700 km
with optical amplifiers but no regenerators. The same system can reach a total of
160 km with no optical amplifiers present [15]. Sm artPhotoniX PTL16 can reach
up to 640 km with optical amplifiers (no regenerators present) and a total of 160
km with no optical amplifiers [16].
The management of these optical systems is done using software interfaces which
allow access to the system state and the OSC channel is used, in most systems,
to transfer data. Each terminal or amplifier site can be accessed either directly or
remotely [4, 9, 10, 16].
2.3.3
E xperim ental W D M S ystem s
In this section, the multi-Terabit WDM transmission experiments are reviewed.
There are several transmission experiments performed th at reach up to 7 T b it/s
capacities on a single fibre [20]. Capacities in the orders of 1 to 5 T b it/s are widely
reported and are realised with different techniques but in most cases by utilising
both the C and L bands of the EDFAs. Table 2.3 below summarises some of the
highest capacity experimental systems reported to date.
The Siemens 7 T b it/s [20] experiment is realised over 50 km of NZDSF, by 176
optical channels at a 40 G bit/s rate for each channel. The 40 G bit/s electrical
transmission is achieved with 4 x 10 G b it/s time division multiplexing technology
(ETDM). DCF is used to compensate for the dispersion in the receiver site. The
east-Table 2.3: Characteristic D ata of the most recent Experimental D-WDM Systems.
Experiment Capacity Distance
No.X
Spacing Bands Ref.(T bit/s) km (nm)
Siemens 7 50 (NZDSF) 176 0.4 G/L [20]
Alcatel 5.12 300 (TeraLight) 128 0.6/0.4 G/L [19]
NEC 6.4 186 160 0.4 G/L [18]
Nortel 1.28 1,000 (NDSF) 32 0.8 G [21]
KDD 2 2,700 100 (RZ) 0.25 G [22]
TyCom 1.12 6,200 56 1.34/0.67 G [23]
Fujitsu 2.1 7,221 (zero D slope) 211 0.3 G/L [24]
bound and the other, westbound. Eastbound channels are tuned to 0.8 nm and
westbound channels tuned at 0.4 nm interleaved.
The 5.12 T b it/s experiment from Alcatel [19], has 128 channels at 40 G b it/s each,
where the 40 G bit/s are reached through ETDM. The experiment was carried on
300 km of specialist TeraLight fibre with minimum non-linear effects. DGF is used
in the transm itter site in order to compensate for the dispersion of the TeraLight
fibre. The 128 optical channels were alternatively spaced at 0.4 and 0.6 nm. The
channels were aggressively filtered at the receiver site by using 30 GHz, 3 dB optical
filters, tuned away from the carrier to the sidebands.
The 6.4 T b it/s experiment from NEC Corporation [18], uses 160 channels of 40
G b it/s over 186 km of specialised RDF fibre. The success of the experiment relies
on the polarisation interleave multiplexing used at the transm itter site. This was
achieved by the use of an autom atic polarisation controller and a polarisation beam
splitter. RDF fibre has dispersion value (at wavelength of 1550 nm) -15.6 ps/nm /km ,
spans of RDF fibre were used in the experiment and for each span the accumulated
dispersion value summed nearly to zero.
Nortel’s 1.28 T b it/s experiment [21], was implemented by 32 channels of 40 G bit/s
ETDM transm itters over five 160 km spans and a 200 km span, in total 1,000
km of NDSF. The dispersion compensation was achieved by using negative slope
dispersion compensating modules (DCM). No regenerators were used and optical
amplifiers were spaced at 160 km. The m odulated data was in the Return to Zero
(RZ) format.
KDD laboratories 2 T b it/s experiment [22] was realised by 100 channels of 20 G b it/s
each, and were very narrowly spaced at 35 GHz or 0.25 nm. The data format was
20 ps RZ, through nine fibre spans or a total of 2,700 km over dispersion flattened
fibre. The dispersion flattened fibre was realised by combining two kinds of fibre,
enlarged positive dispersion fibre and dispersion slope compensating fibre (SCF)
th a t form a dispersion flattened transmission path. DCF fibre was also applied at
the transm itter and receiver sites. The optical channels were launched at the fibre
in orthogonal states of polarisation.
TyGom reported a 1.12 T b it/s experiment [23], over 6,200 km (a typical trans-
Atlantic distance) with LEAF and inverse dispersion fibre of D = -40 ps/nm /km .
Adjacent optical channels were launched with orthogonal states of polarisation and
the modulation format was Chirped Return to Zero (CRZ) where the bits alternate
in phase at a rate of 20 G bit/s of a total 56 channels. There are a total of 11
(FEC) was used, at a channel spacing of 0.67 nm. All C band of the EDFA was
utilised.
Fujitsu, set up a 2.1 T b it/s experiment [24] which was realised by wavelength mul
tiplexing 211 channels of 10 G b it/s bit rate. Equal channel spacing was used with
adjacent channels spaced at less than 0.4 nm. FEC code was used together with
RZ transmission. Adjacent channels were launched orthogonally polarised. Total
transmission length was 7,221 km with 80 km amplifier spacings.
Concluding, the recent reported experimental dense WDM systems indicate th at
there is a great challenge of building ultra fast high capacity optical transmission
systems. The record breaking system of 7 T b it/s from Siemens together with systems
from Nec and Alcatel of 6.4 T b it/s and 5.12 T b it/s respectively set the trend for
future commercial optical transmission systems.
2.4
Optical Functions
In this section, the optical functions th a t are required for optical networking are
identified. These functions are either considered as necessary or simply as desirable.
2.4.1
W avelength Conversion
Optical conversion, converts the optical frequency of an optical channel on a WDM
combiner from its original position at the input signal combiner to another position
at the output signal combiner. This property improves flexibility in the optical
network by the use of wavelength domain switching on optical cross connects and
optical add-drop multiplexers [4, 8].
2.4.2
O ptical Signal M onitoring Functions
Optical signal monitoring determines bit error rates (BER), frequency accuracy,
frequency stability and detects failures. It is a necessary function to assure quality
of service (QoS) in the optical network [4, 8].
2.4.3
O ptical 3R R egeneration
This function performs optically ampliflcation, reshaping and retiming of the optical
signal. It is an im portant feature in order to increase the cascability of network
operation devices such as add-drop multiplexers [4, 17].
2.4.4
N etw ork Survivability
Network survivability ensures the fast recovery of the network from a failure, using
with QoS, by re-routing traffic on the network via alternative available routes [4, 8].
2.4.5 M anagem ent Functions
These functions allow the management of an optical network element by an inte
grated network management system, via standardised management interfaces when
ever possible [4].
2.4.6 O ptical Packet Sw itching
Optical packet switching performs dynamic switching of optical packets and is re
quired to enable high speed optical packet networks. Improvements in the areas of
optical signal processing including optical addressing, optical headers and optical
switches are required in order to realise this function [4].
2.5
D iscussion
This chapter reviews the dense WDM systems both, in the current commercially
available applications and in future optical networks based on the impressive WDM
laboratory experiments.
Figure 2.2 shows the transmission capacity of laboratory experiments and installed
systems over the years of deployment or laboratory demonstration. The growth rate
growth was and is maintained from the evolution of WDM technology in conjunction
with major breakthroughs in the optical components technology.
10000
■5 1000
-100
-19:90 19:94 19:98 2000
Year Commencing Service
4 Installed S ystem s ■ Laboratory Experim ents ^ — M oore's Law
Figure 2.2: Transmission Capacity of Laboratory Experiments and Installed Systems vs. the Year in which they were Demonstrated or Installed. The line indicates Moore’s Law.
The capacity of dense WDM systems will most possibly continue to increase at
impressive T b it/s units in the laboratory experiments and soon T b it/s systems
will become commercially available. In this direction, leading manufacturers have
already started advertising T b it/s systems over a single fibre and the record breaking
Siemens, bi-directional transmission experiment of 7.04 T b it/s over 50 km of NZDSF
[20] sets the challenge for any future experiments.
However, fundamental limitations will exist, such as dispersion management, EDFA
bandwidth, non-linear effects of the fibre, which will limit the capacity of the WDM
equalisation, use of EDFA C and L bands, fabrication of dispersion flattened flbre
and modulation formats which have made possible the demonstration of the T b it/s
capacities but these developments need to continue in order for the systems to grow
in both capacity and span. Moreover, more optical functions have to be introduced
to the future optical networks in order to make them fully functional. Some of these
functions are already available and others are still in the development stage.
This thesis will further explore how modulation formats impact the Kerr and scat
tering effects of the optical flbre and what im pact the modulation formats can have
on increasing the capacity of dense WDM systems, by suppressing some non-linear
effects. Modulation formats can and will play a role in the ease of limitations th at
restrict dense WDM systems.
2.6
Sum m ary
This chapter reviewed the available optical components, the state of the art WDM
point-to-point systems in commercial applications, laboratory experiments and basic
optical functions. Some of these functions are desirable to increase the functionality
of the optical networks and most of them are in their development stage.
In the following chapters, work carried towards reducing impairments of the optical
flbre by using modulation formats is presented. The next chapter describes these
[1] W. Gardner, ’’Fibres for High Capacity Systems” , 25th European Conference on
Optical Communication (ECOC), Volume II, pages 11-270-273, France, Septem
ber 1999.
[2] Corning, Corning Incorporated Telecommunications Products Division, Corn
ing Optical Fiber, Product Information Leaflets, 1999.
[3] L. Cruner-Nielsen, S. N. Knudsen, B. Edvold, P. Kristensen, T. Veng, D. Mag-
nussen, ” Dispersion Compensating Fibres and Perspectives for Future Develop
ments” , 26th European Conference on Optical Communication (ECOC), Vol
ume 1, pages 91-94, Germany, September 2000.
[4] Euroscom Project P709, ’’Planning of Full Optical Network” , Deliverable 1,
January 1999.
[5] C. E. Keiser, ” A Review of WDM Technology and Application” , Optical Fibre
Technology, No. 5, pages 3-39, 1999.
[6] D. M. Spirit, M. J. O ’Mahony, ’’High Capacity Optical Transmission Ex
plained” , John Wiley and Sons, 1996.
[7 [8 [9 10 11 12 13 14 15 16
J. M. Senior, ’’Optical Fiber Communications Principles and Practice” , Prentice
Hall, second edition, pages 526-528, 1992
I. Rubin, J. Ling, ’’Surviable-All Optical Cross Connect Meshed-Ring Commu
nications Networks” , Optical Networks Magazine, pages 61-72, January 2000.
” http : / / www.lucent — optical.com /solutions/products/ one/ ”
” http : / / www.nortelnetworks.com /products/01/optera/longhaul/index.htm l”
Private communication with Nortel Networks UK, June 2000.
”h ttp : / / w w w .alcatel.com /subm arine/products/detailed/oal/teralO .htm ”
’’h ttp : / / www.ciena.com/products/4000 — sentry/index.htm l”
” h ttp : / / www.ciena.com /products/corestream /index.htm l”
’’h ttp : / / www.marconi.co.uk/htm l/solutions/plt4080.htm ”
’’h ttp : / / www.m arconi.co.uk/m edia/sm artphotonixintune.pdf”
17] S. Fischer, M. Dulk, E. Camper, W. Vogt, E. Gini, H. Melchior, W. Hunziker,
D. Nesset, A.D. Ellis, ”Optical 3R regenerator for 40 G b it/s networks” , lEE
Electronics Letters, Vol. 35, No. 23, November 1999.
[18] T. Ito, K. Fukuchi, K. Sekiya, D. Ogasahara, R. Ohhira, T. Ono, ”6.4 TB /S
(160 X 40 GB/S) WDM Transmission Experiment W ith 0.8 BIT/SHZ Spectral
Efficiency” , 26th European Conference on Optical Communication (ECOC),
[19] S. Bigo, A. Bertaina, Y. Frignac, S. Borne, L. Lorcy, D. Hamoir, D. Bayart,
J.P. Hamaide, W. Idler, E. Each, B. Franz, G. Veith, P. Silland, L. Fleury,
P. Guenot, P.Nonchi, ” 5.12 T B IT /S (128 x 40 G B IT/S WDM) Transmission
Over 3x100 KM of TeraLightTM Fibre” , 26th European Gonference on Optical
Gommunication (ECOG), Post-Deadline Papers, Germany, September 2000.
[20] A. Farbert, G. Mohs, S. Spalter, J.P. Fibers, C. Furst, A. Schopflin, E.
Gottwald, G. Scheerer, G. Glingener, ”7 T B /S (176 x 40 GB/S) Bidirectional
Interleaved Transmission with 50 GHz Ghannel Spacing” , ECOC 00, Germany.
[21] Y. Zhu, W. S. Lee, C. Scahill, C. Fludger, D. Watley, M. Jones, J. Homan, B.
Shaw, A Hadjifotiou, ” 1.28 T B IT /S (32 x 40 GBIT/S) Transmission Over 1000
KM W ith Only 6 Spans” , 26th European Gonference on Optical Communica
tion (ECOC), Post-Deadline Papers, Germany, September 2000.
[22] T. Tsuritani, A. Agata, K. Imai, I. Morita, K. Tanaka, T. Miyakawa, N. Eda-
gawa, M. Suzuki, ”35GHz-Spaced-20GBPS x lOOWDM RZ Transmission Over
2700KM Using SMF-Based Dispersion Flattened Fiber Span” , 26th European
Gonference on Optical Communication (ECOC), Post-Deadline Papers, Ger
many, September 2000.
[23] J.X. G ai, M.I. Hayee, M. Nissov, M.A. Mills, A.N. Pipetskii, S.G. Evangelides
Jr., N. Ramanujam, C.R. Davidson, R. Menges, P.O. Corbett, D. Sutton, G.
Lenner, C. Rivers, N.S. Bergano, ” 1.12 T B /S Transmission Over Trans-Atlantic
Distance (6,200 KM) Using Fifty Six 20 G B/S Channels” , 26th European Con
ference on Optical Communication (ECOC), Post-Deadline Papers, Germany,
[24] T. Tanaka, N. Shimojoh, T. Naito, H. Nakamoto, I. Yokota, T. Ueki, A. Sug-
uyama, M. Suyama, ” 2.1-TBIT/S WDM Transmission Over 7,221 KM W ith
80-KM Repeater Spacing” , 26th European Conference on Optical Communica
tion (ECOC), Post-Deadline Papers, Germany, September 2000.
[25] N. S. Bergano, ’’Ultra Long Distance Submarine DWDM Systems” , 26th Euro
pean Conference on Optical Communication (ECOC), Volume 1, pages 67-68,
Germany, September 2000.
[26] K. Ishikawa, K. W atanabe, H. Chiba, H. Suzuki, R. Takeyari, K. O hhata, T.
Tanoue, K. Hirata, T. Masuda, R. Hayami, K. Washio, T. Haraba, ”40-G bit/s
Optical Transm itter and Receiver using InP HBT and SiGe HBT ICs” , 26th
European Conference on Optical Communication (ECOC), Volume 1, pages
D uobinary and D icod e M od u lation
3.1
Introduction
The duobinary process is a level coded correlative technique, first studied by Lender
[1], with three levels where " duo" indicates doubling of the bit capacity of a binary
system. The most significant property of duobinary is th at it affords a two-to-
one bandwidth compression relative to binary signalling or equivalently, for a fixed
bandwidth it has twice the speed capability in bits per second compared with a
binary system. Duobinary coding is a class of polybinary signals which themselves
are a class of partial response signals th a t were first described by Lender [1, 2, 3] in
the mid 1960s.
A polybinary signal is generated by introducing correlation between adjacent bits
in a binary signal and it has the interesting attribute th at its spectral density is
redistributed, such th at it is more concentrated around the carrier [4]. A polybinary
signal can be obtained by passing a binary signal through the delay and add filter
as, shown in figure 3.1 [4].
Binary Data
(b-2)T 2T
3T
Partial Response Polybinary Signal with b Levels
Figure 3.1: Filter for Generating a Polybinary Signal
Assuming there are (b-2) delay elements, a multilevel signal with b levels is generated
at the output of the polybinary filter, with a spectral density th at is compressed by
a factor of
{b —
1) compared to the original binary signal. Provided th a t the originalbinary sequence
an
is firstly precoded into binary sequenceCn
according to:The sequence
Cn
is fed to the polybinary filter of figure 3.1 to generate the polybinarysignal:
+
Cn-i
+ ... + Cyi_(5_2) (3.2)The original binary sequence can be recovered from independent decisions on
bn,
through the operation:
Qn = bnmod2
(3.3)Duobinary coding is a polybinary signal with b=3, i.e. the polybinary filter contains
one delay element.
Duobinary coding was developed in the 1960’s for use in radio transmission. Re
cently, it has attracted interest in optical communications due to the compact spec
trum and high dispersion tolerance of the duobinary signal [5].
Dicode signalling is another form of partial response transmission. Dicode signals
can also be generated using the same method as th at used for the generation of
duobinary signals. However, differences in the spectrum shape and non-minimum
dicode bandwidth separate dicode signalling from duobinary [6].
This chapter is an introduction to both duobinary and dicode coding including the
theory behind the correlative level coding techniques, together with some practical
examples of duobinary and dicode applications and their implementation methods
3.2
The D uobinary C oncept
If we consider two sequences of digits, a» and
bn
where [1, 3, 6]:ün = I or 0 {Mark or Space respectively)
(3.4)with
p{l) =
p(0) = 1/2, where p denotes probability. (3.5)Sequence
bn
is:bn =
+ 1 /2 , 0, —1/2or bn
= + , 0, — (3.6)The sequence
an
can be transformed into sequencebn'
•
When a„= 0, bn =
0.• When a„ = 1, the polarity of
bn
depends upon the polarity ofbn-k,
where k everypositive integer, corresponding to the last
an-k
= 1- If andan-k
are separatedby an even number of zeros
bn = -\-bn~k-
Otherwisebn = —bn-k ■
The following example illustrates the coding process :
Sequence a„:
000011001110110001101010000111011
Sequence
bn'.
In sequence
bn
a transition from 4- to -, or vice versa, in two successive time slots isimpossible. Both and
bn
sequences consist of NRZ pulses of identical duration ofT seconds. The purpose of the previously listed transform ation is to compress the
bandwidth of the sequence by a factor of two (2).
3.2.1
Spectral D en sity of th e D uobinary P u lse train
The spectral density function of a pulse train is [1]:
1 oo
w( f ) =
- |G ( / ) p { i î ( 0 )- m l + 2
Y^[R(k)
- ml]cos27rkfT}
(3.7)^
k = l
where G(f), the Fourier transform of rectangular pulses, is [1]:
The duobinary sequence
bn
defined in section 3.2 has probability p:p(0) = i
and
p ( + i ) = p ( - i ) = i (3.9)From 3.9 the mean is:
R(k) is the autocorrelation function. E denotes expectation:
R{k) =
E [ b n + k b n ]=
^ i i P i ^ n + k K= ^i)
(3.11)i
Xi
can be 0 or 1/4 or -1/4. The total number of patterns with the probabilitiesshown below are 2^+E Therefore, the probability of each pattern is
R{k)
= p{xi = 0) X (0) + p{xi = - ) X ( - ) + p(xi = —- ) X (—^) =— ^ ^[Total number of patterns with ( i ) values —
—Total number of patterns with (~ j ) values] =
where A is the total number of patterns with positive values of
{bnbn+k)
less thetotal number of patterns with negative values of
{bnbn+k)-For k=0, R(k) is:
ü(0) =
E[bl] =
(O') X 1 + ( t ) ' X ( i ) + ( - t ) ' X ( t ) = 1 (3.13)For k = l, by examining the sequences
an
and the patterns of interest should onlybe 11 in a„ and + + or - - in 6;^. Digits in sequence th a t start and end with Is
are only considered and their
![Figure 3.6 shows the operation of a MZ-modulator for a normal binary signal [10],](https://thumb-us.123doks.com/thumbv2/123dok_us/8277737.1376541/67.595.190.392.404.731/figure-shows-operation-mz-modulator-normal-binary-signal.webp)