International Journal of Asian Social Science, 2014, 4(2): 242-248
† Corresponding author
CONTRIBUTION OF “NON-EXAM” ASSESSMENT TO UNDERGRADUATE
FINAL GRADE: A CASE STUDY ON THE SUBJECT THERMODYNAMICS 1
Hasril Hasini
†Department of Mechanical Engineering, College of Engineering, Universiti Tenaga Nasional, Jalan IKRAM-UNITEN, Kajang, Selangor, Malaysia
Siti Sarah Ain Fadhil
Department of Mechanical Engineering, College of Engineering, Universiti Tenaga Nasional, Jalan IKRAM-UNITEN, Kajang, Selangor, Malaysia
Nur Irmawati Om
Department of Mechanical Engineering, College of Engineering, Universiti Tenaga Nasional, Jalan IKRAM-UNITEN, Kajang, Malaysia
ABSTRACT
This paper describes the study on the difference and implication of continuous assessment and
exam-type assessment to students’ performance in the subject Fundamental Thermodynamics.The
case study was carried out to measure the effect of weightage given to two types of assessments namely “non-exam” and “exam-based assessment”. The analysis was done by varying the percentage contribution of the two methods and its corresponding contribution towards the students’ final grades. It is shown that higher weightage on the non-exam assessment results in better overall grade for the student. It is also alarming that majority of students achieve weak
grade for exam-based assessment, butthe overall grade improves as the cumulative marks include
the non-exam assessment marks at which most students performed better.
© 2014 AESS Publications. All Rights Reserved.
Keywords:
Thermodynamics, Assessment, Final exam, Assignment, Undergraduate, Non-exam.1.
INTRODUCTION
In university, student assessment is carried out based on the standard procedure outlined by institution where the teaching and learning process took place. The assessment procedure outlined by many higher learning institutions varies accordingly. Governing body that is responsible to monitor these institutions have normally given some guidelines on important knowledge and skills
International Journal of Asian Social Science
ISSN(e): 2224-4441/ISSN(p): 2226-5139Special Issue:
International Conference on Teaching and
Learning in Education, 2013
students need to have prior to graduation. The method in which how students' attainment on important engineering key attributes is decided by the individual institution with the aid of guidelines provided by the governing bodies in higher education Traditional assessment method includes continuous assessment and final exam and it is the cumulative marks obtained from these assessments that determine whether students pass the subject.
Issue on exam based assessment has been discussed extensively in the open literature. Many researchers have reported that higher understanding on a particular subject could be increased among students by reducing the exam-based assessments. It was also reported that, examination anxiety and stress among the students could be taken away by eliminating exam-based assessment
(Forsaith, 2001). The change in assessment method was found to have positive effects on the
students learning approaches and better understanding on the subject. Students learn more in non-exam based assessment since the assignments were done nearly on every topic. Over the last decades, extensive study was carried out on this matter and conclusion was made that non-exam assessment method may distinguish between surface and deep approaches to learning. (Marton and
Saljo, 1976), (Entwistle and Ramsden, 1983), (Biggs, 1989), (Entwistle, 1998). In surface learning
approach, the intention is to handle the task in minimal way without any integrating the constituent parts of a subject. In contrast, deep learning approach seeks understanding of the subject and able to relate the knowledge into real problem. Moreover, in exam-based assessment the study efforts tend to direct in memorising instead of understanding (Tan, 1992).
Fundamental of Thermodynamic was known among undergraduate students to be a difficult subject compared to the others taught in the same year. The issues have been widely reported and many reasons were stated as the contributing factor that leads to the misconception of the subject matter among students (Patron, 1997; Baher, 1998; Meltzer, 2004; Anderson et al., 2005; Junglas,
2006; Bullen and Russell, 2007). In-class observation has shown that good students will do well in
any assessment regardless of whether it is exam or non-exam based. On the other hand, the average and weak students will depend primarily on the non-exam assessments to get reasonable grade in the final grade. However, the extent at which these assessments could help in students final grade has not been studied in detail. This paper attempts to analyze the significant contribution of different assessment method besides conventional method in subject of Fundamental Thermodynamics. Thermodynamics is related to the study of energy and play significant role in our life. The subject is taught to second year students under the 4-year Mechanical Engineering degree program in most universities in Malaysia.
2.
METHODOLOGY
2.1.Fundamental of Thermodynamics Background
© 2014 AESS Publications. All Rights Reserved.
table, it can be said the ratio of exam-based and non-exam based assessment is 70:30. The objective of having non-exam based assessments is to ensure continuous focus on the subject and to create awareness among the student in terms of deep approach learning.This is important to assess the student in such way that higher cognitive learning domain is achieved. The assessment ofhigher level cognitive domain is normally carried out through written assignment which question is designed to stimulate discussion and information seeking on problems related to Fundamental Thermodynamics. In addition to cater for complex problem solving, it was also observed that students are highly engaged with the problem given. Table 2 shows the summary of assessment distribution in a typical semester. Quizzes are assigned to students on a periodic basis with early announcement made one day before the assessment. The early announcement is told to let the student to prepare for the quiz and indirectly encouraging them to do revision. There are twoshort assignments given to the students; one on the issue of sustainability and the other on the power plant system design. During the semester two tests are conducted as part of the continuous assessment approach towards students’ evaluation. Test#1 is held during week 6 and covers the lesson taught until week 5 while Test #2 is held in week 12 and covers the lesson taught starting week 6 to 11. In the test assessment, students are evaluated on narrow lesson coverage and thus are expected to do well for this type of assessment. The final exam is held in week 16 or 17 during the exam week and all lessons taught in the subject will be assessed.
Table-1. Mark distribution for each assessment Assessment Weightage (%)
Assignments 10
Quizzes 10
Homeworks 10
Test 1 15
Test 2 15
Final Exam 40
Table-2. Summary of the assignment of assessment in semester
*Homework/computerized homework is given every week during tutorial class
Week Assessment Remarks
1 2
3 Quiz #1
4
5 Quiz #2
6 Test #1
7 Assignment#1 Duration to submit is 2 weeks
8 Quiz #3
9
10 Quiz #4
11 Assignment #2 Duration to submit is 3 weeks
12 Test #2
13
14 Quiz #5
15 Study week In-class revision
2.2.Method of Assessment
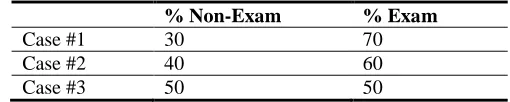
In this work, the principle objective is to investigate the changes in students’ final grade when percentage assessment between exam- and non-exam-based changed. Thus the raw data obtained from student assessment was analyzed and variations in the percentage contribution between the exam- and non-exam-based assessments were made. The summary of cases simulated is shown in Table 3. Case #1 represents the current evaluation method applied to the student. In this case, the ratio of non-exam to exam percentage is 30:70. In Case #2 the contribution of non-exam based assessment is increased to 40% and in Case #3, the contribution is further increasedto 50%. Using this scale, the changes in students’ overall performance or grade will be evaluated. The final cumulative marks obtained by the student will be translated into a letter gradeaccording Table 4. The mark range for the letter grade was made fixed for all students and no transformation is made once the overall cumulative score is finalized.
Table-3. Variation in percentage of exam- and non-exam assessment
% Non-Exam % Exam
Case #1 30 70
Case #2 40 60
Case #3 50 50
Table-4. Mapping of mark to letter grade
Marks 85-100 80-84 75-79 70-74 65-69 60-64 55-59 50-54 45-49 40-
44 0-39
Grade A A- B+ B B- C+ C C- D+ D E
3.
RESULTS AND DISCUSSIONS
3.1. Students’Performance Based on Individual Assessment
The students’ performance in each individual assessment is analyzed and this is illustrated in Figure 1. Mixed distribution of grade for different assessment can be observed and no trend could be concluded. Based on this figure, it can be said that the highest student population getting good grade (A) is through the non-exam assessment (assignment and quiz) with a population of 47% and 43% respectively. On the other hand, the student getting an A forexam-basedassessment (tests and final exam) is very minimal, approximately 5%. It was also interesting to note that the highest students’ population getting a fail grade (E) is through exam-based assessment (final exam, followed by tests) with population of 42% and 35% respectively. This indicates that students are more likely to get high marks in the non-exam based assessment. In this assessment such as assignment and homework, they were given ample time and allowed to refer to other source such as textbook and internet in order to solve a given question or problem. In addition, most students will have discussions among themselves to find the best method in solving the given problem. On the other hand, in the exam-based assessment such as tests and final exam, students will have to have in depth understanding on the subject. During the individual assessment, they were not allowed to bring any materials for references. As a result, only some students perform excellently with the majority having poor grade on each individual exam-based assessment.
© 2014 AESS Publications. All Rights Reserved.
In the previous sub-section, student achievement on each individual assessment was presented and discussed. It is clear that the majority of the students obtains a good grade in the non-exam based assessment while most of them failed in the exam-based assessment. In higher education institutions, the final grade of the students was basedon the combined contribution of exam and non-exam based assessment. To balance between both types of assessment, certain weightage is imposed, however there is no clear guideline on how the percentage was determined. In order to evaluate the effect this weightage have on the overall students’ grade and performance, analysis is carried out on similar studentbatch by varying the percentage contribution of the exam and non-exam based assessment. The outcome is illustrated in Figure 2. In this figure 30-70 indicates the ratio of 30:70 for non-exam and exam based assessment respectively. Similarly, 40-60 means the ratio of 40:60 for non-exam and exam based assessment respectively. The same definition is also applies to 50-50.
Figure-1 Grade distribution for different assessment method
General trend indicates improved students’ performance when the weightage for non-exam assessment is increased from 30% – 50%.This is true based on the increase in students’ population getting grade A, A-, B+, B and C+ for the same case, i.e. grade improvement on the first half of the graph. On the other hand, the population of students getting a fail gradereduces when the weighted for exam and exam-based assessment increases. This proves the large influence by the non-exam assessment towards the final grade of the student, i.e. the non-non-exam assessment marks helps to make up the mark lost in the exam-based assessment.
Despite the attempts made to vary the weightage of exam and non-exam based assessment in the subject of Thermodynamics, careful attention must be given in the design of questions for both types of assessments. More importantly, the questions must be made to test students’ ability to achieve the required attributes that consequently add to the value as future engineers. Based on the results shown, the limit of percentage for the exam- and non-exam based is difficult to determine as
0 5 10 15 20 25 30 35 40 45 50
A A- B+ B B- C+ C C- D+ D E
% S
tu
de
nt
s
Grade
not clear trend was obtained from the analysis. Thus teacher for this subject needs to properly address the assessment distribution accordingly
Figure-2. Final grade distribution for different assessment weightage
4.
CONCLUSION
Study on the contribution of exam and non-exam based assessments towards the final grade of students’ was carried out on Fundamental of Thermodynamics subject. Using a sample size of 204, the variation of weightage of the exam and non-exam based assessment were simulated for few sets of ratio, namely 30-70, 40-60 and 50-50. Based on the investigation, it was found that the non-based assessment method such as homework, quizzes and assignments were preferred by the students and this is evident from their excellent achievement in this type of assessment. The least preferred method of assessment is the exam-based one such as tests and final exam as a student performed poorly in both assessments. Despite poor achievement in the final exam, most students manage to pass the subject satisfactorily as their overall marks were complimented by the exam assessment type which they performed better. Increasing the percentage weight in the non-exam assessment results in the students getting a better overall gradeand this has demonstrated the importance of this assessment to assist student’s final grade.
5.
ACKNOWLEDGEMENTS
The author would like to acknowledge all the lecturers teaching the subject Thermodynamic 1 for providing the data and invaluable discussion on the subject.
REFERENCES
Anderson, E.E., R. Taraban and M.P. Sharma, 2005. Implementing and assessing computer-based active
learning materials in introductory thermodynamics. Int. J. of Engineering Education, 21(6): 1168-1176.
0 2 4 6 8 10 12 14 16 18 20
A A- B+ B B- C+ C C- D+ D E
%
Stu
d
e
n
ts
Grade Distribution
© 2014 AESS Publications. All Rights Reserved.
Baher, J., 1998. How articulate virtual labs can help in thermodynamics education: A multiple case study. 28th
Annual FIE Conference, 2: 663-668.
Biggs, J.B., 1989. Approaches to the enhancement of tertiary education. Higher Education Research and
Development, 8(1): 7-25.
Bullen, P. and M. Russell, 2007. A blended learning approach to teaching first year engineering degree students. International Conference on Engineering Education - ICEE 2007. Coimbra, Portugal.
Entwistle, N., 1998. Improving teaching through research on student learning, Chapter 4 in J. J. F. Forest (ed), University Teaching: International Perspectives. New York: Garland Publishing.
Entwistle, N.J. and P. Ramsden, 1983. Understanding student learning. London: Croom Helm.
Forsaith, D., 2001. Introducing assessment-based learning to a Commerce Topic School of Commerce, Flinders University of South Australia.
Junglas, P., 2006. Simulation programs for teaching thermodynamics. Global J. of Engineering Education, 10(2): 175-180.
Marton, F. and R. Saljo, 1976. On qualitative differences in learning, outcome and process. British Journal of Educational Psychology, 46(1): 4-11.
Meltzer, D.E., 2004. Investigation of students’ reasoning regarding heat, work, and the first law of
thermodynamics in an introductory calculus-based general physics course. Am. J. Phys, 72(11): 1432-1446.
Patron, F., 1997. Conceptual understanding of thermodynamics: A study of undergraduate and graduate students. Ph.D. Thesis, Purdue University.
Tan, C.M., 1992. An evaluation of continuous assessment in the teaching of physiology. Higher Education,
23: 255-272.