Article
1
Experimental Study and Hydrodynamic Modelling of
2
the Wet Agglomeration Process
3
Benjamin Oyegbile 1,*, Guven Akdogan 1 and Mohsen Karimi 2
4
1 Department of Process Engineering, Stellenbosch University, Banghoek & Bosman Road, Stellenbosch 7600 South
5
Africa; [email protected]
6
2 Department of Chemistry and Chemical Engineering, Chalmers University of Technology, 41296 Gothenburg, Sweden;
7
8
* Correspondence: [email protected]; Tel.: +27-(0)21-808-9485
9
10
Abstract: In this study, an experimentally validated computational model was developed to
11
investigate the hydrodynamics in a rotor-stator vortex RVR agglomeration reactor having a rotating disc at the
12
centre with two shrouded outer plates. A numerical simulation was performed using a simplified form of the
13
reactor geometry to compute the 3D flow field in batch mode operations. Thereafter, the model was validated
14
using data from a 2D Particle Image Velocimetry (PIV) flow analysis performed during the design of the
15
reactor. Using different operating speeds—70, 90, 110 and 130 rpm, the flow fields were computed
16
numerically followed by a comprehensive data analysis. The simulation results showed separated boundary
17
layers on the rotating disc and the stator. The flow field within the reactor is characterized by a rotational plane
18
circular forced vortex flow in which the streamlines are concentric circles with a rotational vortex. Overall, the
19
results of the numerical simulation demonstrate a fairly good agreement between the CFD model and the
20
experimental data as well as the available theoretical predictions. The swirl ratio β was found to be
21
approximately 0.4044, 0.4038, 0.4044 and 0.4043 for operating speeds of N=70, 90, 110 and 130 rpm
22
respectively. In terms of the spatial distribution, the turbulence intensity and kinetic energy are concentrated
23
on the outer region of the reactor while the axial velocity showed a decreasing intensity towards the shroud.
24
However, a comparison of the CFD and experimental predictions of the tangential velocity and the vorticity
25
amplitude profiles shows that these parameters were under-predicted by the experimental analysis which
26
could be attributed to some of the experimental limitations rather than the robustness of the CFD model or
27
numerical code.
28
Keywords: wet agglomeration; flocculation; hydrodynamics; turbulence
29
30
1. Introduction
31
The removal of particulate solids from liquid process effluent is of great importance in
32
environmental quality management. However, when the sizes of solid particles diminish and reach
33
micron and submicron range, the particles tend to remain in suspension and cannot be removed by
34
gravity settling [1,2]. In order to achieve an acceptable solid-liquid separation at a reasonable cost,
35
the particles need to be agglomerated by flocculation followed by mechanical phase
36
separation—sedimentation, floatation, filtration etc. The agglomeration of suspended particles to
37
form larger and settleable flocs form the basis of operation of many process industries ranging from
38
municipal water and wastewater treatment to pulp and paper processing.
39
Mixing plays an important role in the agglomeration of fine particles in suspension either in
40
engineered or natural systems and the choice of a particular stirrer-vessel configuration strongly
41
influences the flow pattern in the treatment unit. Flow in the wheelspace or cavity between a
42
stationary and rotating disc (rotor-stator system) is of great importance in many engineering
43
applications such as in mixing applications for food, chemical and pharmaceutical industries, and in
44
the turbine and compressor blades for the aeronautical industry [3–6]. Flows of this nature has been
45
the subject of many scientific investigations both theoretically and experimentally [7,8]. Theoretical
46
analysis of the nature of flow in rotor-stator systems resulted in the so called—Batchelor-Stewartson
47
controversy regarding the exact nature of the flow profile in the wheelspace between the rotor and
48
the stator. It is now generally accepted that both models are valid with the Batchelor’s model giving
49
more accurate description of the flow in an enclosed or shrouded rotor-stator system which consist
50
of a separated boundary layers on the rotor and the stator and an inviscid rotating core in between
51
the boundary layers [9,10].
52
The use of Computational Fluid Dynamics CFD for the investigation of complex fluid-particle
53
interactions in many engineering design of fluid flow applications has been steadily growing in
54
popularity, both in academia and the industry over the past few decades [11,12]. Nowadays,
55
numerical simulations complement the experimental and analytical techniques, and are increasingly
56
being performed on a much bigger scale in many fluid engineering applications ranging from
57
chemical and mineral processing to civil and environmental process engineering [11]. In any
58
design-based CFD modelling, the main focus is to assess the hydrodynamics of the system and to
59
determine the flow pattern, hydrodynamic profile—velocity, vorticity, kinetic energy, dissipation
60
rates, turbulence intensity, turbulent viscosity profiles etc., dead zones and black spots which in
61
turn, will help in improving and optimizing the engineering design and overall performance of the
62
reactor [13,14]. In many technical applications of engineering design techniques to complex fluid
63
flow problems, an understanding of the interacting physical, biological and chemical processes
64
within the reactor system is highly indispensable. This is particularly interesting as the CFD offers a
65
flexible and sophisticated platform for engineers and scientists in the investigation of complex
66
engineering design problems. A quick survey of literature in this field shows that many innovative
67
fluid-particle multiphase reactors have been successfully designed and tested on different scales for
68
a wide range of engineering applications ranging from particle separation and water
69
purification—bacterial inactivation, to biological cell culture preparation [15–22]. For instance, the
70
application of Taylor-vortex or Taylor-Couette flow for a wide range of beneficial physicochemical
71
treatments have been reported with some encouraging results [23].
72
Buwa et al. [3,4] investigated the performance and optimization of different types of disc
73
impellers as flow inducers in stirred tanks. Their two-part study compared the efficiency of the
74
rotating disc to the conventional propeller as alternative flow inducers in mixing tank applications.
75
A radial grid disc, square grid disc, solid discs and a propeller were selected for the investigation.
76
Laser Doppler Anemometry—LDA measurements and the subsequent numerical simulation
77
showed that there was no substantial variation in the axial flow pattern between the radial grid and
78
the square grid disc. However, the flow near the impeller shows a strong dependence on the
79
impeller configuration. The study also reported that the mixing performance of the radial grid disc
80
and that of the propeller was roughly the same. Similarly, Dionysios et al. [19] investigated the
81
application of rotating disc photocatalytic reactor—RDPR for the treatment of organic pollutants in
82
water. A subsequent analysis of the mixing and treatment efficiency in terms of the degradation of
83
the organic pollutants showed that the technique offers several benefits when compared to the
84
existing ones and the mixing regime is quite close to that of the continuous stirred tank reactor
85
CSTR. However, vital information on the hydrodynamic behaviour of the reactor either
86
experimentally or numerically was missing from the study. In the case of technical applications of
87
Batchelor vortex, it is the comprehensive study of a multi-inlet vortex reactor by Liu et al. [24,25] that
88
has advanced research in this field to the greatest extent. Their two-part study reported that the flow
89
structure of the vortex flow in the nano particle precipitation reactor consist of a spiral motion in the
90
free-vortex region and a nearly homogeneous mixing in the forced-vortex region.
91
While there appears to be huge interest in rotor-stator flow among the scientific community
92
from theoretical perspective, it is very rare to find practical applications of this type of flow
93
especially in fluid-particle separation with the exception of Taylor-Couette flow. Therefore, the aim
94
of this study is to investigate the hydrodynamic performance of a rotor-stator vortex agglomeration
95
reactor—RVR designed for fluid-particle separation using Batchelor flow in a shrouded cavity. A
96
single rotating reference frame SRF approach was used to model the disc interaction with the fluid
97
subsequently employed in analysing the flow pattern and the spatial distribution of the
99
hydrodynamic quantities within the reactor and in understanding the hydrodynamic behaviour
100
with respect to the reactor geometry.
101
2. Materials and Methods
102
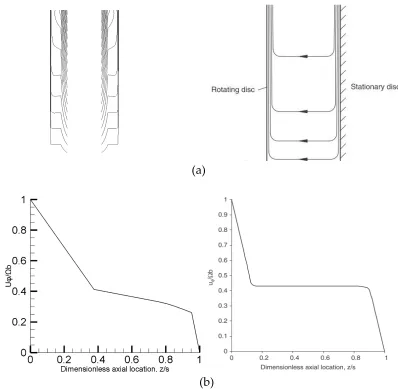
2.1 Description of the RVR Agglomeration Reactor
103
A patented rotating disc vortex reactor RVR made from perspex was designed for the
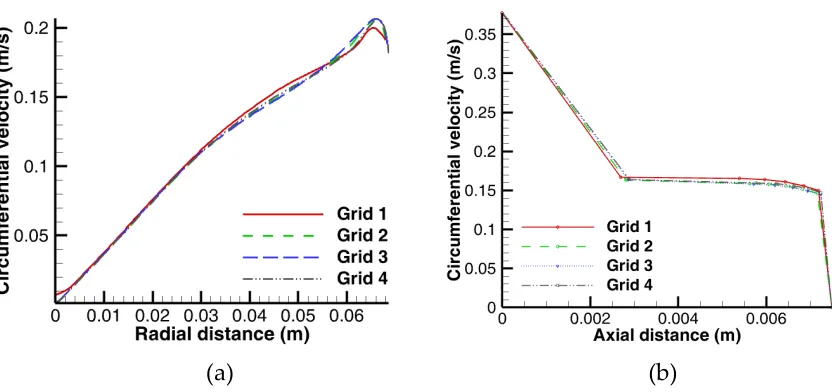
104
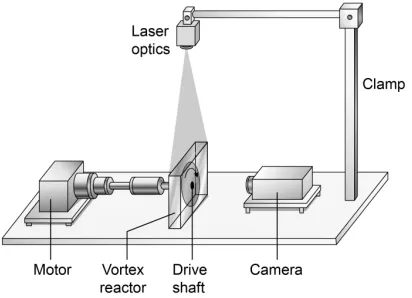
agglomeration of dispersed fine particles in suspension as shown schematically in Fig.1a with the
105
design details available elsewhere [26]. It is of cylindrical rotor-stator configuration with a shrouded
106
outer casing. The working slurry is a mixed synthetic kaolin suspension fed into the reactor through
107
an opening at the top. Mixing of the synthetic suspension—kaolin slurry and the flocculating agents
108
(synthetic poly acrylamide PAM—Superfloc® C-492 and N-300) is provided by the spinning disc
109
powered by a rotating shaft. The rotating disc made from PVC generates both radial swirling flow at
110
the immediate vicinity of the disc and an axially pumping flow at some distance away from the disc
111
towards the stator, which eventually drives the agglomerated flocs towards the shroud of the reactor
112
as shown schematically in Fig. 1b. The axial flow away from the rotating disc towards the shroud
113
facilitates the collection of densified agglomerates on either side of the reactor in batch mode
114
operations.
115
116
(a) (b)
117
Fig. 1: Schematic illustration of the reactor configuration and flow profiles (a) RVR reactor (b)
118
rotor-stator flow boundary layers showing the tangential velocity and vorticity amplitude profiles on
119
the rotating disc (Reproduced from [8] with permissions © 2011 Elsevier).
120
2.2 Theoretical Analysis of the Fluid Flow
121
The flow in the reactor wheelspace or cavity is characterized by an axis-symmetrical forced
122
vortex Batchelor flow with separated boundary layers at the rotor and the stator. The velocity profile
123
of the flow on the disc boundary layer is illustrated in Fig. 1b with radial, tangential and axial
124
velocity flow profiles. The circumferential velocity in a forced vortex flow increases radially
125
outwards with the radius attaining a maximum at the tip of the disc—tip velocity, while the vorticity
126
magnitude is nearly constant with its amplitude twice the angular velocity of the rotating disc. The
127
flow in the reactor system—either on the boundary layer or rotating core may be characterized by a
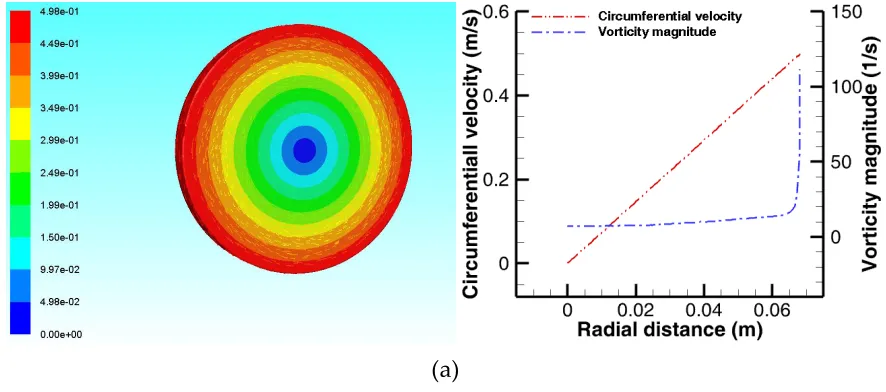
128
certain degree of flow instability when it is above the critical Reynolds number Reϕ, critical 2 × 10⁵ with
129
small patches of turbulence or oscillating vortex disturbance [7,8]. This can be expressed
130
mathematically for the boundary layer near the rotor using the local rotational Reynolds number
131
Reϕ, local (Eq. 1). The gap ratio G of the reactor defined as the ratio of the wheelspace width to the
132
outer disc radius is approximately 0.2206 for this reactor system (Eq. 2). The theoretical
133
hydrodynamic characteristic values are given in Table 1.
134
Table 1: Theoretical values of the flow quantities at different operating speeds near the rotating disc boundary
139
layer
140
Hydrodynamic parameters
Operating speeds (rpm)
Disc rotational Reynolds number (-)
Disc tip velocity (ms-1) Disc vorticity (s-1)
70 2.59 × 10⁴ 0.4985 14.662
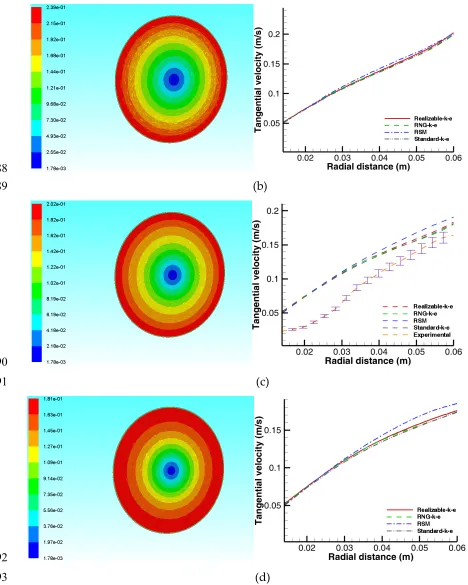
90 3.33 × 10⁴ 0.6410 18.852
110 4.07 × 10⁴ 0.7834 23.041
130 4.81 × 10⁴ 0.9258 27.231
141
142
(1)
143
(2)
2.3 Experimental Fluid Flow Measurements
144
The flow measurement commences after running the reactor for a period of time in which the
145
fluid flow had reached a steady state. In our case, we assume a time longer than t = tGϕ = 25s as the
146
time at which the system has reached a pseudo-steady state condition [27]. The 2D PIV
147
measurements which is described in details elsewhere [15] consist of a RVR reactor system seeded
148
with tracing particles and distilled water at standard conditions as working fluid (Fig. 2). The
149
geometry of the reactor presented some measurement constraints which was taken into account in
150
the post-processing and analysis of the experimental data. The laser system for the experimental
151
measurements consist of a LINOS Nano 259-532-100 (Qioptic GmbH & Co. KG, Germany) providing
152
illumination for a cross section of the reactor under investigation. A high resolution CMOS camera
153
was used to capture the steady state fluid flow behaviour for post-processing and cross-correlation
154
in MATLAB (Mathworks GmbH, Germany). The seeding particles is a mixture (1:1) of silver-coated
155
and hollow glass spheres (Dantec Dynamics, A/S, Denmark) measuring 10μm in average diameter
156
with good light scattering efficiency and sufficiently small velocity lag [28,29].
157
158
159
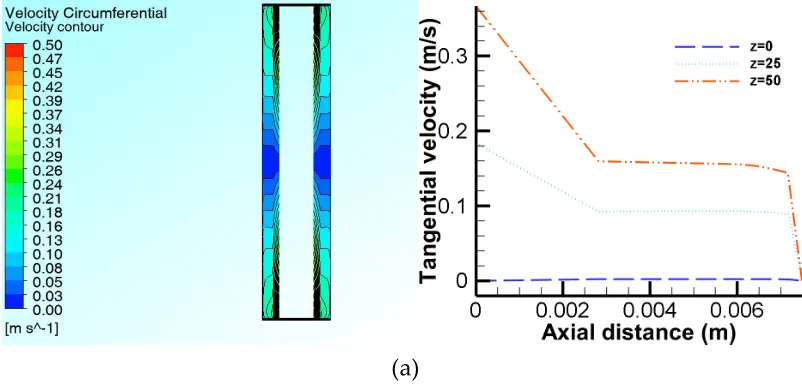
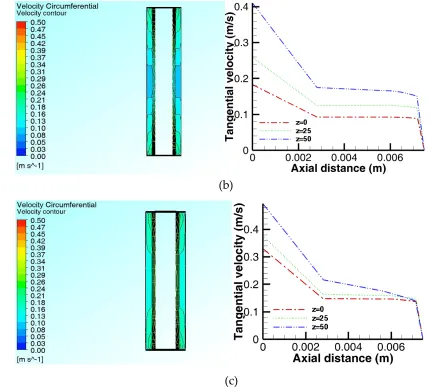
Fig. 2: Schematic illustration of the particle Image Velocimetry (PIV) set up.
3. Numerical Simulation
161
3.1 Model Description
162
3.1.1 Governing Equations
163
The general form of the governing equations of mass and momentum conservation or the so
164
called—Reynolds-Averaged Navier-Stokes (RANS) equation can be written in a simplified form for
165
a steady-state single phase fluid flow is given in Eqs. 3-4, where is the density, is the static
166
pressure, is the velocity component, represents the stress tensor due to viscous stress, is the
167
gravitational force and is the exerted body forces. The Reynolds Averaged (RANS) form of the
168
continuity and momentum conservation equations was used along with k-ε eddy-viscosity and RSM
169
turbulence models to close the RANS momentum equation. In the case of standard and RNG k-ε
170
models, this is done by calculating the turbulent or eddy viscosity , or effective viscosity from
171
the transport equations of turbulent kinetic energy k and its dissipation rate ε [4,30,31]. The effective
172
viscosity and the stress tensor can be written as follows where μ represent the molecular
173
viscosity and the constant for the standard k-ε and RNG k-ε models
174
respectively, while the last terms on the right represent the turbulent or eddy viscosity (Eqs. 5-6)
175
[4,32–35]:
176
(3)
177
(4)
178
(5)
179
(6)
3.1.2 Fluid Flow Domain, Mesh and Grid Convergence
180
A solid modelling software (ANSYS DesignModeler 18.2, ANSYS Inc.) was used to create the
181
simplified CAD model of the reactor along with the rotating disc to describe the fluid domain (Fig.
182
3). Thereafter, a computational mesh was generated from the solid model for the computational
183
study which consist of structured hexahedral mesh using the commercial grid generation software
184
ANSYS Meshing 18.2 (ANSYS Inc.). Four grids of different mesh densities of approximately (0.042 ×
185
106, 0.431 × 10⁶, 0.86 × 10⁶, and 1.3 × 10⁶ elements) were created for the grid independence study. The
186
grid independence study was conducted by carrying out the numerical simulation on successively
187
finer grids. Thereafter, the results of the circumferential velocities were compared for all the grids to
188
establish that they are grid-independent. Finally, a mesh containing approximately half a million
189
elements was thereafter chosen on the basis of a trade-off between the required computational
190
accuracy and CPU time needed to run the simulation to a converged solution. This optimized mesh
191
approximately 15 hours for the highest operating speed. Fig. 4 shows the radial and axial
193
circumferential velocity profiles along Y-Z and X-Z planes at x=0.003725 and y=0.045 respectively for
194
a rotation speed of 70rpm for all the four grids employed for the grid convergence study and clearly
195
demonstrates that the results are grid-independent.
196
197
198
Fig. 3: Graphical illustration of the simplified reactor solid model and the generated computational
199
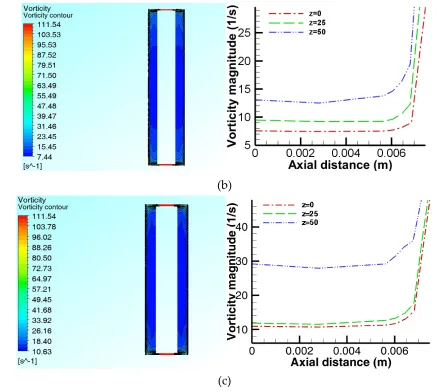
grid for the numerical simulation.
200
201
202
(a)
(b)
203
Fig. 4: Influence of the computational grid size on the computed radial and axial circumferential
204
velocity profiles along Y-Z plane and X-Z plane parallel to the shaft for RNG k-ε model at 70 rpm (a)
205
x=0.003725 (b) y=0.045.
206
3.2 Numerical Methods and Boundary Conditions
207
The hydrodynamics of the wet agglomeration process was investigated by obtaining
208
numerically, the steady state flow field of a single phase flow in the reactor. This flow field was then
209
compared to the experimentally derived one based on the assumption that the seeding particles in
210
the PIV measurement faithfully follow the flow and do not have any impact on the continuous
211
phase—one way coupling. This assumption is necessary to match the PIV experimental conditions.
212
However, this simplified approach is rarely the case in practice. The agglomeration, growth and
213
between the carrier and the particulate phase through contacts and collisions, especially for high
215
particle concentration or dense flows [36,37]. In modelling the single phase flow in the
216
agglomeration reactor, the Single Reference Frame SRF approach was employed with relative
217
velocity formulation. This is due to the fact that most of the flow in the fluid domain is rotating as the
218
flow inducer is in close proximity to the reactor wall. No slip condition was imposed on all walls
219
with the choice of a relative reference frame to describe the zones relative to one another. The
220
pressure-based coupled algorithms was used to obtain a steady state numerical solution of the
221
Navier-Stokes Equation. This algorithm has been shown to offer a more robust and efficient single
222
phase implementation for steady-state flows [33].
223
In order to ensure the accuracy of the numerical solution, the scaled residuals, moment on the
224
revolving plate about the axis of rotation, and the average turbulent kinetic energy k were monitored
225
until these parameters reduce to minimal or constant values and this forms the basis for assessing
226
the convergence of the solution. In verifying the accuracy of the numerical solution, the theoretical
227
values of some hydrodynamic quantities such as the tip velocity Ω of the rotating disc, the induced
228
vorticity ζ on the disc boundary layer, the flow swirl ratio β and the gap ratio G were also calculated
229
and compared to the numerically derived and literature values (Fig. 1b, Eqs. 7-9). Finally, validation
230
of the numerical results was carried out by comparing some of the CFD results with the PIV data
231
and the Batchelor model.
232
233
(7)
234
(8)
235
(9)
236
4. Results and Discussion
237
The results of the CFD analysis showing the distribution of the mean flow parameters is hereby
238
presented in the following sections. Only the data from one side of the reactor is analysed as the flow
239
is fully symmetrical about the axis of rotation. The symmetrical nature of the flow was also
240
confirmed in the course of the data analysis by comparing data points on either side of the reactor
241
and other points of symmetry. It can be clearly seen that the flow fields are generally similar in
242
structure but mainly differ in terms of the flow quantities’ magnitude.
243
4.1. Analysis of the Mean Flow Characteristics
244
4.1.1 Radial Distribution of the Hydrodynamic Quantities
245
The flow streamlines in the rotor-stator system can be analysed on the basis of the Batchelor flow
246
model. The flow structure in the RVR reactor broadly agrees with the Batchelor’s predictions and
247
that of several other similar studies [9,10]. The Batchelor’s prediction was arrived at by solving a
248
simplified form of Navier-Stokes equation to obtain an approximate flow field. Figs. 5a-d and 6a-d
249
shows the radial profiles of the circumferential velocity vector fields and contours and the vorticity
250
reactor wheelspace which seems to be consistent with the theoretical descriptions given in Fig. 1b
252
and Eqs. 6 and 7. Away from the boundary layer near the rotor, there is a sharp increase the radial
253
vorticity profile with respect to the radial distance (Figs. 6b-d). In addition, the radial
254
circumferential velocity profile shows a somewhat lower magnitude than the tip velocity close to the
255
wall of the reactor (Fig. 4a). However, in the case of the vorticity magnitude profile, it is observed
256
that there is a small region of high vorticity mostly around the outer edge of the rotating disc as
257
shown in the vorticity magnitude contour (Fig. 5a). Apart from this region, the CFD results is
258
consistent with the theoretical prediction of vorticity as twice the magnitude of the rotating disc
259
angular velocity (Fig. 1b, Table 1). It has been shown by previous studies that a region of high
260
vortex and vorticity tend to promote the wet agglomeration of particles and floc densification
261
[38,39]. However, owing to the nature of the clearance between the rotating disc and the reactor wall,
262
which is quite narrow, it is not possible to take advantage of this rotational effect for further
263
densification of the formed flocs and this will be a factor to be considered in future optimization of
264
the reactor system. The velocity distribution across the wheelspace is characterized by Batchelor
265
flow with separated boundary layers and an inviscid core that rotates at a fraction of the rotor
266
angular velocity with an axial pumping effect towards the shroud. The swirl ratio β which is a
267
measure of the ratio of the rotating core tangential velocity to that of the disc tip velocity or
268
boundary layer velocity was found to be approximately 0.4044, 0.4038, 0.4044 and 0.4043 for
269
operating speeds of N=70, 90, 110 and 130 rpm respectively which are quite similar to the values
270
reported by Daily et al. [8].
271
The basic outline of the flow pattern is also consistent with the PIV results which are available
272
elsewhere [15]. The velocity profiles at two selected YZ cross sections on the model were validated
273
by comparing them with the experimental data with a measurement error of ± 0.05. (Figs. 5b and 5c).
274
In general, the velocity profile shows a fairly good agreement with the PIV data except at the outer
275
edge of the cross section of the PIV velocity profile. This region on the outer edge of the cross section
276
had to me masked out in the post-processing of the PIV data owing to some measurement
277
limitations encountered during the PIV analysis. The high fluctuation of the laser signal on the fluid
278
surface makes the measurement quite a challenge. Compared with the PIV results, the maximum
279
tangential velocity predicted by the CFD differs by a value of approximately 10%. However, it is
280
worth pointing out that the observed deviations of the CFD data from the experimental results were
281
mainly due to the experimental limitations encountered in the PIV analysis rather than the accuracy
282
of the numerical predictions. A quick comparison of the CFD data with theoretical calculations in
283
Table 1 seems to suggest that the PIV analysis under predicted the flow characteristics.
284
285
286
(a)
288
(b)
289
290
(c)
291
292
(d)
293
Fig. 5: Reactor cross sections showing the velocity vector fields and contours for RNG-k-ε model for
294
and radial tangential velocity profiles along Y-Z plane at N=70rpm (a) rotating disc boundary layer
295
297
(a)
298
299
300
b)
301
302
(c)
304
(d)
305
Fig. 6: Reactor cross sections showing the vorticity vector maps and contours RNG-k-ε model and
306
radial vorticity magnitude profiles along Y-Z plane at N=70rpm (a) rotating disc boundary layer (b)
307
x=0.0015, (c) x=0.003725 (d) x=0.006.
308
4.1.2 Axial Distribution of the Hydrodynamic Quantities
309
The tangential velocity Uφ contours and profiles and the vorticity amplitude ζ contours and
310
profiles on the XZ plane are shown in Figs. 7a-c and 8a-c respectively. The axial tangential velocity
311
distribution shows a pattern consistent with Batchelor flow profile except on plane y=0 near the shaft
312
where the velocity is zero as expected. Figs. 7a-c show a varying pattern of Batchelor velocity
313
profiles but with distinct separated boundary layers and a central rotating core. By contrast, the
314
width of the rotor boundary layer is slightly longer and the rotating core slightly shorter when
315
compared to the Batchelor profile (Fig. 11b). In terms of the axial vorticity amplitude, all the profiles
316
seem to be identical as except on plane y=0 at the region close to the shaft where the vorticity
317
amplitude remains constant throughout the plane (Fig. 8a). Overall, the velocity and the vorticity
318
amplitude increases with the axial plane height with plane y=45 recording the highest magnitude.
319
However, there is a region of high vorticity mostly on the outer edge of the rotating disc close to the
320
reactor wall. This observation is quite interesting as it suggests that the clearance between the disc
321
and the reactor wall might strongly influence the vorticity magnitude. The influence of the gap ratio
322
G on the fluid flow cannot be ruled out and a detailed geometry parametric investigation prior to the
323
scale-up of the reactor in future can yield some useful data for design optimization.
324
325
326
(a)
328
(b)
329
330
(c)
331
Fig. 7: Reactor cross sections showing the velocity contours and axial tangential velocity profiles
332
along three horizontal lines on X-Z plane at N=70rpm—RNG model (a) y=0, (b) y=0.025 (c) y=0.045.
333
334
335
(a)
337
(b)
338
339
(c)
340
Fig. 8: Reactor cross sections showing the vorticity amplitude contours and axial vorticity magnitude
341
profiles along three horizontal lines on X-Z plane at N=70rpm—RNG model (a) y=0, (b) y=0.025 (c)
342
y=0.045.
343
4.1.3 Spatial Distribution of Mixing and Turbulence Intensities
344
The transport phenomena in any engineered system is often controlled by the fluid properties.
345
In the case of stirred tank, the turbulence kinetic energy, intensity or mixing rate of the fluid is the
346
controlling factor [40]. Therefore, in the design of flocculation reactors, it is desirable to have a
347
uniform mixing intensities in the agitation vessel. A quantification of spatial turbulence distribution
348
and mixing efficiency is often carried out on the basis of parameters such as turbulent kinetic energy
349
per unit mass and Reynolds stresses with the Reynolds stress defined as the time-averaged product
350
of velocity signal fluctuations in the fluid flow while the turbulent kinetic energy is the mean kinetic
351
energy per unit mass associated with the turbulent eddies or flow vortex [1,16], It has been
352
suggested that there is a strong correlation between the stirring behaviour in a mixing tank and the
353
turbulence amplitude [16,23]. Flow turbulence within the reactor was investigated at different radial
354
and axial planes to evaluate the mixing efficiency in the reactor. The spatial distribution of the
355
mixing intensities within the reactor expressed as a function of the normal time-averaged Reynolds
356
stresses is shown quantitatively in Fig. 9a, while Fig. 9b represents the turbulent kinetic
357
energy per unit mass k in terms of the operating speeds at some specific locations in the fluid
358
domain.
359
In turbulence modelling, the RSM model has been shown to give a more accurate prediction of
360
the turbulence effect especially for flows in which the assumption of isotropic turbulence does not
361
The radial distribution of the mixing intensity could be seen to increase with the radius with the
363
highest intensities concentrated on the outer edge of the rotating core while the axial distribution is
364
almost uniform for the lower planes except at y=45 and y=68 where there appears to be variations in
365
the mixing intensity. In terms of the operating speeds, the mixing intensities increases with the
366
radius and the operating speeds as expected in the radial direction. However, there seem to be a
367
region of lower mixing intensities at the reactor wheelspace in the rotating core which means that
368
there is only a marginal improvement in mixing at this location when the operating speed is
369
increased. Overall, the mixing appears to be fairly good except in the region close to the shaft
370
showing somewhat low mixing intensities a small area in the outer region of the rotating core with
371
high mixing intensities. One design modification to improve mixing in the region close to the shaft
372
might be the introduction of baffles on the disc to induce more swirling effect. Similarly, in the outer
373
region with high mixing intensities, the clearance between the disc and the wall can be adjusted to
374
make the mixing more uniform.
375
376
377
(a)
378
379
(b)
380
Fig. 9: Turbulent kinetic energy and Reynolds stresses using RSM model (a) Reynolds stresses’
381
distribution on YZ plane at x=0.0015, 0.003725 and 0.006 and XZ plane parallel to the shaft at y=0,
382
0.025, 0.045 and 0.068 (b) Turbulent kinetic energy distribution on YZ plane at x=0.003725 and XZ
383
plane parallel to the shaft at y=0.025 for N=70-130rpm.
384
4.1.4 Theoretical Validation of the CFD Model
385
Fig. 10 shows a comparison of the axial tangential velocity distribution on XZ plane with the
386
Batchelor model predictions. The axial flow streamline in the agglomeration reactor differs
387
somewhat from the Batchelor model and it is assumed that this might be due to differences in the
388
configuration of the rotor-stator systems employed for the studies. The streamlines can be
389
different gap ratios and flow streamlines. However, Fig. 10b shows the presence of separated
391
boundary layers on the rotor and the stator and a rotating core is clearly visible which is consistent
392
with the Batchelor predictions although with minor variation in terms of the extent of the boundary
393
layers. Overall, all the axial tangential velocity profiles (Fig. 7a-c and Fig. 11b) of the agglomeration
394
reactor confirm the presence of separated boundary layers on the rotor and the stator and an inviscid
395
rotating core.
396
397
398
(a)
399
400
401
(b)
402
Fig. 11: Flow streamlines for a cross sections of the reactor wheelspace and normalized axial
403
tangential velocity profiles on X-Z plane at N=70rpm (a) cross sections of CFD and Batchelor model
404
(b) tangential velocity profile of CFD and Batchelor model at y=0.068 [8].
405
5. Conclusions
406
A 3D computational model has been developed to investigate the hydrodynamic characteristics
407
and flow pattern in a rotating disc vortex reactor RVR. A steady state numerical simulation was
408
performed using a single reference frame SRF approach to describe the hydrodynamic interaction
409
between rotating disc and the mixing vessel. A fairly good agreement was obtained between the
410
results of the CFD and the available theoretical and experimental data. A subsequent analysis of the
411
spatial distribution of the hydrodynamic quantities shows that the tangential velocity increases as
412
expected radially across the rotating disc while decreasing in the axial direction with the vorticity
413
magnitude showing only a marginal increase in the radial direction except at the annular space
414
between the disc and the reactor wall, while it increases the axial direction. With respect to the
415
operating speed, the flow parameters’ values increase as expected with the operating speed across
416
high vorticity—rotation, and poor mixing within the reactor, which are quite useful information in
418
optimizing the reactor performance.
419
In terms of the fluid flow pattern, the axial velocity distribution across the wheelspace is
420
characterized by laminar Batchelor flow with separated boundary layers and an inviscid core that
421
rotates at a fraction of the rotor angular velocity with an axial pumping effect towards the shroud.
422
The radial tangential velocity profile taken on three planes along the reactor wheelspace however,
423
shows almost a linear distribution with a somewhat lower magnitude between the tip of the disc and
424
the reactor wall while the radial vorticity amplitude is nearly constant except around the tip of the
425
disc. It is anticipated that future studies will address the fluid-particle interactions within the reactor
426
towards a parametric optimization of the wet agglomeration process. A multiphase investigation of
427
the fluid-particle interactions within the reactor will provide an insight into the influence of the
428
hydrodynamics on the temporal and spatial evolution of the specie concentration in the reactor. This
429
information will help in understanding the interplay between the micro-hydrodynamics and the
430
physicochemical processes occurring within the reactor.
431
6. Patents
432
The reported rotor-stator RVR agglomeration reactor is a patented device registered with
433
German Patent and Trademark Office, Berlin, Germany with Patent No. DE10 2015 107 682 A1.
434
Funding: This research was funded by [The World Academy of Sciences TWAS and the National Research
435
Foundation NRF] under the funding instrument number [UID: 105553].
436
Author Contributions: Conceptualization, B.O. and G.A.; Methodology, B.O. and G.A.; Software, B.O. and
437
M.K.; Validation, B.O. and M.K., Formal Analysis, B.O.; Investigation, Data Curation, B.O. and M.K.;
438
Writing-Original Draft Preparation, B.O.; Writing-Review & Editing, B.O.; Visualization, M.K.; Project
439
Administration, G.A.; Funding Acquisition, B.O. and G.A.
440
Conflicts of Interest: The authors declare no conflict of interest.
441
Notations
442
Reφ Rotational Reynolds number [-]
443
ζ Vorticity magnitude [s-1 ]
444
G Gap ratio [-]
445
β Swirl ratio [-]
446
ρ Density (kgm-3)
447
δ Boundary layer thickness [m]
448
n Disc rotational speed [s-1 ]
449
x Radial coordinate [m]
450
z Axial coordinate [m]
451
rd Rotating disc outer radius [m]
452
s Wheelspace or cavity width [m]
453
μ Dynamic viscosity [kg m-1s-1]
454
ω Disc or plate angular velocity [rad s-1 ]
455
ω’ Angular velocity of the rotating core [m s-1]
456
Ω Disc tangential or tip velocity [ms-1]
457
Uφ Tangential velocity component [m s-1]
458
Ur Radial velocity component [m s-1]
459
Uz Axial velocity component [m s-1]
460
r Distance along the r-axis [m]
461
rs Shaft radius [m]
462
rr Reactor shroud radius [m]
463
References
468
1. Oyegbile, B. Optimization of Micro Processes in Fine Particle Agglomeration by Pelleting Flocculation; CRC Press:
469
Leiden, 2016; ISBN 978-1-138-02861-6.
470
2. Bache, D. H.; Gregory, R. Flocs in Water Treatment; IWA Publishing: London, 2007; ISBN 978-1-84339-063-3.
471
3. Buwa, V.; Dewan, A.; Nassar, A. F.; Durst, F. Fluid Dynamics and Mixing of Single-Phase Flow in a Stirred
472
Vessel with a Grid Disc Impeller: Experimental and Numerical Investigations. Chem. Eng. Sci. 2006, 61,
473
2815–2822, doi:10.1016/j.ces.2005.10.066.
474
4. Dewan, A.; Buwa, V.; Durst, F. Performance Optimizations of Grid Disc Impellers for Mixing of
475
Single-Phase Flows in a Stirred Vessel. Chem. Eng. Res. Des. 2006, 84, 691–702, doi:10.1205/cherd05044.
476
5. Utomo, A. T.; Baker, M.; Pacek, A. W. Flow Pattern, Periodicity and Energy Dissipation in a Batch
477
Rotor–Stator Mixer. Chem. Eng. Res. Des. 2008, 86, 1397–1409, doi:10.1016/j.cherd.2008.07.012.
478
6. Utomo, A.; Baker, M.; Pacek, A. W. The Effect of Stator Geometry on the Flow Pattern and Energy
479
Dissipation Rate in a Rotor-Stator Mixer. Chem. Eng. Res. Des. 2009, 87, 533–542, doi:10.1016/j.cherd.2008.12.011.
480
7. Shevchuk, I. V. Modelling of Convective Heat and Mass Transfer in Rotating Flows; Springer: Heidelberg, 2016;
481
ISBN 978-3-319-20960-9.
482
8. Childs, R. N. P. Rotating Flow; Elsevier: Oxford, 2011; ISBN 978-0-12-382098-3.
483
9. Gan, X. P.; MacGregor, S. A. Experimental Study of the Flow in the Cavity Between Rotating Disks. Exp.
484
Therm. Fluid Sci. 1995, 10, 379–387, doi:10.1016/0894-1777(94)00099-T.
485
10. Cheah, S. C.; Iacovides, H.; Jackson, D. C.; Ji, H.; Launder, B. E. Experimental Investigation of Enclosed
486
Rotor-Stator Disk Flows. Exp. Therm. Fluid Sci. 1994, 9, 445–455, doi:10.1016/0894-1777(94)90022-1.
487
11. Tu, J.; Yeoh, G. H.; Liu, C. Computational Fluid Dynamics: A Practical Approach; 3rd ed.;
488
Butterworth-Heinemann: Oxford, 2018; ISBN 978-0-08-101127-0.
489
12. Crowe, C. T.; Schwarzkopf, J. D.; Sommerfeld, M.; Tsuji, Y. Multiphase Flows with Droplets and Particles,
490
Second Edition; CRC Press: Boca Raton, FL, 2011; ISBN 978-1-4398-4050.
491
13. Naessens, W.; Maere, T.; Nopens, I. Critical Review of Membrane Bioreactor Models – Part 1: Biokinetic
492
and Filtration Models. Bioresour. Technol. 2012, 122, 95–106, doi:10.1016/j.biortech.2012.05.070.
493
14. Naessens W.; Maere, T.; Ratkovich, N.; Vedantam, S.; Nopens, I. Critical Review of Membrane Bioreactor
494
Models – Part 2: Hydrodynamic and Integrated Models. Bioresour. Technol. 2012, 122, 107–118,
495
doi:10.1016/j.biortech.2012.05.071.
496
15. Oyegbile, B.; Hoff, M.; Adonadaga, M.; Oyegbile, B. Experimental Analysis of the Hydrodynamics, Flow
497
Pattern and Wet Agglomeration in Rotor-Stator Vortex Separators. J. Environ. Chem. Eng. 2017, 5, 2115–2127,
498
doi:10.1016/j.jece.2017.04.016.
499
16. Thomas, S. F.; Rooks, P.; Rudin, F.; Cagney, N.; Balabani, S.; Atkinson, S.; Goddard, P.; Bransgrove, R. M.;
500
Mason, P. T.; Allen, M. J. Swirl Flow Bioreactor Containing Dendritic Copper-Containing Alginate Beads: A
501
Potential Rapid Method for the Eradication of Escherichia Coli from Waste Water Streams. J. Water Process Eng.
502
2015, 5, 6–14, doi:10.1016/j.jwpe.2014.10.010.
503
17. Sievers, M.; Stoll, S. M.; Schroeder, C.; Niedermeiser, M.; Onyeche, T. I. Sludge Dewatering and Aggregate
504
Formation Effects through Taylor Vortex Assisted Flocculation. Sep. Sci. Technol. 2008, 43, 1595–1609,
505
doi:10.1080/01496390801973888.
506
18. Wang, X. .; Jin, P. .; Yuan, H. .; Wang, E. .; Tambo, N. Pilot Study of a Fluidized-Pellet-Bed Technique for
507
Simultaneous Solid/liquid Separation and Sludge Thickening in a Sewage Treatment Plant. Water Sci. Technol.
508
2004, 49, 81–88.
509
19. Dionysiou, D. D.; Balasubramanian, G.; (M), M. T. S.; Khodadoust1, A. P.; Baudin, I.; Laîné, J.-M. Rotating
510
Disk Photocatalytic Reactor: Development, Characterization, and Evaluation for the Destruction of Organic
511
Pollutants in Water. Water Res. 2000, 34, 2927–2940, doi:10.1016/S0043-1354(00)00022-1.
512
20. Loraine, G.; Chahine, G.; Hsiao, C.-T.; Choi, J.-K.; Aley, P. Disinfection of Gram-Negative and
513
Gram-Positive Bacteria Using DynaJets® Hydrodynamic Cavitating Jets. Ultrason. Sonochem. 2012, 19, 710–717,
514
21. Kaiser, S. C.; Eibl, R.; Eibl, D. Engineering Characteristics of a Single-use Stirred Bioreactor at Bench-scale
516
The Mobius CellReady 3L Bioreactor as a Case Study. Eng. Life Sci. 2011, 11, 359–368, doi:10.1002/elsc.201000171.
517
22. Gao, X.; Kong, B.; Vigil, R. D. Comprehensive Computational Model for Combining Fluid
518
Hydrodynamics, Light Transport and Biomass Growth in a Taylor Vortex Algal Photobioreactor: Lagrangian
519
Approach. Bioresour. Technol. 2017, 224, 523–530, doi:10.1016/j.biortech.2016.10.080.
520
23. Escamilla-Ruíz, I. A.; Sierra-Espinosa, F. Z.; García, J. C.; Valera-Medina, A.; Carrillo, F. Experimental Data
521
and Numerical Predictions of a Single-Phase Flow in a Batch Square Stirred Tank Reactor with a Rotating
522
Cylinder Agitator. Heat Mass Transf. 2017, 53, 2933–2949, doi:10.1007/s00231-017-2030-7.
523
24. Liu, Z.; Mahdi, R.; Fox, R. O.; Hill, J. C.; Olsen, M. G. Flow Characteristics in a Scaled-up Multi-inlet Vortex
524
Nanoprecipitation Reactor. Ind. Eng. Chem. Res. 2015, 54, 4512–4525, doi:10.1021/ie5041836.
525
25. Liu, Z.; Fox, R. O.; Hill, J. C.; Olsen, M. G. A Batchelor Vortex Model for Mean Velocity of Turbulent
526
Swirling Flow in a Macroscale Multi-Inlet Vortex Reactor. J. Fluids Eng. 2015, 137, 041204-041204–6,
527
doi:10.1115/1.4028784.
528
26. Oyegbile, B.; Ay, P.; Narra, S. Optimisation of Micro- Processes for Shear Assisted Solid-Liquid Separation
529
in a Rotatory Batch Flow Vortex Reactor. J. Water Reuse Desalination 2016, 6, 125–136, doi:10.2166/wrd.2015.057.
530
27. Serra, T.; Colomer, J.; Logan, B. E. Efficiency of Different Shear Devices on Flocculation. Water Res. 2008, 42,
531
1113–1121, doi:10.1016/j.watres.2007.08.027.
532
28. Raffel, M.; Willert, C. E.; Wereley, S. T.; Kompenhans, J. Particle Image Velocimetry: A Practical Guide;
533
Springer: Heidelberg, 2007; ISBN 978-3-540-72307-3.
534
29. Adrian, R. J.; Westerweel, J. Particle Image Velocimetry; Cambridge University Press: New York, NY, 2011;
535
ISBN 978-0-521-44008-0.
536
30. Bridgeman, J.; Jefferson, B.; Parsons, S. A. Computational Fluid Dynamics Modelling of Flocculation in
537
Water Treatment: A Review. Eng. Appl. Comput. Fluid Mech. 2009, 3, 220–241,
538
doi:10.1080/19942060.2009.11015267.
539
31. Marshall, E. M.; Bakker, A. Computational Fluid Mixing. In Handbook of Industrial Mixing: Science and
540
Practice; Paul, E. L., Atiemo-Obeng, V. A., Kresta, S. M., Eds.; John Wiley & Sons: Hoboken, NJ, 2004; pp.
541
257–343 ISBN 978-0-471-45145-7.
542
32. ANSYS, Inc. ANSYS Fluent Theory Guide 18.2 2017.
543
33. ANSYS, Inc. ANSYS Fluent User’s Guide 18.2 2017.
544
34. Lian, G.; Moore, S.; Heeney, L. Population Balance and Computational Fluid Dynamics Modelling of Ice
545
Crystallisation in a Scraped Surface Freezer. Chem. Eng. Sci. 2006, 61, 7819–7826, doi:10.1016/j.ces.2006.08.075.
546
35. Das, S.; Bai, H.; Wu, C.; Kao, J.-H.; Barney, B.; Kidd, M.; Kuettel, M. Improving the Performance of
547
Industrial Clarifiers Using Three-Dimensional Computational Fluid Dynamics. Eng. Appl. Comput. Fluid Mech.
548
2016, 10, 130–144, doi:10.1080/19942060.2015.1121518.
549
36. Schellander, D. CFD Simulations of Particle Laden Flow: Particle Transport and Separation; Anchor Academic
550
Publishing: Hamburg, 2014; ISBN 978-3-95489-171-9.
551
37. Norouzi, H. R.; Zarghami, R.; Sotudeh-Gharebagh, R.; Mostoufi, N. Coupled CFD-DEM Modeling:
552
Formulation, Implementation and Application to Multiphase Flows; John Wiley & Sons: Chichester, 2016; ISBN
553
978-1-119-00513-1.
554
38. Higashitani, K.; Shibata, T.; Matsuno, Y. Formation of Pellet Flocs from Kaolin Suspension and their
555
Properties. J. Chem. Eng. Jpn. 1987, 20, 152–157.
556
39. Walaszek, W.; Ay, P. Pelleting Flocculation—An Alternative Technique to Optimise Sludge Conditioning.
557
Int. J. Miner. Process. 2005, 76, 173–180, doi:10.1016/j.minpro.2005.01.001.
558
40. Oyegbile, B.; Ay, P.; Narra, S. Flocculation Kinetics and Hydrodynamic Interactions in Natural and
559
Engineered Flow Systems-A Review. Environ. Eng. Res. 2016, 21, 1–14, doi:10.4491/eer.2015.086.
![Fig. 1: Schematic illustration of the reactor configuration and flow profiles (a) RVR reactor (b) rotor-stator flow boundary layers showing the tangential velocity and vorticity amplitude profiles on the rotating disc (Reproduced from [8] with permissions](https://thumb-us.123doks.com/thumbv2/123dok_us/7966308.1321289/3.595.107.500.339.463/schematic-illustration-configuration-tangential-vorticity-amplitude-reproduced-permissions.webp)