International Journal of Nanomedicine
Application of the central composite design
to optimize the preparation of novel
micelles of harmine
Yong-Yan Bei1,* Xiao-Feng Zhou2,3,* Ben-Gang You1 Zhi-Qiang Yuan1 Wei-Liang Chen1 Peng Xia1 Yang Liu1 Yong Jin4 Xiao-Juan Hu1 Qiao-Ling Zhu1 Chun-Ge Zhang1 Xue-Nong Zhang1 Liang Zhang5
1Department of Pharmaceutics, College of
Pharmaceutical Sciences, Soochow University, Suzhou 215123, People’s Republic of China;
2College of Radiological Medicine and
Protection, Soochow University, Suzhou,
People’s Republic of China; 3Changshu
Hospital of Traditional Chinese Medicine, Changshu, People’s Republic of China;
4Invasive Technology Department, The Second
Affiliated Hospital of Soochow University,
Suzhou, People’s Republic of China;
5Department of Biopharmaceutics, College of
Pharmaceutical Sciences, Soochow University, Suzhou, People’s Republic of China
*These authors contributed equally to the paper
Correspondence: Xue-Nong Zhang Department of Pharmaceutics, College of Pharmaceutical Science, Soochow University, DuShuHu High Education Zone, Suzhou 215123,
Jiang Su Province, People’s Republic of China
Tel +86 512 6588 2087
Email [email protected]
Liang Zhang
Department of Biopharmaceutics, College of Pharmaceutical Sciences, Soochow University, Suzhou 215123, People’s Republic of China Email [email protected]
Abstract: Lactose–palmitoyl–trimethyl–chitosan (Lac-TPCS), a novel amphipathic self-assembled polymer, was synthesized for administration of insoluble drugs to reduce their adverse effects. The central composite design was used to study the preparation technique of harmine (HM)-loaded self-assembled micelles based on Lac-TPCS (Lac-TPCS/HM). Three preparation methods and single factors were screened, including solvent type, HM amount, hydration volume, and temperature. The optimal preparation technique was identified after investigating the influence of two independent factors, namely, HM amount and hydration volume, on four indexes, ie, encapsulation efficiency (EE), drug-loading amount (LD), particle size, and polydispersity index (PDI). Analysis of variance showed a high coefficient of determi-nation of 0.916 to 0.994, thus ensuring a satisfactory adjustment of the predicted prescription. The maximum predicted values of the optimal prescription were 91.62%, 14.20%, 183.3 nm, and 0.214 for EE, LD, size, and PDI, respectively, when HM amount was 1.8 mg and hydration volume was 9.6 mL. HM-loaded micelles were successfully characterized by Fourier-transform infrared spectroscopy, differential scanning calorimetry, X-ray diffraction, and a fluorescence-quenching experiment. Sustained release of Lac-TPCS/HM reached 65.3% in 72 hours at pH 7.4, while free HM released about 99.7% under the same conditions.
Keywords: harmine, chitosan derivate, self-assembled micelle, central composite design, response surface methodology, characterization
Introduction
An effective delivery system for hydrophobic drugs such as liposomes and nanoparticles is needed to achieve their best utilization. In recent years, an amphipathic copolymer was developed, which self-assembles into a nanomicelle in water with a core-shell structure.1–3 Compared with liposomes and nanoparticles, polymeric micelles have
a good thermodynamic stability. Their hydrophobic core can become a reservoir of insoluble drugs with high drug-loading amounts (LDs) and long retention time in vivo, which could increase their solubility and improve bioavailability as a result.4,5
An insoluble alkaloid harmine (HM) isolated from a traditional Chinese medicinal plant, Peganum harmala Linn, was chosen as a model drug, because HM has low bioavailability due to its poor solubility.6–8
In order to obtain satisfactory bioavailability, increasing the encapsulation efficiency (EE) and LD of HM is required. According to previous studies, preparing micelles usually include chemical binding, physical entrapment, dialysis, oil-in-water emul-sion, solvent evaporation, and freeze-drying.9–12 The method of preparation was first
selected according to the properties of HM. Central composite design-response surface
Dovepress
O R I G I N A L R E S E A R C H
open access to scientific and medical research
Open Access Full Text Article
International Journal of Nanomedicine downloaded from https://www.dovepress.com/ by 118.70.13.36 on 23-Aug-2020
For personal use only.
Number of times this article has been viewed
This article was published in the following Dove Press journal: International Journal of Nanomedicine
methodology (CCD-RSM) is the preferred method to further optimize the preparation with a nonlinear model to fit the experimental data.13–15 Compared with common traditional
Chinese methods, such as orthogonal design and uniform design, RSM has higher accuracy. When a combination of several independent variables and their interactions affect the desired responses, the accuracy can be fully demonstrated, and the adequacy of the proposed model can be revealed using the diagnostic tests provided by analysis of variance (ANOVA).16,17 Response surface plots can be used to study
surfaces and to locate the optimal response to achieve maxi-mized EE and LD.18,19
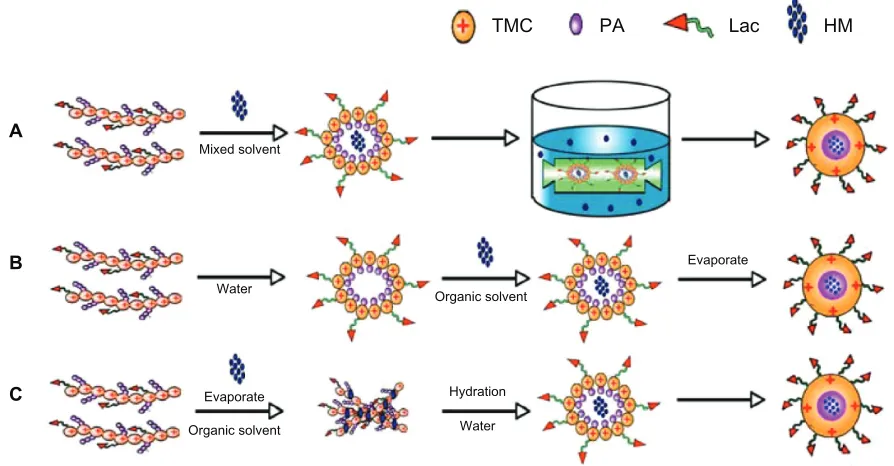
Therefore, the focus of this research was to optimize the preparation of the self-assembled micelles of harmine based on a novel amphipathic polymer, lactose–palmitoyl– trimethyl–chitosan (Lac-TPCS). We used CCD-RSM to optimize the prescription process by choosing particle size distribution, EE, LD, and polydispersity index (PDI) as the four evaluation indicators. After preparing HM-loaded micelles by CCD-RSM, we validated micelles with high EE and LD using four characterization methods. The structure of TPCS/HM is shown in Figure 1A. This study can provide strong groundwork for future in vivo experiments.20,21
Materials and methods
Drugs and reagents
Chitosan (8 kDa to 10 kDa) was purchased from Okinari Biochemical Factory (Nantong, Jiangsu, People’s Republic of China). HM with 95.3% purity was extracted and separated in our laboratory. Sodium iodide and iodomethane were
purchased from Aladdin Reagent Co, Ltd (Shanghai, People’s Republic of China), and palmitic acid (PA) was obtained from Shanghai solarbio Bioscience and Technology Co, Ltd (Shanghai, People’s Republic of China). 1-(3-Dimethylamin opropyl)-3-ethyl carbon carbodiimide hydrochloride (EDC) and N-hydroxysuccinimide (NHS) were procured from an extension of the Biochemical Science and Technology Devel-opment Co, Ltd (Shanghai, People’s Republic of China). Dialysis bags were purchased from the Reagan Biological Co, Ltd (molecular weight cut-off [MWCO]: 10,000–12,000) (Beijing, People’s Republic of China). Anhydrous methanol (high-performance liquid chromatography [HPLC] grade) was obtained from the Kermel Chemical Reagent Development Center (Tianjin, People’s Republic of China).
Construction of Lac-TPCS
The synthetical route was shown in Figure 1B. TPCS was first synthesized as described previously.22 Up to 0.35 g (1.0 mmol)
of activated PA was dissolved in 50 mL methanol, and 1 g (1.6 mmol) trimethyl–chitosan was dissolved in 50 mL distilled water. The latter was added dropwise to the former, and then reacted for 24 hours under 50°C. The mixture was added to a dialysis bag (MW = 10,000–12,000), dialyzed for 3 days, and centrifuged at 3000 rpm for 10 minutes. The supernatant was freeze-dried. Using TPCS as a base, lactobionic acid(Lac) was attached to TPCS with EDC and NHS as cross-linking agents (Lac/TPCS/EDC/NHS ratio of 0.44:1:0.26:0.13, by weight).23 After incubation, the mixture
was transferred to a dialysis bag (MW = 10,000–12,000). After dialysis for 3 days, the mixture was centrifuged
CH2OH
NH2
CH3 CH2 COO N
O O O OH OH OH OH OH OH HO HO HO O 14 EDC NHS
OH O O CH2OH
NH2
OH O O CH2OH
NH2
CH3I
OH O O
CH2OH
CH3 CH3Cl−
CH3
N+
OH O O CH2OH
NH2
CH2 CH3
OH O O CH2OH
NH2
OH O O
CH2OH
COO HN
OH O O O
CH2OH
OH O O CH2OH
CH3 CH3Cl −
CH3
N+
OH O O CH2OH
NH2
OH O O CH2OH
OH NHCOO O O 14 x
CH3 CH3Cl −
CH3
N+
CH2OH
OH O
CH2 CH3
NHCOO 14 EDC NHS TMC TPCS Lac-TPCS O OH OH OH OH OH HO HO HO
TMC PA HM Lac
A B
Figure 1 (A)Illustration of the structure of Lac-TPCS/HM. (B) Synthetic procedure.
Abbreviations: TMC, trimethyl–chitosan; PA, palmitic acid; HM, harmine; Lac, lactobionic acid; Lac-TPCS, lactose–palmitoyl–trimethyl–chitosan; Lac-TPCS/HM, harmine-loaded micelles based on lactose–palmitoyl–trimethyl–chitosan.
Dovepress
Bei et al
International Journal of Nanomedicine downloaded from https://www.dovepress.com/ by 118.70.13.36 on 23-Aug-2020
at 3000 rpm for 10 minutes, and the supernatant was freeze-dried to obtain Lac-TPCS. Proton nuclear magnetic resonance (1H-NMR) characterization was used to verify
the formation of graft polymers by UNITY INOVA 400 (400 MHz) (Varian Medical Systems Inc, Palto Alto, CA, USA), the results are shown in Figure 2. Viscosity-average MW was measured with a Ubbelohde Viscometer (type 1836; Shanghai, People’s Republic of China).
Analysis of HM by HPLC
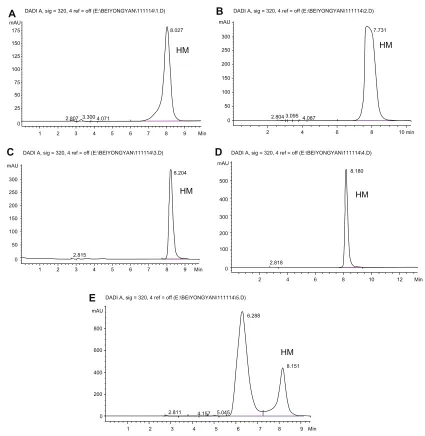
HPLC (1260 Infinity; Agilent, Bobingen, Germany) was used to examine the stability of HM (200 µg/mL) in different organic solvents, including acetone, ethanol, acetonitrile, ethyl acetate, and methanol (Figure 3). Column: ODS2-C18; mobile phase: methanol: 0.01 mol/L ammonium sulfate solution:diethylamide (40:60:1) pH was adjusted to 3.8 ± 0.1 with phosphoric acid; detection wavelength: 320 nm; flow rate: 1.0 mL/min; column temperature: 30°C; injection volume: 20 µL.24 HPLC was used
to measure HM to obtain its standard curve.
Screening of different methods
We used three methods25–27 to prepare HM-loaded micelles
when the amount was fixed to 10 mg Lac-TPCS and 1 mg HM.
The prepared solution was filtered with 0.45 µm Millipore (Millipore Inc., Billerica, MA, USA) filter to obtain HM-loaded micelles. A specific amount of HM-HM-loaded micelles was obtained, and then the solution was subjected to ultracen-trifugation (4°C, 30,000 rpm, 45 minutes). The supernatant was diluted with equal volume of methanol, and 20 µL was infused into HPLC to detect unentrapped drug concentrations. EE was calculated according to equation (1). According to the amount of Lac-TPCS and HM, together with the EE and the recovery results, LD was calculated using equation (2).
E total HM u traped HM
total HM
E%=W −Wnen × 0 %
W 1 0 (1)
LD entr ped HM
entraped HM polymer
%= %
+ ×
W
W W
ap
100 (2)
Dialysis method
As shown in Figure 4A, 10 mL blank micelles (10 mg/mL) were first prepared. Then, 2 mL HM methanol solution (0.5 mg/mL) was slowly added dropwise to the former solution and magneti-cally stirred for 6 hours. The entire system was volatilized under
−0.5 0.0
1.0 0.5
2.0 1.5
3.0 2.5
N(CH3)3
N(CH3)2
NHCOCH3
CH2
CH3
4.0 3.5
f1 (ppm)
A
B
C
D
E
5.0 4.5
6.0 5.5
7.0 6.5
Figure 2 1H-NMRspectra. (A) CS. (B) TMC. (C) PA. (D) TPCS. (E) Lac-TPCS.
Abbreviations: CS, chitosan; TMC, trimethyl–chitosan; PA, palmitic acid; TPCS: palmitoyl–trimethyl–chitosan; Lac-TPCS, lactose–palmitoyl–trimethyl–chitosan; ppm, parts per million.
Dovepress CCD in preparation of novel micelles of harmine
International Journal of Nanomedicine downloaded from https://www.dovepress.com/ by 118.70.13.36 on 23-Aug-2020
40°C to remove excess methanol. The remaining solution was then placed in the dialysis bag (MW = 10,000–12,000) and dialyzed with distilled water for 12 hours. Distilled water was changed every hour for the first 3 hours, and every 3 hours for the last 9 hours.
Solvent evaporation method
As shown in Figure 4B, 1 mL HM methanol solution (1 mg/mL) was prepared as an oil phase and 10 mL blank micelle solution was used as an aqueous phase. A methanol solution was added dropwise to the aqueous phase under rapid stirring to form a water–oil mixture, and then methanol was volatilized under 40°C. A 0.45 µm Millipore filter was used to remove free drug and polymer aggregates to form drug-loaded micelles.
Film dispersion method
As shown in Figure 4C, 10 mg polymer was added to 2 mL HM methanol solution (1 mg/mL). The entire system was placed in a eggplant type flask. A solid film formed after the organic solvent was volatilized using a rotary evaporator under 65°C and 300 rpm. The system was slowly reconstituted with 10 mL pure water with a speed of 10 seconds/drop. A 0.45 µm Millipore filter was used to remove free drug and polymer aggregates.
The particle size distribution and PDI of the micelles prepared with three methods mentioned above were measured by dynamic light scattering (DLS; Zetasizer Nano ZS; Malvern, Malvern, UK). The results of the comparison of three methods are shown in Table 1.
mAU mAU
DADI A, sig = 320, 4 ref = off (E:\BEIYONGYAN\111114\1.D) DADI A, sig = 320, 4 ref = off (E:\BEIYONGYAN\111114\2.D)
DADI A, sig = 320, 4 ref = off (E:\BEIYONGYAN\111114\3.D) DADI A, sig = 320, 4 ref = off (E:\BEIYONGYAN\111114\4.D)
DADI A, sig = 320, 4 ref = off (E:\BEIYONGYAN\111114\5.D)
A
C
175
300
2.804 3.095 4.087
7.731
250
200
150
100
50
0 150
125
2.807 3.300 4.071
8.027
HM
HM
HM
HM HM
B
D
E
100
75
50
25
0
mAU
300
250
200
150
100
50
0 2.815
8.204
mAU
500
400
300
200
100
0
2 4 6 8 10 12 Min
2.818
8.180
1 2
mAU
800
600
400
200
0
1 2 3
2.811 4.157 5.045
4 5 6 7 8 9 Min
3 4 5 6 7 8 9 Min
1 2 3 4 5 6 7 8 9 Min 2 4 6 8 10 min
6.288
8.151
Figure 3 HPLCdiagram of HM dissolved in different solvent. (A) Acetone. (B) Acetonitrile. (C) Ethanol. (D) Methanol. (E) Ethyl acetate.
Abbreviations: HPLC,high-performance liquid chromatography; HM, harmine.
Dovepress
Bei et al
International Journal of Nanomedicine downloaded from https://www.dovepress.com/ by 118.70.13.36 on 23-Aug-2020
Optimization of the preparation process
Single-factor investigation
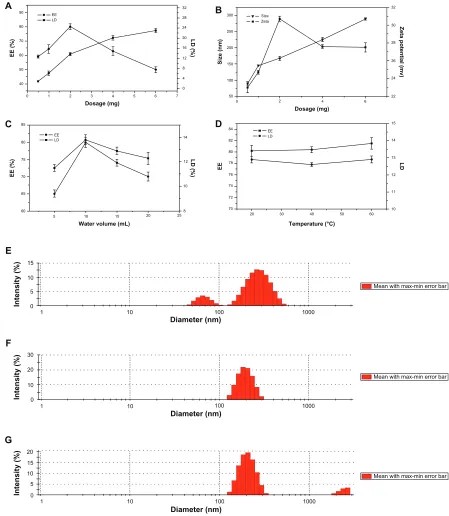
1. Influence of different drug amounts: the amount has an important function in micelle formation. Thus, we selected EE, LD, particle size, and zeta potential as four indexes to investigate HM-loaded micelles with 10 mg Lac-TPCS, 10 mL hydration volume, and different amounts of HM at 0.5, 1, 2, 4, and 6 mg (Figure 5A and B).
2. Influence of hydration volume: hydration volume can also influence micelle formation. Thus, we measured EE and LD at hydration volumes of 5, 10, 15, and 20 mL with 10 mg Lac-TPCS and 2 mg HM (Figure 5C).
3. Influence of hydration temperature: HM is relatively stable within a certain temperature range. Thus, we chose 20°C, 40°C, and 60°C as hydration temperatures to inspect the changes of EE and DL (Figure 5D and E).28
CCD-RSM to optimize prescription
According to the previous results of a single-factor investigation, we used methanol as organic phase and
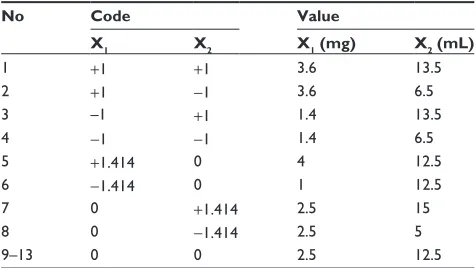
distilled water as aqueous phase. Thirteen prescriptions were prepared to measure EE and LD (Tables 2–5). Fitting parameters were obtained with multivariate linear regression using Statistica 7.0 (Statsoft Inc., Tulsa, OK, USA) (Tables 6 and 7; Figures 6 and 7).
Characterization and properties
of HM-loaded micelles
The formation of HM-loaded micelles were proven by FT-IR (ProStar LC240; Varian Medical Systems Inc), XRD (X‘Pert-PRO MPD; PANalytical, Lelyweg, The Netherlands), and DSC (SDT 2960; TA Instruments, New Castle, DE, USA) after micelles of the optical prescription were lyophilized.29
The characterization results are shown in Figures 8–10. Fluorescence quenching was used to prove the formation of HM-loaded micelles.30 The fluorescence intensity of each
sample was measured using a fluorescence spectrophotometer (LS-55; Perkin-Elmer, Shelton, CT, USA) with excitation and emission wavelengths of 250 and 460 nm, respectively. In this study, I−1 was used as a typical ionic fluorescence quencher.
Mixed solvent
Water
Water Hydration Evaporate
Organic solvent
Organic solvent
Evaporate
TMC PA Lac HM
A
B
C
Figure 4 Illustrationof different methods to prepare Lac-TPCS/HM. (A) Dialysis method. (B) Solvent evaporation method. (C) Film dispersion method.
Abbreviations: TMC,trimethyl–chitosan; PA, palmitic acid; HM, harmine; Lac, lactobionic acid; Lac-TPCS/HM, harmine-loaded micelles based on lactose–palmitoyl– trimethyl–chitosan.
Table 1 Comparison of different methods (n = 3)
Method EE (%) LD (%) Particle size PDI
Dialysis method 70.21 ± 0.25 12.34 ± 1.23 200.3 ± 5.6 0.167 ± 0.127
Solvent evaporation method 75.34 ± 0.28 13.15 ± 2.36 240.2 ± 10.2 0.345 ± 0.258 Film dispersion method 80.25 ± 1.35 13.82 ± 1.27 189.8 ± 8.9 0.289 ± 0.023
Abbreviations: EE, encapsulation efficiency; LD, drug-loading amount; PDI, particle size.
Dovepress CCD in preparation of novel micelles of harmine
International Journal of Nanomedicine downloaded from https://www.dovepress.com/ by 118.70.13.36 on 23-Aug-2020
A
C
B
D
90 EE
LD
EE LD
EE LD
32 32
30
28
26
24
22
15
14
13
12
11
10 250
300 Size
Zeta
Size (nm)
200
150
100
50
84
82
80
78
76
EE
74
72
70
20 30 40 50 60
0 2 4 6
28
24
20
16
12
8
4
0 80
70
60
50
40
0 1 2 3
Dosage (mg) Dosage (mg)
Temperature (°C)
LD (%
)
LD (%)
Zeta potential (mv)
LD
EE (%)
4 5 6 7
85
14
12
10
8 80
75
70
65
60
5 10
Water volume (mL)
EE (%)
15 20 25
15
10
5
0
1 10
Diameter (nm)
Intensity (%
)
100 1000
30
20
10
0
1 10
Diameter (nm)
Intensity (%)
100 1000
20
15 10
0 5
1 10
Diameter (nm)
Intensity (%)
100 1000
F
G E
Mean with max-min error bar
Mean with max-min error bar
Mean with max-min error bar
Figure 5 Influence of single factor. (A) Influence of HM amount on EE and LD. (B) Influence of HM amount on size and zeta potential. (C) Influence of water volume.
(D) Influence of hydration temperature on EE and LD. Influence of hydration temperature on particle size: (E) 20°C; (F) 40°C; (G) 60°C.
Abbreviations: EE, encapsulation efficiency; LD, drug-loading amount.
Its quenching effect on HM coincides with the Stern–Volmer equation (equation [3]):
F0/F= 1 +Ksv [I−1] (3)
where F and F0 represent the fluorescence intensity in the presence or absence of I−1, respectively. K
sv is the
Stern–Volmer quenching constant (Figure 11).
Five batches of HM-loaded micelles were prepared according to the optimum prescription which was obtained from above CCD-RSM method. The lyophilized powder was reconstituted with appropriate volume of distilled water. Particle size distribution, zeta potential, and PDI of the micelles were measured by DLS (Zetasizer Nano ZS; Malvern). A known amount of the micellar solution was diluted with Dovepress
Bei et al
International Journal of Nanomedicine downloaded from https://www.dovepress.com/ by 118.70.13.36 on 23-Aug-2020
the appropriate volume of 5% glucose solution. After drying, HM-loaded micelles were observed by transmission electron microscopy (H-600; Hitachi, Tokyo, Japan) (Figure 12).
In our study of the in vitro release, 5 mL Lac-TPCS/HM was drawn into the pretreated dialysis bag, and then the bag was placed in a beaker containing 50 mL dialysis medium for water bath oscillation (37°C ± 1°C) under 100 rpm. 1 mL solution was drawn from the dialysis bag and an equal amount of medium was added at 0, 0.5, 1, 2, 4, 8, 12, 24, 48 and 72 hours respectively. HM concentration was analyzed by injecting 20 µL into HPLC. HM and Lac-TPCS/HM release in phosphate buffered saline at pH = 5.3, 6.8, and 7.4 was also investigated (Figure 13).31
Results and discussion
Validation of Lac-TPCS
In Figure 2D, the 1H-NMR spectrum of
trimethyl-palmitoyl-chitosan was different from that of trimethyl-palmitoyl-chitosan. δ = 3.1 ppm represented N(CH3)3 peak, N(CH3)2 peaks appeared at δ= 2.4 ppm, δ= 1.2 ppm, and δ= 1.0 ppm corresponding to the proton peaks of CH2 and CH3 in the PA chain. Comparing Figure 2C and D, we found that the CH2 and CH3 signals of TPCS were weak in D2O solvent. Hydrophobic palmitoyl gathered in the micellar core due to self-aggregation, so the 1H-NMR signal
was weakened. The phenomenon also showed that TPCS had strong micellar behavior in D2O. A new proton signal at about δ= 2.37 can be attributed to the proton signal of lactobionic acid connected with chitosan, and also a very obvious proton peak at δ= 4.79 was consistent with lactobionic acid, indicating that the lactobionic acid has been successfully grafted to the polymer molecules (Figure 2E). Viscosity and average MW of Lac-TPCS was about 9.9 ± 1.3 kDa.
Analysis of HM
The blank solvent including acetone, ethanol, acetonitrile, ethyl acetate, and methanol did not interfere with the HM analysis (Figure 3). The sample peak became blunt after it was
dissolved in ethanol. Poor symmetry was found in acetone and acetonitrile. Doublet peaks were also observed in ethyl acetate. However, in methanol, the sample peak was sharp and had positive symmetry with retention time of about 8.0 minutes. According to the results, HM was well dispersed and stable in methanol. Thus, methanol was selected as the organic solvent for micelle preparation. We obtained HM regression equation A = 71.426 C + 4.934, r = 0.9998, which had satisfactory linearity in 0.5 µg/mL to 100.0 µg/mL range, indicating that the precision of our method and recovery results met well with the requirements of our analytical method.
Selection of different methods
to prepare HM-loaded micelles
EE and LD of dialysis and solvent evaporation were lower than those of film dispersion. This result was ascribed to the good solubility of HM in methanol. A significant distribution was observed in methanol.
In film dispersion, we first dispersed Lac-TPCS in the organic solution of HM using a rotary evaporator to form a homogeneous solid film. Then, water was slowly added so that HM was gradually captured and solubilized into the micelle hydrophobic core of Lac-TPCS; this method was relatively simple and easily conducted.32 Thus, we chose
film dispersion as the preparation method.
Optimization of the preparation process
Single-factor investigation
The amount of Lac-TPCS and hydration volume were fixed (Figure 5A). When the HM amount was increased, EE first increased and then decreased, showing an inverted bell curve. By contrast, LD first showed a significant increase, followed by a gradual increase. Zeta potential showed the same trend with DL, whereas particle size exhibited an increasing trend. The results show that HM amount significantly influenced EE and LD (Figure 5B). Thus,
Table 4 Code and value distribution
No Code Value
X1 X2 X1 (mg) X2 (mL)
1 +1 +1 3.6 13.5
2 +1 −1 3.6 6.5
3 –1 +1 1.4 13.5
4 −1 −1 1.4 6.5
5 +1.414 0 4 12.5
6 −1.414 0 1 12.5
7 0 +1.414 2.5 15
8 0 −1.414 2.5 5
9–13 0 0 2.5 12.5
Notes: X1, the amount of harmine; X2, the hydration volume.
Table 2 Factors and values
Factors Ranges
X1 Amount 1–4 mg
X2 Hydration volume 5–15 mL
Notes: X1, the amount of harmine; X2, the hydration volume.
Table 3 Prescription and the variable level of codes
Code −1.414 −1 0 +1 +1.414
X1 1 1.4 2.5 3.6 4
X2 5 6.5 12.5 13.5 15
Notes: X1, the amount of harmine; X2, the hydration volume.
Dovepress CCD in preparation of novel micelles of harmine
International Journal of Nanomedicine downloaded from https://www.dovepress.com/ by 118.70.13.36 on 23-Aug-2020
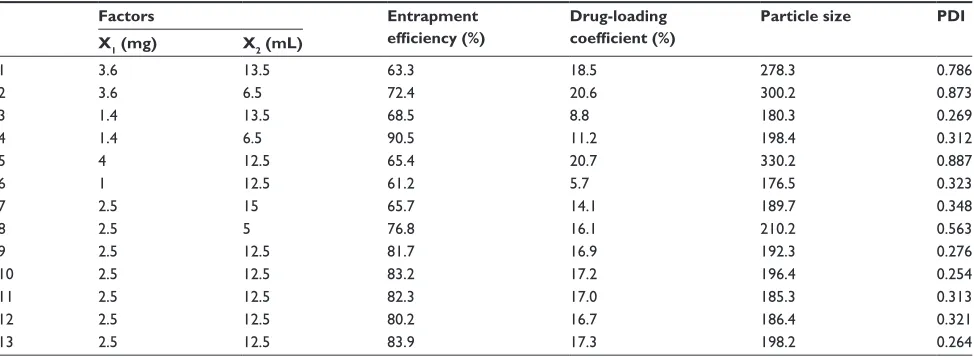
Table 5 Central composite design results
Factors Entrapment
efficiency (%)
Drug-loading coefficient (%)
Particle size PDI
X1 (mg) X2 (mL)
1 3.6 13.5 63.3 18.5 278.3 0.786
2 3.6 6.5 72.4 20.6 300.2 0.873
3 1.4 13.5 68.5 8.8 180.3 0.269
4 1.4 6.5 90.5 11.2 198.4 0.312
5 4 12.5 65.4 20.7 330.2 0.887
6 1 12.5 61.2 5.7 176.5 0.323
7 2.5 15 65.7 14.1 189.7 0.348
8 2.5 5 76.8 16.1 210.2 0.563
9 2.5 12.5 81.7 16.9 192.3 0.276
10 2.5 12.5 83.2 17.2 196.4 0.254
11 2.5 12.5 82.3 17.0 185.3 0.313
12 2.5 12.5 80.2 16.7 186.4 0.321
13 2.5 12.5 83.9 17.3 198.2 0.264
Notes: X1, the amount of harmine; X2, the hydration volume. Abbreviation: PDI, polydispersity index.
Table 6 Binomial fitting results Dependent variable
(response, Y)
Regression coefficients
B0 B1 B2 B3 B4 B5 R
Y1 19.89 24.03 −7.91 10.97 −0.79 −1.2 0.916
Y2 −12.99 12.41 −1.70 2.32 −0.14 0.07 0.994
Y3 312.45 −100.19 29.10 −7.13 0.19 0.26 0.989
Y4 1.3504 −0.4407 0.1469 −0.1436 0.0072 −0.0068 0.982
Notes: Y1, response index of theencapsulation efficiency; Y2, response index of the drug-loading amount; Y3, response index of the polydispersity index; Y4, response index
of particle size.
HM amounts were further investigated in the subsequent formulation optimization.
The Lac-TPCS and HM amounts were fixed (Figure 5C). When the hydration volume increased, EE and LD showed the same inverted bell curve by first increasing and then decreasing. The results indicate that the hydration volume had a significant effect on EE and LD. Thus, hydration volume was further investigated in the subsequent formulation optimization.
The micelles were prepared under 20°C, 40°C, and 60°C. EE and LD had no significant difference (P. 0.05), indicating that hydration temperature had no significant effects (Figure 5D). We also investigated whether particle size was affected by temperature. An uneven particle distribution appeared with apparent double-peak phenomena under 20°C (Figure 5E). A larger distribution was visible due to micelle aggregation under 60°C, whereas below 40°C, the particle size had a symmetrical peak with a narrow distribution. Thus, we chose 40°C as the hydration temperature.
CCD
The results were analyzed using quadratic polynomial nonlinear regression, and Z = B0 + B1 * X1 + B2 * X2 + B3 * X12+ B
4 * X22+ B5 * X1 * X2 was obtained as a result.
Among these indicators, X1, X12, X
2, and X22 represent the
single effect on four indexes (EE, LD, particle size, and PDI) by two factors (HM amount and hydration volume), with X1 and X2 referring to the interaction effects. This equation shows the single effect of both factors and their interactions.
The correlation coefficients were all greater than 0.9, indicating a positive correlation (Table 6). Equation coefficients were simplified by ANOVA. However, the simplified correlation coefficients were all reduced, so the simplified formula can be omitted.
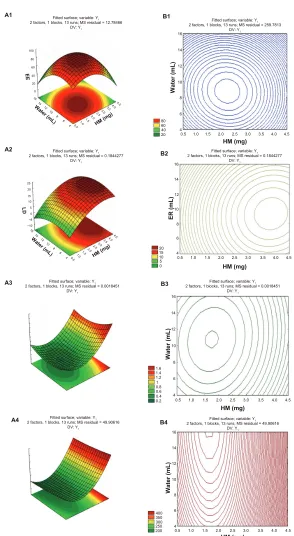
The graphs of three-dimensional response surface and contour plots were depicted to study the effect of various factors according to the binomial equation fitting analysis. Finally, the optimal prescription was selected and validated through superposition of the four contour plots.
The results in Figure 6A1 and B1 show that when amount (X1) was fixed, EE (Y1) first increased, and then decreased as hydration volume (X2) increased. When hydration volume (X2) was fixed, EE (Y1) exhibited the same trend with increasing amount (X1).
The results in Figure 6A2 and B2 show that when amount (X1) is constant, hydration volume (X2) had little effect Dovepress
Bei et al
International Journal of Nanomedicine downloaded from https://www.dovepress.com/ by 118.70.13.36 on 23-Aug-2020
Fitted surface; variable: Y1
2 factors, 1 blocks, 13 runs; MS residual = 12.78466
DV: Y1
Fitted surface; variable: Y1
2 factors, 1 blocks, 13 runs; MS residual = 259.7813
DV: Y1
HM (mg)
HM (mg)
HM (mg)
HM (mg)
HM (mg)
Fitted surface; variable: Y1
2 factors, 1 blocks, 13 runs; MS residual = 0.1844277
DV: Y1
Fitted surface; variable: Y1
2 factors, 1 blocks, 13 runs; MS residual = 0.1844277
DV: Y1
Fitted surface; variable: Y1
2 factors, 1 blocks, 13 runs; MS residual = 0.0018451
DV: Y1
Fitted surface; variable: Y1
2 factors, 1 blocks, 13 runs; MS residual = 0.0018451
DV: Y1
Fitted surface; variable: Y1
2 factors, 1 blocks, 13 runs; MS residual = 49.90616
DV: Y1
Fitted surface; variable: Y1
2 factors, 1 blocks, 13 runs; MS residual = 49.90616
DV: Y1
16 A1 A2 A3 A4 B4 B3 B2 B1 14 12 10 8 80 60 40 20 20 15 10 5 0 1.6 1.4 1.2 1 0.8 0.6 0.4 0.2 400 350 300 250 200 6 4
0.5 1.0 1.5 2.0 2.5 3.0 3.5 4.0 4.5
16 14 12 10 8 6 4
0.5 1.0 1.5 2.0 2.5 3.0 3.5 4.0 4.5
4 6 8 10 12 14 16 0.5 4 6 8 10 12 Water (mL ) Water (mL) Water (mL ) ER (mL) 14 16 0.5
1.0 1.5 2.0 2.5 3.0 3.5 4.0 4.5
1.0 1.5 2.0 2.5 3.0 3.5 4.0 4.5
0 16 14 12 10 8 6
4 0.5 1.01.5
2.02.5 3.03.5
4.04.5
20 40 60 80 100 Water (mL) EE HM (mg) −10 16 14 12 10 8 6
4 0.5 1.01.5
2.02.5 3.03.5
4.04.5
−8 0 5 10 15 20 25 Water (mL) LD
Figure 6 Three-dimensionalresponse surface (A1–A4).
Notes: Contourplot (B1–B4) shows the impact of HM amount (X1), and hydration volume (X2) on EE (Y1), LD (Y2), PDI (Y3), and particle size (Y4), respectively. Abbreviations: EE, encapsulation efficiency; LD, drug-loading amount; PDI, particle size; HM, harmine.
Table 7 Formulation optimization results verified
Variable Response Expected values Observed values Deviation (%)
X1= 1.8 mg Y1 91.15 91.62 −0.5
Y2 14.58 14.20 2.6
X2= 9.6 mL Y3 179.7 183.3 −2.0
Y4 0.202 0.214 −5.9
Dovepress CCD in preparation of novel micelles of harmine
International Journal of Nanomedicine downloaded from https://www.dovepress.com/ by 118.70.13.36 on 23-Aug-2020
4
0.5 1.0 1.5 2.0 2.5
HM (mg)
Fitted surface: variable: Y1
2 factors, 1 blocks, 13 runs; MS residual = 0.0018451 DV: Y1
Water (mL)
3.0 3.5 4.0 4.5
6 8 10 12 14 16
Figure 7 Overlayof four contour plots with a red oval-shaped circle locating the optimum region.
Abbreviation: HM,harmine.
0 1000
1636.62
816.33
2000
Wave number/cm−1
3000 4000
A
B
C
D
Figure 8 FT-IRspectrum. (A) Lac-TPCS. (B) HM. (C) Physical mixture of Lac-TPCS and HM with same proportion of HM-loaded micelles. (D) Lac-TPCS/HM.
Abbreviations: FT-IR,Fourier-transform infrared spectrometer; Lac-TPCS, lactose–palmitoyl–trimethyl–chitosan; HM, harmine; Lac-TPCS/HM, harmine-loaded micelles based on lactose–palmitoyl–trimethyl–chitosan.
on LD (Y2). When hydration volume (X2) was fixed, LD (Y2) increased as amount (X1) increased.
The results in Figure 6A3 and B3 show that when amount (X1) was constant, PDI (Y3) had almost no effect on hydration volume (X2). When hydration volume (X2) was constant,
PDI (Y3) first decreased and then increased with increasing amount (X1).
The results in Figure 6A4 and B4 show that when amount (X1) was constant, the particle size (Y4) had no effect on hydration volume (X2). By contrast, when hydration volume Dovepress
Bei et al
International Journal of Nanomedicine downloaded from https://www.dovepress.com/ by 118.70.13.36 on 23-Aug-2020
(X2) was fixed, the particle size (Y4) first decreased and increased as amount (X1) increased.
Figure 7 shows an overlay of four contour plots, from which we selected an ideal region considering binomial equation and preparation process. The optimal prescription of HM-loaded micelles was X1= 1.8 mg, X2= 9.6 mL. We validated this prescription (Table 7).
The results show that the deviation between measured values and predicted values was very small, indicating that our model had a positive predictive effect and relatively high reliability.
Characterization and physicochemical
properties of Lac-TPCS/HM
33FT-IR characterization
The FT-IR spectrum results are shown in Figure 8. The IR spectra of HM showed two obvious spikes (Figure 8B) at respectively 816.33 cm−1 and 1636.62 cm−1, which were also
visible in that of the physical mixture of Lac-TPCS and HM (Figure 8C). However, these spikes disappeared in the IR spectra of Lac-TPCS/HM (Figure 8D), indicating that HM was entrapped in the micelles.
XRD characterization
The X-ray spectra of HM showed four diffracted spikes at respectively 18.35°, 20.14°, 23.14° and 27.72° (Figure 9A), which were also visible in that of the physical mixture of Lac-TPCS and HM (Figure 9C). However, these spikes disappeared in the IR spectra of Lac-TPCS/HM (Figure 9D), indicating that HM was entrapped in the micelles.
DSC characterization
Figure 10 shows that the DSC spectrum of HM and the physical mixture had a noticeable significant exothermic peak at 310°C due to the decomposition of HM under high temperature. Only a small exothermic peak was observed at around 350°C, which appeared in the spectrum of Lac-TPCS/HM. After entrapping HM, Lac-TPCS exhibited a protective function, resulting in increased decomposed temperature, which proved the micelle formation.
Fluorescence-quenching experiments
The fitting results of Figure 11 show that the Ksv values of HM and Lac-TPCS/HM were 299.72 and 402.08 [M−1],
respectively. HM was affected by I−1 and rapidly quenched,
whereas the quenching of HM-loaded micelles was relatively slower because of the protective effects of Lac-TPCS.
Properties of Lac-TPCS/HM
The average particle size measured by DLS was 193.4 ± 3.1 nm with PDI of 0.167. The micelles had high EE and LD of 91.62% ± 0.76% and 14.20% ± 1.07%, respectively, with a zeta potential of 26.67 mV.
The micelles had spherical and uniform shapes with smooth edges (Figure 12). HM-loaded micelles had a particle
0 100 200 300
Temperature (°C) 400 350°C 310°C
500 600
A
B
C
D
Figure 10 DSC spectrum. (A) HM. (B) Physical mixture of Lac-TPCS and
HM with the same proportion of HM-loaded micelles. (C) Lac-TPCS/HM.
(D) Lac-TPCS.
Abbreviations: DSC, differential scanning calorimetry; Lac-TPCS, lactose– palmitoyl–trimethyl–chitosan; HM, harmine; Lac-TPCS/HM, harmine-loaded micelles based on lactose–palmitoyl–trimethyl–chitosan.
0 10 20
18.35
23.14 27.72 20.14
30 2θ°
40 50
A
B
C
D
Figure 9 XRDspectrum. (A) HM. (B) Lac-TPCS. (C) Physical mixture of Lac-TPCS
and HM with the same proportion of HM-loaded micelles. (D) Lac-TPCS/HM.
Abbreviations: XRD,X-ray diffraction; Lac-TPCS, lactose–palmitoyl–trimethyl– chitosan; HM, harmine; Lac-TPCS/HM, harmine-loaded micelles based on lactose– palmitoyl–trimethyl–chitosan.
Dovepress CCD in preparation of novel micelles of harmine
International Journal of Nanomedicine downloaded from https://www.dovepress.com/ by 118.70.13.36 on 23-Aug-2020
6
Lac-TPCS/HM
KSV = 402.08 [M−1]
KSV = 299.72 [M
−1] HM
4
F0
/F
2
0
0.000 0.002 0.004 0.006
[I−1](M)
0.008 0.010 0.012
Figure 11 Stem–Volmercurves of HM and Lac-TPCS/HM.
Abbreviations: HM,harmine; Lac-TPCS/HM, harmine-loaded micelles based on lactose–palmitoyl–trimethyl–chitosan.
30
20
10
0
1000 200 nm
100
Mean with max-min error bar
Diameter (nm)
Intensity (%
)
10 1
B A
Figure 12 Theproperties of harmine-loaded micelles(A) Size distribution of HM-loaded micelles. (B) TEM of HM-loaded micelles (×40,000).
Abbreviations: HM,harmine; TEM, transmission electron microscopy.
70 60
pH 5.3 pH 6.8 pH 7.4
50 40
T (hours)
Cumulative release (%)
30 20 10 0 100
80
60
40
20
0
70 60
pH 5.3 pH 6.8 pH 7.4
50 40
T (hours)
Cumulative release (%)
30 20 10 0 100
80
60
40
20
0
A B
Figure 13 Invitro release under three pH conditions (5.3, 6.8, and 7.4) (A) HM release curves. (B) Lac-TPCS/HM release curves.
Abbreviations: HM,harmine; Lac-TPCS/HM, harmine-loaded micelles based on lactose–palmitoyl–trimethyl–chitosan.
Dovepress
Bei et al
International Journal of Nanomedicine downloaded from https://www.dovepress.com/ by 118.70.13.36 on 23-Aug-2020
size of about 130 nm, whereas the dimension measured by the particle size analyzer was about 190 nm. This size difference is ascribed to the drying operation in the preparation process, resulting in the collapse or contraction of micelles.34
When dialysis was used to investigate drug release in vitro, drug adsorption in the dialysis bag may become a speed-limiting step of drug release.35 Thus, the in vitro release
behavior of HM was studied as a control group. The release of HM was different under three pH conditions (pH = 5.3, 6.8, and 7.4), and was quicker in acidic medium (Figure 13A). However, HM was completely released within 12 hours under all three pH conditions. Thus, the dialysis bag method can be used for in vitro release study.
The release curves of micelles are shown in Figure 13B. Compared with HM, Lac-TPCS/HM could maintain sustained release of HM until 72 hours and didn’t have any burst-release phenomenon, with cumulative rates of about 65.3%, 79.6%, and 89.3% under pH = 5.3, 6.8, and 7.4, respectively. This phenomenon may be explained by the hydrophobic core becoming a reservoir of HM, which could be closely integrated with HM and delay its release to further reduce any adverse effects of HM.36
Conclusion
A novel self-assembled polymer, Lac-TPCS, was successfully synthesized for administration of insoluble drugs. CCD was used to optimize the preparation technique of Lac-TPCS/HM. The Lac-TPCS/HM prepared with an optimum prescription maximum had a high EE and LD of 91.62% and 14.20%, respectively, when the HM amount was 1.8 mg and hydration volume was 9.6 mL. ANOVA showed a high coefficient of determination value in the range of 0.916 to 0.994, thus ensuring the satisfactory adjustment of the predicted prescription. Lac-TPCS/HM with a sustained release of HM was further characterized by four means, which provided an important basis for the next in vivo experiment. Lac-TPCS is expected to be an efficient carrier for insoluble drugs.
Acknowledgments
This work was supported by the National Natural Science Foundation of China (No 81273463), the Jiangsu Science and Technology Support Plan (BE2011670), the National Student and Innovative Experiment Plan (111028533, Microcomputer No 5731503311), and the Priority Academic Program Development of Jiangsu Higher Education Institutions.
Disclosure
The authors report no conflicts of interest in this work.
References
1. Wang YC, Tang LY, Sun TM, Li CH, Xiong MH, Wang J. Self-assembled micelles of biodegradable triblock copolymers based on poly(ethyl ethylene phosphate) and poly(-caprolactone) as drug carriers. Biomacromolecules. 2008;9(1):388–395.
2. Patil YB, Toti US, Khdaira A, Ma L, Panyam J. Single-step surface functionalization of polymeric nanoparticles for targeted drug delivery. Biomaterials. 2009;30(5):859–866.
3. Wang Y, Yu L, Han L, Sha X, Fang X. Difunctional pluronic copolymer micelles for paclitaxel delivery: synergistic effect of folate-mediated targeting and pluronic-mediated overcoming multidrug resistance in tumor cell lines. Int J Pharm. 2007;337(1–2):63–73.
4. Yoo HS, Oh JE, Lee KH, Park TG. Biodegradable nanoparticles containing doxorubicin-PLGA conjugate for sustained release. Pharm Res. 1999;16(7):1114–1118.
5. Zhang J, Chen XG, Li YY, Liu CS. Self-assembled nanoparticles based on hydrophobically modified chitosan as carriers for doxorubicin. Nanomedicine. 2007;3(4):258–265.
6. Lamchouri F, Settaf A, Cherrah Y, Hassar M, Zemzami M, Atif N. In vitro cell-toxicity of Peganum harmala alkaloids on cancerous cell-lines. Fitoterapia. 2000;71(1):50–54.
7. Giorgio DC, Delmas F, Ollivier E, Elias R, Balansard G, Timon-David P. In vitro activity of the beta-carboline alkaloids harmane, harmine, and harmaline toward parasites of the species Leishmania infantum. Exp Parasitol. 2004;106(3–4):67–74.
8. Chen Q, Chao RH, Chen HS, Hou XR, Yan HF, Zhou SF. Antitumor and neurotoxic effects of novel harmine derivatives and structure activity relationship analysis. Int J Cancer. 2005;114(5): 675–682.
9. Salmaso S, Pappalardo JS, Sawant RR, et al. Targeting glioma cells in vitro with ascorbate-conjugated pharmaceutical nanocarriers. Bioconjug Chem. 2009;20(12):2348–2355.
10. Mu CF, Balakrishnan P, Cui FD, et al. The effects of mixed MPEG-PLA/ Pluronic copolymer micelles on the bioavailability and multidrug resistance of docetaxel. Biomaterials. 2010;31(8):2371–2379. 11. Eby JK, Dane KY, O’Neil CP, Hirosue S, Swartz MA. Polymer micelles
with pyridyl disulfide-coupled antigen travel through lymphatics and show enhanced cellular responses following immunization. Acta Biomater. 2012;8(9):3210–3217.
12. Cho YW, Lee J, Lee SC, et al. Hydrotropic agents for study of in vitro paclitaxel release from polymeric micelles. J Control Release. 2004;97(2):249–257.
13. Dutta M, Jayanta KB. Statistical optimization for the adsorption of acid fuchsin onto the surface of carbon alumina composite pellet: an application of response surface methodology. Int J Environ Sci Tech. 2012;5(1):42–53.
14. Jain Monika, Garg VK, Kadirvelu K. Investigation of Cr(VI) adsorption onto chemically treated Helianthus annuus: Optimization using response surface methodology. Bioresource Technol. 2011;102(2): 600–605.
15. Huang C, Wu H, Li RF, Zong MH. Improving lipid production from bagasse hydrolysate with Trichosporon fermentans by response surface methodology. N Biotechnol. 2012;29(3):372–378.
16. Rosales E, Sanromán MA, Pazos M. Application of central composite face-centered design and response surface methodology for the optimization of electro-Fenton decolorization of Azure B dye. Environ Sci Pollut R. 2012;19(5):1738–1746.
17. Tan HT, Lee KT, Mohamed AR. Pretreatment of lignocellulosic palm biomass using a solvent-ionic liquid [BMIM]Cl for glucose recovery: An optimisation study using response surface methodology. Carbohyd Polym. 2012;83(4):1862–1868.
Dovepress CCD in preparation of novel micelles of harmine
International Journal of Nanomedicine downloaded from https://www.dovepress.com/ by 118.70.13.36 on 23-Aug-2020
International Journal of Nanomedicine
Publish your work in this journal
Submit your manuscript here: http://www.dovepress.com/international-journal-of-nanomedicine-journal
The International Journal of Nanomedicine is an international, peer-reviewed journal focusing on the application of nanotechnology in diagnostics, therapeutics, and drug delivery systems throughout the biomedical field. This journal is indexed on PubMed Central, MedLine, CAS, SciSearch®, Current Contents®/Clinical Medicine,
Journal Citation Reports/Science Edition, EMBase, Scopus and the Elsevier Bibliographic databases. The manuscript management system is completely online and includes a very quick and fair peer-review system, which is all easy to use. Visit http://www.dovepress.com/ testimonials.php to read real quotes from published authors. 18. Qu YY, Li H, Li A, Ma F, Zhou JT. Identification and characterization
of Leucobacter sp. N-4 for Ni (II) biosorption by response surface methodology. J Hazard Mater. 2011;190(1–3):869–875.
19. Alaton IA, Tureli G, Hanci TO. Treatment of azo dye production wastewaters using Photo-Fenton-like advanced oxidation processes: Optimization by response surface methodology. J Photoch Photobio A. 2009;202(2–3):142–153.
20. Hu ZH, Liu Y, Zhang L, et al. Preparation of a novel liver-targeting nanoparticle of norcantharidin derivative and evaluation of its anti-tumor activity. J Exp Nanosc. 2011;6:183–199.
21. Guan M, Zhou Y, Zhu QL, Liu Y, Bei YY, Zhang XN. N-trimethyl chitosan nanoparticle-encapsulated lactosyl-norcantharidin for liver cancer therapy with high targeting efficacy. Nanomedicine. 2012;8(7):1172–1181. 22. Kim JH, Kim YS, Park K, et al. Self-assembled glycol chitosan
nanoparticle for the sustained and prolonged delivery of antiangiogenic small peptide drugs in cancer therapy. Biomaterials. 2008;29(12): 1920–1930.
23. Wang Q, Zhang L, Hu W, et al. Norcantharidin-associated galactosylated chitosan nanoparticles for dual hepatocyte-targeted delivery. Nanomedicine. 2010;6(2):371–381.
24. Lala S, Pramanick S, Mukhopadhyay S, Bandyopadhyay S, Basu MK. Harmine: evaluation of its antileishmanial properties in various vesicular delivery systems. J Drug Target. 2004;12(3):165–175.
25. Kim TI, Baek JU, Zhe Bai C, Park JS. Arginine-conjugated polypro-pylenimine dendrimer as a non-toxic and efficient gene delivery carrier. M Biomaterials. 2007;289(11):2061–2067.
26. Talelli M, Oliveira S, Rijcken CJ, et al. Intrinsically active nanobody-modified polymeric micelles for tumor-targeted combination therapy. Biomaterials. 2013;34(4):1255–1260.
27. You J, Li X, Cui FD, Du YZ, Yuan H, Hu FQ. Folate-conjugated poly-mer micelles for active targeting to cancer cells: preparation, in vitro evaluation of targeting ability and cytotoxicity. Nanotechnology. 2008; 19(4):045102.
28. Han X, Liu J, Xie C, et al. 9-NC-loaded folate-conjugated polymer micelles as tumor targeted drug delivery system: Preparation and evalu-ation in vitro. Int J Pharm. 2009;372(1–2):125–131.
29. Ghasemi E, Raofie F, Najafi NM. Application of response surface methodology and central composite design for the optimisation of supercritical fluid extraction of essential oils from Myrtus communis L. leaves. Food Chem. 2011;126(3):1449–1453.
30. Cho Y, Park SJ, Yoo YS, Sang H . In vivo and in vitro anti-cancer activ-ity of thermo-sensitive and photo-crosslinkable doxorubicin hydrogels composed of chitosan–doxorubicin conjugates. Eur J Pharm Biopharm. 2009;73(1):59–65.
31. Keawchaoon L, Yoksan R. Preparation, characterization and in vitro release study of carvacrol-loaded chitosan nanoparticles. Colloid Surface B. 2011;84(1):163–171.
32. Wang FH, Zhang DR, Duan CX, et al. Preparation and characterizations of a novel deoxycholic acid–O-carboxymethylated chitosan–folic acid conjugates and self-aggregates. Carbohyd Polym. 2011;84(3): 1192–1200.
33. Liang N, Sun SP, Li XF, et al. α-Tocopherol succinate-modified chitosan as a micellar delivery system for paclitaxel: Preparation, characterization and in vitro/in vivo evaluations. Int J Pharm. 2012;423(2):480–488. 34. Zhang LH, He YN, Ma GL, Song CX, Sun HF. Paclitaxel-loaded
polymeric micelles based on poly(ε-caprolactone)-poly(ethylene glycol)-poly(ε-caprolactone) triblock copolymers: in vitro and in vivo evaluation. Nanomedicine. 2012;8(6):925–934.
35. Du YZ, Wang L, Yuan H, Hu FQ. Linoleic acid-grafted chitosan oligosaccharide micelles for intracellular drug delivery and reverse drug resistance of tumor cells. Int J Biol Macromol. 2011;48(1):215–222. 36. Efthimiadou EK, Tapeinos C, Bilalis P, Kordas G. New approach in
synthesis, characterization and release study of pH-sensitive polymeric micelles, based on PLA-Lys-b-PEGm, conjugated with doxorubicin. J Nanopart Res. 2011;13(12):6725–6736.
Dovepress
Dovepress
Bei et al
International Journal of Nanomedicine downloaded from https://www.dovepress.com/ by 118.70.13.36 on 23-Aug-2020