Evolution of Galaxies in Clusters
Dissertation der Fakult¨
at f¨
ur Physik
der
Ludwig-Maximilians-Universit¨
at M¨
unchen
vorgelegt von Gabriella De Lucia
aus Avellino, Italien
M¨
unchen, den 30. Januar 2004
1. Gutachter:
Prof. Dr. Simon D. M. White
2. Gutachter:
Priv.-Doz. Dr. Roberto Saglia
Contents
Zusammenfassung (Summary in German) 5
Summary 9
1 Thesis objectives and framework 11
1.1 Motivation . . . 11
1.2 Historical context and thesis objectives . . . 13
1.3 Formation and evolution of the structure in the Universe . . . 17
1.3.1 The homogeneous Universe . . . 17
1.3.2 Dark matter . . . 20
1.3.3 The linear growth of perturbation . . . 21
1.3.4 Object formation . . . 23
1.4 N–body simulations . . . 24
1.5 The physics of galaxy formation . . . 28
1.6 Observational results . . . 30
1.6.1 Cluster components . . . 30
1.6.2 Cluster surveys . . . 34
1.6.3 Galaxy evolution in clusters . . . 35
2 Substructures in Cold Dark Matter Haloes 39 2.1 Introduction . . . 39
2.2 N–body simulations . . . 42
2.3 Identification of dark matter substructures . . . 43
2.4 The subhalo mass function . . . 46
2.5 The most massive substructures . . . 54
2.6 The radial distribution of subhalos . . . 55
2.7 Subhalo histories . . . 59
2.7.1 Constructing merging trees . . . 60
2.7.2 Mass accretion history . . . 61
2.7.3 Merging histories . . . 66
2.8 Summary and discussion . . . 68
3.1 Introduction . . . 71
3.2 The simulation . . . 74
3.3 Tracking Galaxies in N–body Simulations . . . 75
3.4 The physical processes governing galaxy evolution . . . 76
3.4.1 Gas cooling . . . 77
3.4.2 Star formation . . . 78
3.4.3 Feedback . . . 79
3.4.4 Galaxy mergers . . . 81
3.4.5 Spectro–photometric evolution . . . 82
3.5 Dust extinction . . . 83
3.5.1 Metal routes . . . 84
3.6 Model normalisation and influence of the parameters . . . 87
3.7 Comparison with local observations . . . 89
3.8 Cluster Mass–to–Light ratio . . . 97
3.9 Morphological and colour distribution . . . 98
3.10 Discussion and Conclusions . . . 101
4 The chemical enrichment of the intra–cluster and intergalactic medium 105 4.1 Introduction . . . 105
4.2 The simulations . . . 108
4.3 The galaxy stellar population . . . 108
4.4 Chemical enrichment of the ICM . . . 112
4.5 Observational tests for different feedback schemes . . . 117
4.5.1 The hot gas fraction . . . 118
4.5.2 The chemical budget . . . 120
4.6 Discussion and Conclusions . . . 123
5 EDisCS cluster structure 127 5.1 Introduction . . . 127
5.2 Selection of cluster candidates . . . 130
5.3 Data . . . 131
5.4 A subset of the complete sample . . . 131
5.5 Cluster membership . . . 134
5.5.1 Photometric redshift estimates . . . 136
5.5.2 Isolating cluster members . . . 137
5.6 Dynamical analysis . . . 141
5.6.1 Cluster velocity dispersion . . . 141
5.6.2 3D–substructures . . . 142
5.7 Cluster structure . . . 147
5.7.1 The radial profiles . . . 147
Contents
5.8 The cluster simulations set . . . 157
5.9 Simulating the observation of a simulated cluster . . . 158
5.10 Models & Observations . . . 161
5.11 Discussion and Conclusions . . . 164
6 The build–up of the CM sequence at redshift ∼ 0.8 167 6.1 Introduction . . . 167
6.2 The data . . . 170
6.3 Cluster membership . . . 171
6.4 The colour–magnitude relation . . . 173
6.5 The truncation of the red sequence . . . 177
6.6 Discussion and Conclusions . . . 182
7 Concluding remarks 187 7.1 Results . . . 187
7.2 Future prospects . . . 190
Zusammenfassung
In dieser Doktorarbeit studiere ich die Entstehung und Entwicklung von Galaxi-en in GalaxiGalaxi-enhaufGalaxi-en sowohl theoretisch als auch unter Einbeziehung von Beobach-tungsdaten. Galaxienhaufen stellen die gr¨oßten gravitativ gebundenen Strukturen im Universum dar. Durch ihr Studium erh¨alt man eine F¨ulle von Informationen, zum einen, indem man die Dynamik individueller Objekte erforscht und zum anderen aus ihrer Eigenschaft als Indikatoren der großr¨aumigen Struktur im Universum. Diese Doktorarbeit gliedert sich in zwei Teile: Einem theoretischen Teil schließt sich eine Datenanalyse an.
Im ersten Kapitel beschreibe ich warum Galaxienhaufen wichtig sind, erkl¨are die Motivation und Zielsetzung der in dieser Arbeit verwendeten Analyse und erl¨aute-re den daf¨ur n¨otigen theoretischen Hintergrund als auch den Hintergrund f¨ur die Beobachtungen.
in Galaxienhaufen befinden, zu Rotverschiebungen∼>1 immer noch aktive Sternent-wicklung zeigten. Diese Analyse ist Bestandteil des zweiten Kapitels.
Um eine enge Verbindung zwischen den theoretische Vorhersagen und den Beobach-tungen zu ziehen, entwickle ich ein semi-analytisches Programm, welches selbstkon-sistent die photometrische und chemische Entwicklung der Galaxien in den Haufen, als auch die chemische Geschichte des Gases innerhalb der Haufen und innerhalb der Galaxien verfolgt. Dabei modelliere ich den Transport von Masse und Metallen zwischen den Sternen, das kalte Gas in Galaxien, das heiße Gas in dunklen Mate-riehalos, und das intergalaktische Gas außerhalb der virialisierten Halos. Außerdem modelliere ich die Effekte von Staub auf die emittierte Strahlung von Galaxien. Ich experimentiere mit drei verschiedenen R¨uckkopplungsmodellen und zeige, daß es in allen Szenarien m¨oglich ist, die Modellparameter so einzustellen, daß die resultieren-den Eigenschaften und Verteilungen in guter ¨Ubereinstimmung mit Beobachtungen der Galaxien in den Haufen im lokalen Universum sind. Das dritte Kapitel beschreibt das semi-analytische Modell im Detail und zeigt einen Vergleich mit einer Anzahl von Beobachtungsergebnissen f¨ur Galaxien aus nahen Haufen.
Im folgenden verwende ich dieses Modell, um die Anreicherung des intergalakti-schen Mediums und des Gases innerhalb der Galaxienhaufen mit den chemiintergalakti-schen Elementen als Funktion der Zeit zu studieren. Dabei untersuche ich, zu welchem Zeitpunkt der Großteil der Anreicherung stattfand und welche Galaxien den gr¨oßten Beitrag lieferten. Als Ergebnis finde ich, daß in allen drei R¨uckkopplungsmodellen die Anreicherung bei großen Rotverschiebungen stattfand (60-80 Prozent der Metal-le wurden bei Rotverschiebung gr¨oßer als eins ausgestoßen) und daß massive Galaxien einen wichtigen Beitrag zum Metallhaushalt der Galaxienhaufen liefern. Im weiteren Verlauf analysiere ich die beobachtbaren Merkmale der verschiedenen Modelle der R¨uckkopplungsmechanismen. Dabei zeige ich, daß die beobachtete Abnahme des ba-ryonischen Massenanteils von Galaxienhaufen zu Gruppen nur in einem ”extremen” Modell reproduziert werden kann, in welchem das wiederausgestoßene Material auf einer Zeitskala wiederaufgenommen wird, die vergleichbar mit der Hubblezeit ist. Die Resultate dieser Untersuchungen werden in Kapitel 4 pr¨asentiert.
Zusammenfassung
werden dann detailiert mit Resultaten der numerischen Simulation verglichen. Alle beobachteten Haufen besitzen eine komplexe dynamische Struktur und die Menge an Substruktur ist mit derjenigen aus den numerischen Simulationen vergleichbar. Im Kapitel 5 diskutiere ich, wie die Erweiterung der Methode auf den gesamten EDisCS Datensatz wichtige Einschr¨ankungen auf die relative Bedeutung der verschiedenen physikalischen Prozesse liefern wird, die Galaxienentwicklung in dichten Umgebun-gen beeinflussen.
Zum Schluß analysiere ich die Farb-Helligkeits-Beziehung einer Untermenge der EDisCS Galaxienhaufen bei großen Rotverschiebungen. Dabei vergleiche ich die er-haltenen Resultate der hochrotverschobenen Galaxienhaufen mit denjenigen des na-hen Coma Galaxienhaufens und zeige, daß die hochrotverschobenen Galaxienhaufen ein Defizit an leuchtschwachen Galaxien der roten Sequenz im Vergleich zu denjenigen bei kleiner Rotverschiebung aufweisen. Dies deutet an, daß ein großer Bruchteil der leuchtschwachen passiven Galaxien in Galaxienhaufen zum gegenw¨artigen Zeitpunkt bei großen Rotverschiebungen aktive Sternentstehung aufgewiesen haben k¨onnten. Diese Aussage stimmt qualitativ mit den Vorhersagen des hierarchischen Modells ¨
Summary
In this thesis I study the formation and the evolution of galaxies in clusters, both from a theoretical and an observational point of view. Clusters of galaxies represent the largest gravitationally bound structures in the Universe and a wealth of information may be obtained from their study both as individual dynamical units and as tracers of the large scale structure of the Universe. The thesis is divided into two parts: a theoretical part and a data analysis part.
In Chapter 1, I describe the importance of clusters of galaxies, explain the mo-tivation and the objectives of the analysis presented in this thesis, and review the necessary theoretical and observational background.
First, I explore the predictions of hierarchical cold dark matter models for the observed properties of the cluster galaxy population and their evolution as a func-tion of redshift. I use a large set of high-resolufunc-tion numerical simulafunc-tions of clusters together with a high resolution simulation of a ‘typical’ region of the Universe. The high resolution of the simulations used in this thesis permits me to track the evolu-tion of the cores of dark matter haloes that fall into larger structures. This allows me to make a one-to-one identification between luminous cluster galaxies and dark matter substructures. I study the spatial and mass distribution of dark matter sub-structures and their accretion and merger histories as a function of halo mass and as a function of environment. I show that the mass distribution of substructures is almost independent of the mass of the parent halo. Galaxy–sized haloes are thus simply ‘scaled’ versions of cluster–sized haloes. Substructures accreted onto larger systems undergo significant stripping on short time–scales and their merger rates are suppressed because of the large velocity dispersion of the parent system. I show that a significant fraction of substructures are accreted at relatively low redshift, implying that a significant fraction of galaxies in clusters today were still actively forming stars at redshifts&1. This analysis represents the subject of Chapter 2.
and show that, in all cases, it is possible to tune the model parameters in order to ob-tain a good agreement with observations of cluster galaxies in the nearby Universe. Chapter 3 describes the semi–analytic model in detail, and presents a comparison with a number of observational results for galaxies in nearby clusters.
I then use the model to study the chemical enrichment history of the intra–cluster and intergalactic medium. I investigate when the bulk of the enrichment occurred and which galaxies were responsible for it. I find that, for all three feedback models, the chemical enrichment occurs at high redshift (60–80 per cent of the metals are ejected at redshifts larger than 1) and that massive galaxies provide an important contribution to the metal budget of the clusters. I then analyse the observational signatures of the different feedback prescriptions and show that the observed decline in the baryon fraction from clusters to groups can only be reproduced in an ‘extreme’ model where ejected material is re–incorporated on a time–scale comparable to the Hubble time. I present the results of these investigations in Chapter 4.
The second part of my thesis deals with the interpretation of data from the ESO Distant Cluster Survey (EDisCS). This is an ESO Large Programme aimed at the study of the evolution of cluster population over more that 50 per cent of cosmic time. It combines photometric and spectroscopic information for a large sample of clusters at redshifts∼0.5 and 0.8. I perform a detailed dynamical and structural analysis of a subset of the EDisCS cluster sample for which we have complete photometric and spectroscopic data available. My investigation is focused on the analysis of cluster structure. In particular, I develop a new method of measuring substructure that takes into account both the projected spatial distribution of galaxies and the velocity information. I then carry–out a detailed comparison with results from numerical simulations. All the observed clusters have a complex dynamical structure and the amount of substructure is comparable to the one I find in the numerical simulations. In Chapter 5 I discuss how the extension of the method to the whole EDisCS dataset will provide important constraints on the relative importance of different physical processes that drive galaxy evolution in dense systems.
–Quello che lei non sa `e il vero scopo del nostro lavoro [. . . ]. `E perch`e tutto non sia stato inutile, per trasmettere tutto quello che sappiamo ad altri che non sappiamo chi sono n`e cosa sanno.
Italo Calvino, La memoria del mondo
1
Thesis objectives and framework
Abstract
I explain the motivation and the objectives of the analysis presented in this thesis and I review the needed theoretical and observational background. The importance of clusters of galaxies, which represent the main subject of this the-sis, is emphasised, both as tracers of the large scale structure of the Universe and as an ideal laboratory for the study of galaxy evolution. In the first part of the chapter, I review the basics of the current favoured cosmological model, developing the basic formalism of the linear theory of perturbations and illus-trating the results of the spherical collapse model. I review recent progress in numerical simulations and introduce the concept of semi–analytic models. In the second part of the chapter, I will present basic observational results on clus-ters of galaxies and evolution of galaxies in clusclus-ters. Given the broad range of this thesis, this chapter only provides a limited account of the field.
1.1 Motivation
With their rich variety of shapes and their fascinating spiral patterns, galaxies rep-resent the most stunning phenomenon of the night sky. We know that these striking features of the Universe represent complex systems made up of different components – dust, gas, stars – held together by their mutual gravitational attraction and cover-ing a wide range in mass, from 1012 M¯1 for the giant ellipticals to 106–108 M¯ for dwarf galaxies and with typical sizes of the order of 1 kpc2 for dwarfs and 10 kpc for
1
1 M¯= 1.989·1033g. 2
giants.
The distribution of galaxies in the sky does not appear to be uniform: galaxies tend to gather in associations that are characterised by a variety of forms and may contain a handful of galaxies or thousands. These associations are calledgroups and clusters of galaxies.
Clusters represent the largest gravitationally bound structures in the Universe and their study may yield a wealth of information both as individual dynamical units and as tracers of the large scale structure of the Universe. On large scales, clusters provide a powerful cosmological diagnostic through the study of their statistical properties as a function of redshift. The number density of clusters of a given mass at varying redshifts (N(M, z)) is strongly dependent on the cosmological parameter ΩM, the matter density of the Universe, and onσ8, the amplitude of density perturbations on 8–Mpc scales (see Sec. 1.3.1).
As individual units, clusters of galaxies constitute an ideal laboratory for the study of galaxy formation and evolution and of the environmental influence on galaxy evo-lutionary processes. This is due mainly to three reasons:
• evolutionary processes are faster in high–density regions;
• some particular classes of objects are only found within large virialized systems. For example, cD galaxies (large luminous ellipticals whose stellar envelope can extent out to 1 Mpc) are only found in the cores or rich regular clusters. El-lipticals and lenticulars represent a conspicuous fraction of the cluster galaxy population;
• since clusters contain high density of galaxies, they are relatively luminous at many wavelengths and are therefore ‘easy’ to recognise and observe up to high redshift. They thus allow us to extend our studies of galaxy evolution over a long base line in cosmic time.
However, clusters of galaxies do have an important drawback: they are ‘rare’ ob-jects that lie on the tail of the mass distribution (see Sec. 1.3.4); for a standard ΛCDM cosmology (see Sec. 1.3.1) the space density of haloes with mass larger than 1014M¯ is only 7×10⁻⁵(h−1Mpc)−3. This means that, even if clusters of galaxies contain on average ∼100 L∗3 galaxies, only about 10 per cent of the cosmic galaxy population resides in these massive systems at the present day, and even a lower fraction at high redshift. As explained above, however, the possibility to identify such systems over a wide range in redshift provides a unique opportunity to study the evolution of particular classes of objects and to investigate the influence of environment on the properties of galaxy population and their evolution.
3
The parameter L∗ represents a characteristic luminosity of cluster galaxies corresponding to a
1.2 Historical context and thesis objectives
In addition, clusters of galaxies represent very complex systems, involving a vari-ety of interacting components – galaxies, X–ray emitting gas, and dark matter (see Sec. 1.6.1). They thus offer a unique opportunity to link many aspects of astrophysics and cosmology and, in particular, to clarify the interplay between dark and baryonic component.
In recent years, our knowledge of galaxy clusters has greatly improved thanks to multi–wavelength studies that allow complementary information to be obtained about these complex systems: optical imaging and spectroscopy provide information on the luminosities, the spatial distribution and kinematical properties of cluster galaxies. X–ray observations of clusters at different redshifts provide an unique tool to study the cosmological history of baryons. Recently, it has also been suggested that the presence of radio haloes and relics in clusters is indicative of a cluster merger. Merger shocks, with velocities larger than 103km s−1, convert a fraction of the shock energy into acceleration of pre-existing relativistic particles and provide the large amount of energy necessary for magnetic field amplification (Feretti 2002). Radio observations can then provide important information on eventual mergers allowing for example to give a further probe of the relative velocity of the structures and of the gas flows.
1.2 Historical context and thesis objectives
The startling beauty of the night sky has always intrigued people, leading to the birth of myths and legends that have sometimes had a strong influence on cultures, religions and also on everyday life. The very name given to our own Galaxy represents a memory of one of these legends: the ancient Greeks described this swathe of light, visible on a dark night from horizon to horizon, with a river of milk flowing from the breast of Hera, wife of Zeus – the word ‘galaxy’ comes from the Greek word for milk. We also know that ancient Greeks developed a surprisingly advanced understanding of astronomy: still today we use the magnitude system to quantify the brightness of an astrophysical object.
In spite of the early interest in this fascinating world, astronomy as a scientific discipline still had to wait some time to be born. It was only in the XVII century that Galileo discovered that this stream of light was not made up of some sort of ‘celestial fluid’ but was instead composed of myriads of unresolved stars. More and more ‘patches of light’ started to be observed – nebulae or Island Universes, using the definition given by Immanuel Kant. A famous ‘comet hunter’ – Charles Messier4– and a musician – Wilhelm Herschel – independently produced the first catalogues of nebulae.
4
Despite aGreat Debate held in 1920 to establish the nature of these objects, it was only Hubble in 1923 to provide the definitive demonstration of their extra–galactic nature, measuring the periods of the Cepheids5 in M31.
In this respect, the history of clusters of galaxies is as old as the history of nebulae: Hershel had already noted a “remarkable collection of many hundreds of nebulae which are to be seen in what I have called the nebulous stratum of Coma Berenices” (Herschel 1785). However, only in the late 30s (Smith 1936; Zwicky 1937) were these objects recognised as very large conglomerations of galaxies at great distances. The first dynamical analysis of clusters also showed that there must exist much more gravitational material than indicated by the stellar content of the galaxies in clusters. This was the first discovery of the preponderance ofdark matter in the Universe (see Sec. 1.3.2).
In the early 60s, cluster research developed along the lines of measuring the num-bers, sizes, luminosities, spatial and velocity distribution of cluster galaxies. The development of the first large catalogue of clusters (Abell 1958), based on a visual estimate of the number density of galaxies, represented one of the major milestones in the field. Extensive optical and spectroscopic follow–up studies were more time– consuming and it was not until more than one decade later (Rood 1974) that the first cluster mass estimates were obtained from measurements of the velocity distribution of cluster galaxies using the virial theorem. Then it became clear that clusters of galaxies were dominated by dark matter, with galaxies representing less than 5 per cent of the total mass. The astronomical community was finally oriented towards a paradigm in favour of dark matter; the time was ripe for the first pioneering works that started out the modern picture of hierarchical galaxy formation (Rees & Ostriker 1977; White & Rees 1978).
In the following decades, progress in the field has been so rapid that a complete overview would easily fill several hundreds pages. The development of new technolo-gies and instrumentation and, at the same time, rapid progress on the theoretical side, have allowed astronomers to gather an incredible amount and variety of infor-mation. It is interesting and important to note that observational and theoretical progress have always proceeded side by side: often theoretical efforts have received formidable acceleration from observational results, as in the case of the discovery of the Butcher–Oemler effect, i.e. the observation that distant clusters tend to have ‘bluer’ galaxies than low–redshift clusters. This study, in fact, represented the first strong evidence that the properties of galaxies and/or clusters have evolved rapidly with time, thus addressing the difficult question of which physical mechanisms are re-sponsible for this evolution – a question that remains largely unanswered. Very often
5
1.2 Historical context and thesis objectives
observers have tuned their studies in order to distinguish between different possible physical mechanisms proposed by theorists. This is very much still the case and the present decade represents a very exciting moment for this field. In the last two decades, satellite missions like IRAS, COBE, WMAP have revolutionised the field, giving tighter and tighter constraints on the cosmological parameters; the Hubble Space Telescope has allowed to have a deep look at the high redshift Universe and a new class of 8–10 meter telescopes are producing a wealth of observational data. At the same time, rapid advances in computer technology and in the theoretical un-derstanding of the physical mechanisms driving galaxy evolution, have allowed the development of more complex and complete models. It is likely that making a close link between the observations and theory will allow us to obtain strong constraints on the physical mechanisms driving galaxy formation and evolution.
This thesis represents an attempt in this direction. I will use the state–of–art nu-merical simulations of the formation of structure (see Sec. 1.4) in order to explore the predictions of the current favoured model for the observed properties of the cluster galaxy population and their evolution as a function of redshift. As I will explain later, numerical simulations of gravitational clustering of dark matter represent an indispensable tool for investigating the non-linear growth of structures in its full ge-ometrical complexity (see Sec. 1.3.3). In addition, there is conspicuous observational evidence for a significant fraction of dark matter even in the very inner regions of galaxies (see Sec. 1.3.2 and Chapter 2). If observed galaxies have large fractions of dark matter, thenN–body simulations can be used to predict the distribution of their dark matter components, to associate the dark matter substructures with galaxies and to predict properties such as their spatial and mass distributions that can be directly compared to observational results. Such comparison can provide important hints for the physics that needs to be included in viable models of galaxy formation and evolution. This analysis, that represents the subject of Chapter 2, has been accepted for publication in MNRAS (De Lucia et al. 2003a).
formation and metal production histories (Renzini 1997). Numerical simulations, in fact, predict that the baryon fraction in clusters does not change appreciably during their evolution. This implies that direct observations of elemental abundances in the intra–cluster medium can provide important information on the past star formation in clusters and eventually on the mechanisms that were responsible for the transport of metals from galaxies into the intra–cluster medium. This analysis, that repre-sents the subject of Chapters 3 and 4, has been accepted for publication in MNRAS (De Lucia et al. 2003b).
In the second part of my thesis, the analysis will be related to the interpretation of data from the ESO Distant Cluster Survey (EDisCS). This is an ESO Large Pro-gramme aimed at the study of the evolution of cluster population over more that 50 per cent of cosmic time by combining photometric and spectroscopic information on a large sample of clusters at redshift∼0.5 and 0.8. The homogeneity of quality data and the large sample of clusters permit to analyse the properties of the galaxy pop-ulation, as well as their cluster–to–cluster variations. I will use the model developed as a part of this thesis to generate mock catalogues from the simulations for direct comparison with the data. My analysis will be related, in particular, to the quan-tification of the amount of substructure in observed and simulated clusters. I will develop a new method to quantify the importance of substructures, that combines the spatial distribution of galaxies on the plane of the sky with the radial velocity information. I will show that the detail of the simulation permits to carry–out on the simulated data the same analysis conducted on the observed clusters. Extending the analysis to the complete EDisCS sample, it will be possible to gain some insight into how different physical processes affect galaxies in clusters. This analysis represents the subject of Chapter 5.
My analysis on EDisCS clusters will also be related to the study of the colour– magnitude relation of a subset of our high redshift clusters. I will show, by means of an accurate comparison with passive galaxy population in nearby clusters, that the high redshift clusters exhibit a clear deficit of low–luminosity red sequence galaxies. These results have important consequences on models for the formation and evolution of early–type galaxies in clusters. This analysis represents the subject of Chapter 6
1.3 Formation and evolution of the structure in the Universe
1.3 Formation and evolution of the structure in the Universe
The basic picture of modern cosmology (Weinberg 1972; Peebles 1993; Padmanabhan 1993; Peacock 1999) is that of a Universe that began from a hot and homogeneous state. Density fluctuations in the early Universe were exponentially amplified during a phase of inflation (Guth 1981), a theory that eliminates many of the problems of the so–called standard model. How the inflation started and eventually stopped and, most importantly, which of the many proposed theories are viable, is still a matter of debate. The expansion of the perturbations eventually stopped because of self–gravity, and the perturbations turned around collapsing into bound struc-tures. In the current favoured model, smaller structures collapse first and are later incorporated in larger collapsing structures in abottom–up scenario that provides a natural explanation for the formation of galaxies, clusters, filaments and superclus-ters. Modern cosmology is founded on Einstein’s theory of General Relativity and merely represents a very simple application of this theory.
1.3.1 The homogeneous Universe
The study of structure formation and evolution requires a spacetime framework that allows a physical connection between phenomena occurring at different cosmic epochs. For the very special case of a homogeneous and isotropic Universe the metric turns out to be quite simple and is given by the Robertson–Walker metric (Peacock 1999):
dl2 =c2dt2−a2(t) µ
dr2
1−kr2 +r
2(dθ2+ sin2θ dφ2) 
where r, θ and φ represent the spherical coordinates and k is the curvature of the Universe whose value can be <0 (for an open Universe), 0 (for a flat Universe) and
>0 (for a close Universe). a(t) represents the scale–factor of the Universe (which is a measure of its size) and its form depends on the material the Universe is made of. Using the Robertson–Walker metric, Einstein’s field equations simplify into the Friedmann equations:
¨
a a =−
4πG
3 µ
ρ+3p
c2 
+Λc 2 3 (1.1) and µ ˙ a a ¶2
= 8πG
3 −
kc2 a2 +
Λc2
3 (1.2)
whereρrepresents the matter density,pthe pressure and Λ the cosmological constant, corresponding to an energy density of the vacuum:
ρvc2 =
The Hubble parameter, that represents the expansion rate of the Universe, is related to the scale–factor by the equation:
H(a) = a˙
a
In order to solve the above equations, one needs to specify the time dependence of
ρ and p, i.e. to specify an equation of state, that obviously depends on the form of energy/matter. In the early Universe the energy density is dominated by relativistic particles and radiation; the equation of state is p = ρ/3 and the density scales as a−4. As the Universe expands, the energy density of radiation decays and the Universe enters a matter–dominated phase. Non relativistic matter is assumed to be pressureless and its energy density scales asa−3.
It is useful to define the following density parameters:
ΩM= ρ ρc
, ΩΛ= Λc2
3H02, Ωc =− kc2
a20H02 (1.3)
where ρc = 3H02/8πG represents the matter content of the Universe. Note that these definitions refer to the values of the corresponding quantities at the present time. With these definitions Eq. 1.1 becomes q0 = 12ΩM−ΩΛ and Eq. 1.2 becomes ΩM+ Ωc + ΩΛ = 1, at the present time. In the previous equation, q0 is defined as q0 = −(¨aa/a˙2)t0 and represents the rate at which expansion of the Universe is accelerating.
Different methods have been used and are currently used to measure the cosmo-logical parameters. In Sec. 1.1, we have explained that clusters of galaxies provide a powerful diagnostic for the measurement of ΩM (the matter density of the Universe) and σ8, that parametrises the normalisation of the power spectrum (see Sec. 1.3.3). Supernovae of type Ia (SNIa) are considered as excellentstandard candlesbecause of the constancy of their luminosity at maximum brightness. Since SNIa are relatively luminous objects, they can be observed out to high redshift, thus providing a powerful tool for the determination of the geometry and matter content of the Universe.
The perhaps most elegant method for the measurement of the cosmological pa-rameters is based on measurements of temperature fluctuations in the microwave background radiation. Decomposing the temperature fluctuations in spherical har-monics, it is possible to recover the underlying fluctuation spectrum (see Sec. 1.3.3). The most recent and incredibly tight results have been obtained from the WMAP team (Spergel et al. 2003). Fig. 1.16 shows the constraints from BOOMERANGdata from de Bernardis et al. (2002) overlaid with the contours from the Supernova Cos-mology Project (Perlmutter et al. 1999) and 2dF data (Verde & Heavens 2001). In
6
1.3 Formation and evolution of the structure in the Universe
Figure 1.1: Cosmological parameters measurements before (left panel) and after
(right panel) WMAP.
the right panel the orange likelihood surface shows the new results fromWMAP. Ob-servational data seem to converge towards aconcordance cosmological model with a low–density (ΩM = 0.3) and vacuum dominated (ΩΛ = 0.7) Universe. WMAP data also provide an accurate estimate of the Hubble constant at the present time (H0), that is found to have a value of 72±5 km s−1Mpc−1. Although the present estimate of the Hubble constant is extremely accurate, it is still common to introduce a dimen-sionless parameter (h), that was originally introduced to parametrise the uncertainty on the value of the Hubble constant: H0= 100hkm s−1Mpc−1.
The redshift z of an object is the fractional Doppler shift of its emitted light resulting from radial motion:
z= νe
νo −
1 = λo
λe −
1
where the subscripts ‘e’ and ‘o’ are used for ‘emitted’ and ‘observed’. In terms of cosmography, the cosmological redshift is directly related to the scale factora(t). If one neglects peculiar motions:
1 +z= a(t0)
a(te)
For small distance done obtains:
z≈ v c =
d DH
to both the distance of the objects and the epoch of emission of the light, and thus often represents a convenient time variable.
Introducing the definitions given in Eqs. 1.3 in the second Friedmann equation (Eq. 1.2), one obtains:
H(z) = a˙
a =H0E(z)
where
E(z) =pΩM(1 +z)3+ (1−ΩM−ΩΛ)(1 +z)2+ ΩΛ
This last equation is very useful to obtain the definition of distances that are com-monly used in cosmology (Hogg 1999). In fact, sincedz =da,dz/E(z) is proportional to the time-of-flight of a photon travelling across the redshift intervaldz divided by the scale factor at that time. Since the speed of light is constant, this is a proper distance divided by the scale factor, which is the definition of a comoving distance. The total line-of-sight comoving distance is obtained integrating these contributions (Hogg 1999):
DC=DH Z z
0 dz0 E(z0)
1.3.2 Dark matter
There is now conspicuous observational evidence that the majority of the mass in the Universe consists of a unspecifieddark matter component (see also Sec. 2.1).
The observational evidence of amissing mass problem actually dates back to the 30’s, when Zwicky estimated that the speeds of galaxies in rich clusters are too large to keep the system gravitationally bound, unless the dynamical mass is at least 100 times larger than the mass contained in galaxies. The reality of the missing mass problem, however, gained a hold upon the astronomical community only in the early 70’s, through the work of Freeman (1970) and others who demonstrated that the rotation curve of spiral galaxies is either flat or rising at the optical edge of the galaxies, contrary to the expectation of a Keplerian fall off in rotational velocity as a function of radial distance.
Baryons as candidate for dark matter are ruled out by the theory of primordial nucleosynthesis (Cavaliere et al. 1998). Non-baryonic candidates are classified as hot and cold dark matter (also an intermediate state, called warm dark matter has been proposed), depending on their kinematical state in the early universe at the time of decoupling of light and matter. Hot dark matter candidates would have been relativistic, cold dark matter ones non-relativistic. This categorisation has important ramifications for structure formation, and there is a chance of determining whether the dark matter is hot or cold from studies of galaxy formation.
1.3 Formation and evolution of the structure in the Universe
1984) because of the strong damping on small scales due to free streaming7. Warm dark matter seems to be still a viable possibility. At present, the best agreement with observational studies is given by cold dark matter, in the form of Weakly Interacting Massive Particles (WIMPS), which naturally arise in supersymmetric extensions of the standard model.
Dark matter is assumed to behave as a collisionless fluid for most of the history of the Universe. Since the number of particles is believed to be large, two–body interactions can be neglected and the system can be described by a distribution function in the phase–space whose evolution is given by the collisionless Boltzmann equation (also called Vlasov equation):
df dt =
∂f ∂t +v
df dr−
dΦ
dr df
dv = 0 (1.4)
where the potential is given by the Poisson equation:
∆2Φ(r, t) = 4πGρ(r, t)
1.3.3 The linear growth of perturbation
We have already pointed out that the observed Universe is far from being homoge-neous, with a variety of structures ranging from dwarf galaxies to groups and clusters of galaxies, to huge superclusters. Nevertheless, the assumption of homogeneity still holds when the Universe is smoothed on large scales (somewhat larger than 100 Mpc). The currently favoured theories of structure formation assume that structure grows out of primordial quantum fluctuations that get amplified during a phase of rapid (∆t≈10−33 s) expansion that is called inflation (Guth 1981).
The statistical properties of the density field δ(x, t), at a given time, are usually characterised through the Fourier transform of its two–point correlation function8, that is calledpower spectrum:
P(k, t) =
|δ(k, t)|2® with
δ(k, t) = 1 (2π)2
Z
dxδ(x, t)e−ikx
and
δ(x, t) = ρ(x, t)−ρ¯ ¯
ρ
7
At the time of decoupling of light and matter, hot dark matter particles are still relativistic and therefore ‘stream’ from high density to low density regions, resulting in a damping of the fluctuations. The exact scale this occurs on depends on the mass and velocity of the particles involved.
8
where ¯ρ is the background density.
The latest results from WMAP are consistent with a random Gaussian scale free Harrison-Zeldovich initial fluctuation spectrum, i.e. Pinitial(k)∝knwith n= 1.
Physical processes that depend critically on the particle content of the Universe, have modified the initial power spectrum producing a non–power law spectrum by the present day. The cumulative effect of these processes is represented through the so–calledtransfer function, that can be computed using publicly available codes (Seljak & Zaldarriaga 1996) or analytic approximations (Bardeen et al. 1986). If the Universe is dominated by cold dark matter, as is suggested by observational results (see Sec. 1.3.2), perturbations in the dark matter component begin to grow right after the epoch ofdecoupling, that marks the transition from a radiation dominated Uni-verse to a matter dominated UniUni-verse (see Sec. 1.3.1). Amplification of these seeds will then produce density fluctuations which can accrete baryonic material after re-combination, i.e. the epoch when the Universe became cool enough for the protons to capture electrons. As material continues to flow into the density fluctuation, it continues to grow in size thus sweeping up more material in the vicinity. Eventually galaxy–size objects are made via this gravitational coalescence of subunits and then clusters of galaxies are made later in the Universe via the continuation of this grav-itational clustering hierarchy. In this model then, large systems like galaxy clusters are formed via hierarchical merging of smaller structures in a ‘bottom-up’ fashion.
After the recombination epoch, density fluctuations grow simply by self–gravitation and, as long as these inhomogeneities are small, their evolution can be followed using the linear perturbation theory. If the mean free path of the particles is small, matter can be treated as an ideal fluid. Using the equation of motion (Euler’s equation), the continuity equation (that describes the conservation of mass) and the Poisson equation, it is possible to show with some algebraic manipulation that, in the linear regime, the growth of the perturbations is described by the following equation:
¨
δ+ 2a˙
aδ˙= 4πGρδ¯ (1.5)
The equation has, in general, two solutions: a decaying mode and a growing mode, that is the only one relevant for the structure formation. The above linear equa-tion is usually transferred into the Fourier space, which is convenient because, so long fluctuations remain in the linear regime, all modes are decoupled and evolve independently from each other.
Note also that in the linear regime the initial spectrum of the perturbation remains unchanged, except that the amplitude of the fluctuations will grow according to the growing mode (as the system evolves the decaying mode simply damps away). So the power spectrum at some time can be written as:
P(k, t) =P(k, t0)T2(k) Dg(t)
1.3 Formation and evolution of the structure in the Universe
whereT(k) is the transfer function discussed earlier andDg(t) is the growing mode
of Eq. 1.5.
1.3.4 Object formation
The observed isotropy of the microwave background radiation guarantees that the density contrast must have been quite small at epochst&tdec, i.e. at the decoupling epoch. At some later time, the density contrast corresponding to a spatial scale
λ= 2π/k will become comparable to unity and the linear perturbation theory will be no longer a valid approximation. Moreover, there will be no specific advantage to use the Fourier description, as the evolution of the density contrast becomes non– linear.
Let us consider a density contrast δ(x, t) at some time ti. The Universe can be
divided in overdense (δ > 0) and underdense (δ < 0) regions. It is reasonable to expect that the self–gravity in an overdense region will work against the expansion of the Universe so that this region will start expanding at a slower rate compared to the background Universe. This will increase the density contrast and eventually the overdense region will collapse under its own self–gravity, forming a bound system.
Under the assumption of spherical symmetry with homogeneous density (spherical collapse model), it is possible to show that the perturbation breaks away from the general expansion and collapses when it reaches a critical overdensity of:
δcoll= 9π2
16 ≈5.55
The linearly extrapolated density contrast at the collapse time is approximatively 1.686.
The above results are valid for a flat Universe with a zero cosmological constant (Einstein–de Sitter Universe), but can be extended to other cosmological model (Peebles 1993; Lacey & Cole 1993). Once the perturbation has turned–around, it starts collapsing. During the collapse there are large fluctuations in the gravitational potential, on time–scale of the order of the free–fall collapse time (tdyn'(Gρ)−1/2). Because of these fluctuations, particles do not follow orbits that conserve energy. This rapid and mass–independent process is named violent relaxation. Lynden-Bell (1967) computed that the equilibrium state this violent process leads to, reduces, for the appropriate number densities in clusters, to a Maxwell–Boltzmann distribution with a phase space density that produces a Gaussian velocity distribution and an isothermal spatial distribution of galaxies, which is roughly consistent with the ob-served distributions in the inner parts of clusters. The overdensity at virialization can be computed using the virial theorem that gives:
The number of objects collapsed at a given redshift depends on the underlying initial Gaussian random density field. Press & Schechter (1974, PS) realized that, although the small–scale modes have become non linear, large scale modes may still follow the linear theory. Therefore, filtering the linearly evolving density field with filters of different sizes (that correspond to different masses), it is possible to determine if a given region of the space belongs to a collapsed object (it does belong to a collapsed object if it has reached the linearly extrapolated critical density '1.686). The PS formalism can then be used to determine themass function, i.e. the fraction of mass in objects of mass M–M+dM:
n(M)dM =− µ
2
π
¶1/2 ¯ ρ M δc σ2 dσ dMexp µ − δ 2 c
2σ2 
dM
whereσ2 is the variance of the linear density field smoothed over a mass scaleM. The PS formalism has been substantially extended in more recent years (Bond et al. 1991) and is often used to follow the evolution of the underlying dark matter com-ponent in the context of semi–analytic models (see Sec. 1.5 and Chapter 3)
1.4
N
–body simulations
Although the linear theory represents an extremely useful tool to describe the early growth of structure and the growth on scales that are so large to be still in the linear regime, it obviously cannot provide a complete description of the highly asymmetric processes occurring in hierarchical galaxy formation. In that case, numerical simu-lations are usually employed. In N–body simulations the phase–space distribution function f(r,v) is replaced by a set of N particles that are subsequently evolved under their self–gravity. Each particle can essentially be viewed as a delta–function in the phase–space. Therefore, if the number of particles is large enough, the system provides a fair approximation of the phase–space distribution function.
N-body numerical simulations have nowadays evolved into a widely used tool in cosmology thanks to the rapidly growing computer performance and, at the same time, to the development of more sophisticated numerical algorithms.
1.4 N–body simulations
Fourier Transform Techniques (FFT), that provide directly the values of the gravi-tational potential on the grid. It is possible to show that the compugravi-tational effort of the method is O(Ngridlog(Ngrid)). Further refinements of the PM code are given by the P3M (Particle–Particle–Particle–Mesh) and APM (Adaptive Particle Mesh) codes. In these, the force computation is supplemented with a direct summation on scales below the mesh size (P3M), or mesh refinements are placed on highly clustered regions (APM).
Substantial progress in the field has arisen from the introduction of so–called treecodes, where particles are arranged in a hierarchy of groups and the gravita-tional field at each point is computed by a summation over the multipole expansion of the gravitational field of these groups.
The simulations I will use in this thesis have been carried out using the treecode
GADGET (Springel et al. 2001b), that is publicly available, and a particular re– simulation technique that is usually referred to asmass refinementorzoomtechnique (Tormen et al. 1997; Katz & White 1993). First, a cosmological simulation of a large region is used to select a suitable target cluster. The particles in the final cluster and its surroundings (usually all the particles within two times the virial radius of the selected halo) are then traced back to their initial Lagrangian region and are replaced by a larger number of lower mass particles. These are perturbed using the same fluc-tuation distribution as in the parent simulation, but now extended to smaller scales to account for the increase in resolution. This resampling of the initial conditions of the Lagrangian region of the cluster thus allows a localised increase in mass and force resolution. Outside thehigh-resolution region, particles of variable mass, increasing with distance, are used so that the computational effort is concentrated on the cluster of interest, while still maintaining a faithful representation of the large-scale density and velocity field of the parent simulation.
In the ‘boundary region’ a spherical grid is used, whose spacing grows with dis-tance from the high–resolution region and that extends to the box size of the parent simulation. Outside the boundary region, vacuum boundary conditions are used, i.e. a vanishing density fluctuation field.
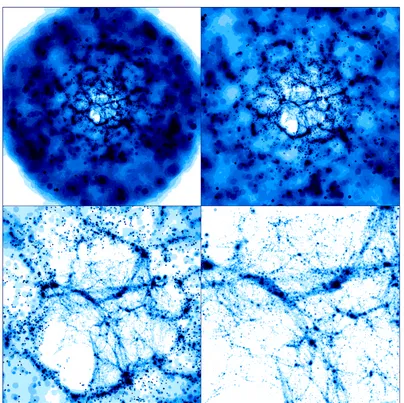
The effect of increasing mass resolution in the high–resolution region, at the centre of the re–simulation box, is clearly visible in Fig. 1.2 that shows a zoom–in on the dark matter distribution for a ‘typical’ region of the Universe at redshift zero. The maps represent slices of 10 Mpc along the z–direction and the dimensions of the box decrease going from the top left to the bottom right panel.
Figure 1.2: A zoom–in on the dark matter distribution for a ‘typical’ region of the Universe at redshift zero. The maps represent slices of 10 Mpc along the z–direction and the size of the box varies from 479 (top left), 380 (top right), 95 (bottom left) to 52 Mpc (bottom right). The figure clearly shows the increasing mass resolution in the high–resolution region at the centre of the re–simulation box.
force, i.e. at small separation the gravitational force is reduced below the Newtonian value in some smooth way.
1.4 N–body simulations
Figure 1.3: Density map of a high resolution cluster re–simulation at redshift zero.
From Springel et al. (2001a). The cluster has a virial mass of 8.4×10¹⁴h−1M
¯.
The high resolution region of the simulation contains 66 million particles.
the latest numerical simulations has been the solution of the ‘overmerging problem’ (Klypin et al. 1999a, see also Chapter 2), i.e. the possibility to resolve self-bound substructures in the smooth dark matter background of simulated haloes. This allows closer link to be made between simulated data and observational results.
Figure 1.4: Projected distribution of a 700–body system with mass comparable to the virial mass of the Coma cluster. From White (1976).
1.5 The physics of galaxy formation
Modern N–body simulations are able to follow the formation and the evolution of dark matter haloes from scales typical of clusters of galaxies, down to scales typical of dwarf galaxies. Dark matter alone, however, does not provide any information about the baryonic component that is the direct observable. In order to make a close link between the theoretical predictions and the observations, it is then necessary to include the evolution of the baryonic component explicitely.
This can be achieved in two ways: the evolution of the baryonic component can be modelled ‘directly’, through the use of hydrodynamical methods that directly follow the gas–dynamics, or modelled making use of simplified ‘recipes’, physically motivated and supported by observational results.
1.5 The physics of galaxy formation
code is Smoothed Particle Hydrodynamics (SPH)9. InSPHsimulations, gas particles, carrying gas properties like temperature, composition and eventually stars, are asso-ciated to the dark matter particles. The gas component is gravitationally coupled to the dark matter but, unlike collisionless material, it also feels hydrodynamical forces arising from its thermal pressure. Radiative heating and cooling processes can be taken into account. These processes play a major role in the formation of galaxies: first, dark matter forms virialized systems during a process of violent relaxation (see Sec. 1.3.4); then the baryons sink to the centre of these haloes because of energy dissipation by emitting radiation. Note that atomic physics provides an accurate de-scription of most of the heating and radiative processes, although some astrophysical situations require a quite high degree of complexity.
In the simple case of a collisionally ionised mix of hydrogen and helium, and also in the case of a ‘polluted’ gas, it is technically not extremely difficult to introduce a proper implementation of the cooling process in simulations. However, the inclusion of the cooling process is not enough for a complete description of the galaxy formation and leads to anovercooling problem, i.e. too much gas cools and form knots of cold and extremely dense gas if other processes like the star formation and the feedback are not implemented (see also Chapter 3).
The actual formation of galaxies include multiple processes that are strongly non linear and strongly interconnected. Moreover, the observational and physical under-standing of these processes and also their dependence on environment are far from complete. For these reasons, the implementation of these processes requires some ad hoc prescriptions. Full cosmological hydrodynamical simulations, including star formation and feedback processes, have been carried out with some success in the last years (Springel & Hernquist 2003). Nevertheless it is important to note that the computational times are still highly prohibitive. This also means that this is not a ‘convenient’ method if one wants to explore the parameters space in order to investigate, for example, the influence of different physical prescriptions on different observational results.
A more powerful technique, in this respect, is provided by the so–called semi– analytic models (SAMs) in which the baryonic physics is approximated using simple yet physically and observationally motivated prescriptions. The SAMs find their seeds in the pioneering work by White & Rees (1978) and have been substantially extended and refined in the last years by a number of different groups (White & Frenk 1991; Lacey & Silk 1991; Kauffmann et al. 1993; Baugh et al. 1996; Kauffmann et al. 1999; Somerville & Primack 1999; Cole et al. 2000). These models have evolved, in
9
the last years, into an important tool for interpreting observational data: with a low number of parameters the SAMs have been successful in providing a unified and coherent interpretation of a variety of observational properties of galaxies on differ-ent scales. These include the luminosity function (but see below), the Tully–Fisher and the Faber–Jackson relation, star formation histories, morphology, and colour distributions. Note however that these models are not without their problems. A well–known problem, for example, is the fact that these models usually predict too many galaxies both at the faint and at the bright end of the luminosity function, resulting in a shape that is notcurved enough to be in good agreement with obser-vational results (Kauffmann et al. 1999; Cole et al. 2000, see also Chapter 3). These models also have problems in reproducing the observed number of lenticular galaxies (S0) in galaxy clusters (Springel et al. 2001a; Diaferio et al. 2001), suggesting that additional mechanisms, besides those usually included, should be considered in order to understand the S0 population.
The field has in particular greatly benefited from recent work that has coupled the SAMs with N–body simulations (Kauffmann et al. 1997, 1999; Mathis et al. 2002; Diaferio et al. 2001; Benson et al. 2000a, 2001; Springel et al. 2001a, see also Chap-ter 3). In this way it is possible to obtain full spatial and kinematic distributions not only for the galaxy population at redshift zero but also for their progenitors at any earlier time, as for galaxies in real redshift surveys.
1.6 Observational results
In the following sections I will try to summarise some of the most important results on galaxy clusters and evolution of galaxies in clusters, that have been gathered in the last decades from observational data. The observational investigation of clusters of galaxies is by no means shorter than the history of the theoretical studies related to this topic. I will thus limit myself to a brief overview, referring to many existing reviews for a more extensive presentation of this topic (Biviano 2000; Bower & Balogh 2003; Poggianti 2003, and references therein).
1.6.1 Cluster components
Clusters of galaxies represent the largest quasi–virialized systems in the Universe. They typically contain 102–103 galaxies in a region of about 1–3 Mpc, with a total mass of∼1014M
¯ forrich groups to∼1015M¯ forrich clusters. First observations
showed that these structures are associated with deep gravitational potential wells containing galaxies with a typical velocity dispersion along the line–of–sight ofσv ∼
103km s−1. The crossing time for a cluster of size R can be defined as:
tcr =
R σv = 1 µ R 1 Mpc 
³ σv
103km s−1 ´−1
1.6 Observational results
Therefore, in a Hubble time (≈10h−1Gyr), the system has enough time in its internal region (.1h−1Mpc) to dynamically relax. This condition cannot be attained in the surrounding environment. Assuming virial equilibrium, the typical cluster mass is:
M ' Rσ 2
v
G '
µ
R
1h−1Mpc ¶³
σv
103km s−1 ´2
1015h−1M¯
A number of different cluster properties have been traditionally used in order to con-struct a morphological classification of these systems. The Bautz & Morgan (1970) system, for example, is based on the degree to which the cluster is dominated by the brightest galaxies within it. In a similar manner, but with a finer classification, Rood & Sastry (1971) introduce a classification system that is based on the nature and distribution of the ten brightest cluster galaxies. Another commonly used classi-fication system was first introduced by Oemler (1974), who simply classified clusters on the basis of their morphological content. Specifically, he defined a cluster asspiral rich if the spirals represent the dominant population, asspiral poor if the fraction of lenticulars is higher than the corresponding fraction of spirals, and as acD cluster if it is dominated by a central cD galaxy with ellipticals representing the majority of the population.
Somewhat surprisingly, these different classifications appear to be highly corre-lated, with the result that clusters can be represented very crudely using a one– dimensional sequence fromregular toirregular. Regular cluster are highly symmetric in shape with a high concentration of galaxies towards the centre. Moreover subclus-tering, is absent or weak in regular clusters. In contrast, irregular clusters have little symmetry or central concentration and usually show significant subclustering.
It is important to note that there is no one–to–one correspondence between the regularity of a cluster and its richness, related to the number of galaxies associated with that cluster. Regular clusters are usually rich, while irregular clusters may be either rich or sparse.
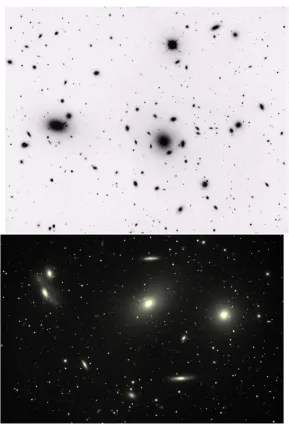
In Fig. 1.5, I show our two closest clusters: the Coma cluster (on the top), a rich cluster with mass ∼ 1015M
¯ containing thousands of galaxies, and Virgo (on the
bottom), a relatively sparse and irregular cluster with mass∼1014M¯.
The galaxy population in clusters exhibits a remarkablemorphology–density rela-tion (Dressler 1980; Whitmore et al. 1993), with an increasing space density of early type galaxies towards the cluster centre. Which physical processes are responsible for establishing the observed morphological mix is still a matter of debate and it is possible that both global cluster properties and the local density environment may play a role.
Figure 1.5: The Coma cluster (top panel) and the Virgo cluster (bottom panel).
kinematical segregation (Adami et al. 1998), with late type galaxies having a higher velocity dispersion than early type galaxies.
fundamen-1.6 Observational results
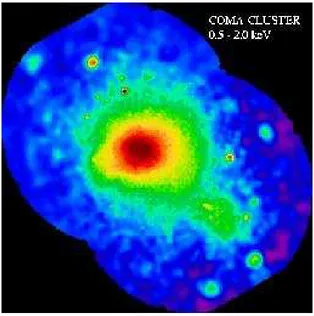
Figure 1.6: ROSAT image of the Coma cluster.
tal plane of elliptical galaxies, which are both very tight (van Dokkum & Franx 1996; Kodama et al. 1998). I will come back to this topic in Chapter 6, where I will study the colour magnitude relation in clusters at redshift∼0.8.
Early X–ray observations (Meekins et al. 1971; Gursky et al. 1971) showed that clusters of galaxies contain a hot plasma, with a typical temperature of 2–14 keV and a central density of ∼ 10−3 electrons cm−3. The hot plasma detected through the luminous X-ray emission, is produced by thermal bremsstrahlung radiation and has a net luminosity of ∼ 1043−45 erg sec−1. Fig. 1.6 shows the X–ray map of the Coma cluster taken with ROSAT.
although the relative importance of different physical mechanisms that can provide viable explanations for this transfer of mass (and metals), is still a matter of debate (see Chapter 4).
1.6.2 Cluster surveys
The first extensive and statistically complete survey of clusters dates back to the work by Abell (1958). Clusters were identified as enhancements in the galaxy surface density on the Palomar Observatory Sky Survey (POSS) plates. Abell’s criteria for the definition of galaxy overdensities were quite subjective: he required that at least 50 galaxies were contained within a metric radius RA= 3h−501 in a given magnitude range. Abell also showed that there is a wide distribution of cluster richness, that broadly relates to the cluster mass. An important breakthrough in the search for galaxy clusters was provided by the advent of charge coupled device (CCD) imag-ing. In the last two decades a variety of different techniques have been used to identify galaxy clusters, the two most common being optical searches for projected galaxy overdensities and X–ray searches for extended thermal bremsstrahlung emis-sion. Modern optically–selected cluster surveys include:
• thePalomar Distant Cluster Survey (Postman et al. 1996), a two band survey of 5 square degrees that used both positional and photometric data in order to enhance the contrast of galaxies overdensities. The survey has provided a catalogue of 79 clusters covering the redshift range 0.2–1.2.
• TheRed–Sequence Cluster Survey (Barrientos et al. 2003), an ongoing project designed to provide a large sample of clusters over the redshift range 0.1–1.4. It uses the red sequence of early type galaxies as a direct cluster indicator.
• The Las Campanas Distant Cluster Survey that provides a sample of ∼ 1000 cluster candidates over 130 square degrees. The cluster–finding algorithm em-ployed in this case was suggested by Dalcanton (1996) and is based on an old idea of Shectman (1973) that the optical background light can be used to ob-tain information about the underlying distribution of galaxies (I will explain in more detail the algorithm in Chapter 5).
In the last twenty years, X–ray surveys have provided an efficient way of con-structing samples of galaxy clusters out to high redshift. TheROSATAll–Sky Survey (Truemper 1993) and subsequent pointed observations have provided a large sample of X–ray selected clusters both in the Northern (NORAS, B¨ohringer et al. 2000) and in the Southern (REFLEX, B¨ohringer et al. 2001) hemisphere.
1.6 Observational results
X–ray surveys Optical/NIR surveys
ICM detection is an unambiguous Possibility to survey large areas indication of a real cluster relatively quickly
High contrast (LX∝n2e) Noisy relation optical
richness–cluster mass
Negligible background Significant background
Low (∼10 per cent) spurious rate High (∼30 per cent) spurious rate
Limited telescope access Many telescopes available
Require optical/NIR follow–up for Many algorithms provide an estimate
redshift of the cluster redshift
Table 1.1: Advantages and drawbacks of X–ray and optical cluster surveys.
active galaxies (Dickinson 1997), or the measurement of the distortion of the cosmic microwave background due to the hot intra–cluster medium (Carlstrom 2002).
It is important to realize that different cluster–finding algorithms and different wavelengths find different types of clusters. The X–ray wavelength detects the hot intra–cluster medium, that is an indicator of a cluster in an advanced dynamical state. In the optical, one searches for overdensities of galaxies. Optical surveys are therefore able to identify younger systems with lower masses than X–ray surveys. On the other hand, the optical techniques suffer from strong limitations due to projection effects: filamentary structures or aligned small groups can easily mimic a rich cluster when projected on the plane of the sky. The various advantages and drawbacks of X–ray and optical surveys are listed in Table 1.1, adapted from Postman (2002).
It is therefore extremely important to keep under control the selection biases due to the particular selection method used, an objective that can be achieved, for example, by using multi–wavelength data.
1.6.3 Galaxy evolution in clusters
There is strong observational evidence that high density environments can signif-icantly affect many galaxy properties. In particular the star formation rate, gas content and morphologies are strongly dependent on density (Moss & Whittle 2000; Balogh et al. 2000; Kodama et al. 2001; Balogh et al. 2002).
environments. These can be broadly grouped into three categories:
• ram–pressure stripping: galaxies travelling through a dense intra–cluster medium suffer a strong ram–pressure stripping effect that sweeps cold gas out of the stel-lar disc (Gunn & Gott 1972; Abadi et al. 1999; Quilis et al. 2000). Although the gas is tenuous, the rapid motion of the galaxy causes a large pressure front to build up in front of the galaxy. Depending on the binding energy of the gas in the galaxy, the intra-cluster gas will either be forced to flow around the galaxy or will blow through the galaxy removing some of the diffuse interstel-lar medium. Related mechanisms are thermal evaporation (Cowie & Songaila 1977) and viscous stripping of galaxy discs (Nulsen 1982), that occur when ram–pressure is not effective: turbulence in the gas flowing around the galaxy entrains the interstellar medium resulting in its depletion.
• Collisions, mergings and harassment: early simulations (Roos & Norman 1979; Barnes 1992) demonstrated that a merger between two spiral galaxies results almost always in a galaxy with structural parameters resembling those of ellip-tical galaxies. Simulations have also shown that collisions and close encounters can have strong effects on the star formation rates of galaxies. The tidal forces generated during the encounter funnel the gas towards the centre of the galaxy and possibly this gas ignites a star burst with subsequent ejection of a large fraction of the material (Barnes 1992; Mihos 2003). At the same time, the gas in the outer parts of the galaxy is drawn out of the system. The cumulative ef-fect of many weak encounters (harassment) can also completely destroy galaxy discs (Moore et al. 1996b).
• Strangulation: current theories of galaxy formation suggest that when a galaxy is accreted onto a larger structure, the gas supply can no longer be replenished by cooling that is suppressed (Larson et al. 1980; Cole et al. 2000, see also Chapter 3).
The relative importance of different physical processes on the observable galaxy properties is still a matter of debate. It is clear that ram–pressure stripping can rep-resent an effective mechanism only towards the centre of massive clusters because the ram–pressure force is proportional to v2 (Gunn & Gott 1972). Individual collisions are expected to be most effective in groups since the velocity of the encounters is sim-ilar to the orbital timescale within the galaxy but, as mentioned above, Moore et al. (1996b) have demonstrated that the cumulative effect of many weak encounters can also be important in clusters of galaxies. In particular, this mechanism can be effec-tive at destroying small galaxy discs, but its effect on the star formation rate of the galaxy is unclear.
for-1.6 Observational results
mation suppression is not driven by extreme processes like ram–pressure. Rather it is something that operates in more commonplace environments, possibly groups in the cluster infall region (Zabludoff & Mulchaey 1998; Kodama et al. 2001).
The population gradients observed in rich clusters seem to agree well with models of strangulation (Balogh et al. 2000; Diaferio et al. 2001), which also provide a natural explanation for the origin of the morphology density relation and agree with the apparent preference of blue galaxies for the outer regions of clusters.
As explained in Sec. 1.1, one of the most important advantages of studying clusters of galaxies is the fact that they are easy to observe up to high redshift, thus allowing one to follow the evolution of a particular class of objects as a function of time.
The first observational evidence of evolution of galaxies in clusters dates back to the work of Butcher & Oemler (1978), who showed a remarkable increase in the num-ber of blue galaxies in clusters atz >0.2. In a later work (Butcher & Oemler 1984), the reality of the effect was confirmed. In this paper Butcher & Oemler addressed a number of concerns about systematic effects in their analysis procedure and they broadened the sample of clusters both in number and in redshift. The fraction of blue galaxies in clusters atz∼0.4 was later demonstrated to be qualitatively similar to the excess of lenticular galaxies (S0) observed in nearby clusters, suggesting that S0 may be the result of morphological transformation of spirals, driven by the cluster envi-ronment (Dressler et al. 1997). As explained above, how exactly this transformation occurs and on which time–scales, is still a matter of debate. Moreover the reality itself of the Butcher–Oemler effect has been criticised by many authors (Andreon & Ettori 1999; Fairley et al. 2002; De Propris et al. 2003b). This criticism arises from the ob-servation that the Butcher–Oemler sample does not provide a homogeneous sample of clusters over the studied redshift range, being primarily constituted by optically selected clusters. This selection, in fact, naturally favours the inclusion of clusters with a significant blue fraction at high redshift, thus mimicking a trend as a function of redshift.