a
Corresponding author: [email protected]
A numerical study of the influence of solidity on the performance of
vertical axis turbine
Teresa Parra-Santos1,a, Diego J. Palomar-Trullen1, Mario Fernandez-Gomez1, Armando Gallegos-Muñoz2, Cristobal N. Uzarraga3, Francisco Castro-Ruiz1
1
University of Valladolid, Department of Energy and Fluid Mechanics, Valladolid, Spain
2
University of Guanajuato, Salamanca, Mexico
3
Technologic Institute of Durango, Mexico
Abstract. The paper is developed in the framework of CFD to study the performance of Vertical Axis Turbines (VAT). One direct application is to establish design trends regarding the solidity. The model is validated with benchmarks from the literature for fluvial turbine. As for turbulence models, transitional SST version of k-w is used. The model includes two additional conservation equations for intermittency and critical Reynolds that establishes the transition from laminar to turbulent. Flow pattern are analyzed at intermediate positions along the revolution. A reduction in solidity increases the operation conditions.
1 Introduction
Vertical Axis Turbines (VAT) can operate at low velocities, hence they are suitable to extract energy from both: wind and water flows. The fluid mechanic design in both cases is quite similar, the only difference is the operating condition. While wind is characterised by velocities around 7 m/s for these applications, the water velocities are in the order of 1 m/s, however, there is a slight change on the range of variation of Reynolds number when operating with air or water. In both cases, Reynolds number has an intermediate value in the transition regime between laminar and turbulent.
This collaboration of three teams from universities of Valladolid (Spain), Guanajuato and Durango (Mexico) started in 2011. Previous milestones involved the characterization of vertical axis wind turbines (VAWT) using 2D models in a non-arm configuration, some examples are:
x The influence of the twist angle variation at the chord ends in symmetric airfoils NACA0015, [1]. x The analysis of the camber effect in
non-symmetric airfoils NACA2425 and NACA7425, [2-3].
x The study of the solidity of the rotor NACA 0025, [3-4].
x Influence of fixed pitch angle in NACA0015 [5-6].
The turbulence models that have a better performance in 2D simulations of VAT are the RNG k-H used in [2-4] and the transitional SST k-Z applied with success in [5-6] and recommended by other references of the literature [7-8].
This paper is devoted to the validation of the 2D model of a three straight blades turbine type H- Darrieus, see figure 1, and the analysis of the influence of solidity on the performance of the rotor.
The manuscript is structured as follows: section 2 summarizes the main details of the numerical model (mesh, operating conditions, and turbulence model), section 3 shows the validation of the model, in section 4 the flow patterns are analysed and section 5 shows the influence of the solidity in the power coefficient curves.
Fig. 1. Scheme of the dimensions of the UNH-RVAT [9-10].
2 Numerical model
Navier Stokes equations for two-dimensional, transient, incompressible and turbulent flow are to be solved using
moving reference mesh in the rotor and steady mesh in its surroundings.
Equations were solved with a second order scheme. Pressure and velocity coupled resolution uses the method SIMPLE.
Temporal resolution corresponds to 600 time steps per revolution; hence it is recalculated when the rotation speed is modified.
߂ܶ ൌ
ఠଶగ (1)2.1 Boundary conditions
The geometrical details of the turbine are summarized in table 1, and the operating conditions are indicated in table 2.
Table 1. Summary of geometrical details for VAT.
Airfoil NACA 0020
Shaft Diameter 0.095 m
Rotor Radius (R) 0.5 m
Length (b) 1 m
Chord (c) 0.136 m
Number of Blades (Z) 3
Solidity(ı) 0.4
Table 2. Summary of operating conditions for VAT.
Airfoil NACA 0020
Density (kg/m3) 1000
Viscosity (kg/(ms)) 1.1 10-3
Water Velocity (m/s) 1
Turbulence Intensity (%) 10
Averaged Reynolds no. (-) 9.07 105
Depth of the turbine (m) 1
Reference Pressure (pa) 111125
2.2 Turbulence model
Transitional SST version of the k-Z model performs adequately when the flow regime is transient between laminar and turbulent regimes [7, 8]. It solves two additional conservation equations: one for intermittency, that is the ratio of time for turbulent flow and another for the transient Reynolds number.
ப
ப୲ሺɏሻ ሺɏሬԦሻ ൌ ቆ൬Ɋ ஜ
ಋ൰ ሺɀሻቇ (2) ൌ ஓଵെ ஓଵ ஓଶെ ஓଶ (3)
The source term has different contributions of production, P, and destruction, D, of the laminar regime. Subindex 1 is related to the strain tensor whereas subindex 2 is function of control functions to establish the laminar or turbulent regime are based on 2 definitions of Reynolds number indicated in equations (4) and (5).
ܴ݁௩ൌఘ௬ మௌ
ఓ (4)
ൌஜன (5)
Where S is the strain tensor, Z is the turbulent frequency scale and k is the turbulent kinetic energy.
2.3 Non dimensional parameters
The performance of the turbine is expressed in terms of non dimensional parameters. The power coefficient provides information of the efficiency of the turbine, being its maximum value 59% based on the Betz theory.
Power coefficient depends on the torque T, rotation speed Z and fluid velocity V, see equation (6),
ܥൌభ ்ఠ
మఘ௩ಮయ (6)
TSR stands for Tip Speed Ratio and is defined in equation (7).
ܴܶܵ ൌఠோ௩ಮ (7) Solidity was assumed to be the equation (8).
ߪ ൌ
ଶோ (8)2.4 Sensibility to the mesh
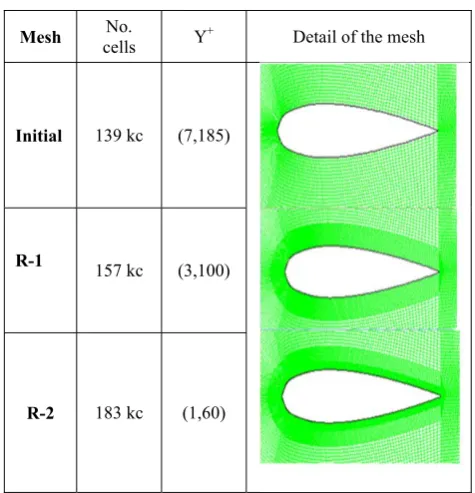
Three different meshes are used to test that the results are independent from the spatial resolution. The main difference is the spatial resolution near the foils. Table 3 shows the number of cells of the three models as well as evidences of the quality of the mesh.
One parameter related to the mesh quality is the wall y+ defined as a function of the friction velocity uW, the distance of the cell center to the wall and the kinematic viscosity. The transitional STT k-Z turbulence model requests y+ values around the unit in order to solve the laminar boundary sub-layer.
Table 3. Details of the mesh near the blades.
Mesh No.
cells Y
+
Detail of the mesh
Initial 139 kc (7,185)
R-1
157 kc (3,100)
Fig. 2. Sensibility to the mesh of the peak power coefficient.
Figure 2 depicts the power coefficients for the three meshes at design operating conditions, i.e. with the TSR that provides the maximum power coefficient. Looking for a balance between precision and computational cost, any of the R-1 and R-2 meshes are suitable because of their low variance.
3 Validation of the model
The validation was carried out using the benchmark UNH-RVAT (University of New Hampshire- reference vertical axis turbine). This test case has a rotor with three blades NACA0020 and it is properly referenced by Bachant and Wosnik [9-10].
Fig. 3. Validation of the numerical power coefficient with experimental results from [9-10].
Each simulation must converge in a periodic behaviour with three periods in every revolution of the rotor. Once full periodical performance is achieved, the averaged of the instantaneous power coefficient provides
one point of the characteristic curve. When modifying the rotation speed of the rotor, the curve is built up. Figure 3 shows the experimental results for the model UNH-RVAT, ref [9-10], in green diamonds as well as numerical results in blue squares.
A similar type of turbines composed by two counter-rotating rotors is the model DOE RM2 (Department of Energy - Reference Model 2) characterised at the Sandia Laboratories [11-12]. This has blades NACA 0021 and the application field is energy production from fluvial streams.
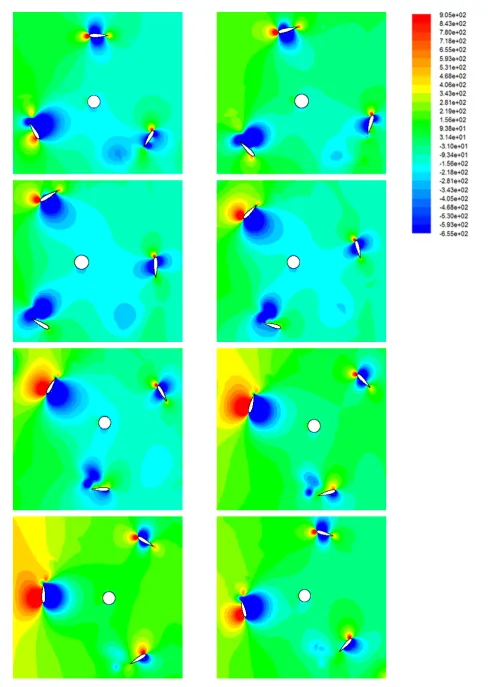
4 Flow pattern at design conditions
This section is devoted to the analysis of the flow pattern. The rotor spins counter clockwise.
Table 4. Identification of pressure and suction side of the airfoils.
Position from 12 hours in counter wise
clock
High pressure side
Low pressure side
30° External Inner
45° External Inner
60° External Inner
75° External Inner
90° External Inner
105° External Inner
120° External Inner
195° Inner External
210° Inner External
225° Inner External
Figure 4 depicts the contours of pressure from the initial position with blades in locations 0º, 120º and 240º every 15º. The instantaneous flow patterns shows that the suction side (low pressure side) of the blades changes from the inner side to the outer side as indicated in table 4. As a result, the instantaneous power coefficient changes from a minimum value in location with blades at 0º, 120º and 24º, to a maximum value when blades are at 60º, 180º and 300º. The averaged power coefficient is the one represented in the characteristic curve of figure 3.
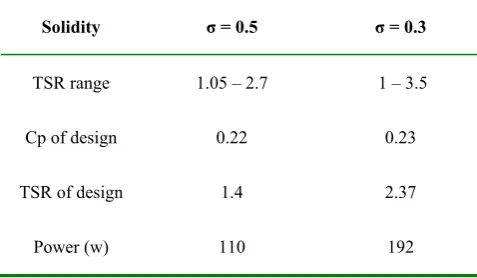
5 Influence of the solidity
Table 5 shows the conditions of the NACA 0020 operating as well as an estimation of the power of energy generated when operating with a flow of water of 1 m/s.
Table 5. Details design conditions at different solidities.
Conclusions
This work is the collaboration of three research groups: University of Guanajuato, Durango and Valladolid. The background was based on H-Darrieus operating at low wind velocities.
This work is the first one with cross turbines suitable to operate with marine currents or fluvial flows. The model is validated using the benchmark UNH-RVAT from the University of New Hampshire. It is a relatively new test case with available experimental results that allows validation of numerical models.
A simple 2D model using transitional SST k-omega model is suitable to validate with the experimental results from other sources.
A brief study of the influence of the solidity on the efficiency of the turbine has been developed, showing how in the case studied, decreasing the rotor solidity increases the operating range and the TSR of design.
Future works consider the design optimization based on different geometric parameters as solidity, pitch angle, torsion, and number of blades among others.
References
1. N.C. Uzarraga, A. Gallegos, M. T. Parra, J. M. Beltran. ASME ESFuelCell2012-91113 (2012) 2. T. Parra, C. Uzarraga, A. Gallegos, M.A. Rodriguez,
F. Castro. FEDSM2014Ǧ21356 (2014)
3. T. Parra, C. Vega, A. Gallegos; et al, EPJ Web of Conferences, 92 (2015) 02058
4. T. Parra, M. Esteban, F. Gonzalez, C. Uzarraga, A. Gallegos, F. Castro. International Conference of Advanced Technologies and Sciences (2014) pp. 770-772
5. T. Parra-Santos, E. Chamoso, V. Gomez, A. Gallegos, C.N. Uzarraga and M. A. Rodriguez. EPJ Web of Conferences, 114 (2016) 2088
6. T. Parra-Santos, D. J. Palomar Trullen, A. Gallegos, C. N. Uzarraga, M. Regidor-Sanchez, F. Castro. FEDSM2016-7503 (2016)
7. R. Lanzafame, S. Mauro, M. Messina Energy Procedia 45, pp 131 – 140 (2014)
8. R. Lanzafame, S. Mauro, M. Messina. Renewable Energy 52, pp. 31-39 (2013).
9. P. Bachant and M. Wosnik “Effects of Reynolds Number on the Energy Conversion and Near-Wake Dynamics of a High Solidity Vertical-Axis Cross-Flow Turbine” Energies (2016)
10. P. Bachant and M. Wosnik “Reynolds Number Dependence of Cross-Flow Turbine Performance And Near-Wake Characteristics” Proceedings of the 2nd Marine Energy Technology Symposium METS-(2014)
11. C. Hill, V. Neary, B. Gunawan, M. Guala, F. Sotiropoulos. “Reference Model Program RM2: Experimental Results” Report June 24, (2014)
12. V. S. Neary, A. A. Fontaine, P. Bachant, B. Gunawan, M. Wosnik, C. Michelen, R.J. Meyer. W. A. Stranka. Sandia National Laboratories (2014).
Solidity ı = 0.5 ı = 0.3
TSR range 1.05 – 2.7 1 – 3.5
Cp of design 0.22 0.23
TSR of design 1.4 2.37
![Fig. 1. Scheme of the dimensions of the UNH-RVAT [9-10].](https://thumb-us.123doks.com/thumbv2/123dok_us/8142313.1357229/1.595.322.516.486.689/fig-scheme-dimensions-unh-rvat.webp)