Growth of Productivity in Electronic-Commerce
Stores Based on Customer Purchase Data Analysis
via Performance of Data Exploring Techniques
Tahereh Etehadnezhad1, Vahid Khatibi Bardsiri∗2
1
Student of Information Technology Engineering (M.Sc.) On Software Design and Production, Department of Information Technology Engineering, Islamic Azad University of Kerman, Kerman, Iran.
2
Assistant Professor of Islamic Azad University of Kerman, Department of Information Technology Engineering, Islamic Azad University of Kerman, Kerman, Iran.
∗
Corresponding author, E-mail: [email protected]
Abstract
In modern world, increasing sales and attracting customers is of main concern of business owners. Electronic-commerce is a new type of sales and marketing in which managers should recognize what is important to their customers in their target market. Using machine learning algorithms has a high practical value in solving a range of issues related to the identification and evaluation of customer behavior. In recent years, one of the most active research areas in the field of machine learning has been the use of collective and combinatory categorizers. In this study, using the machine learning algorithms combined with the genetic algorithms and hybrid classification algorithms is a new method for identifying the behavior of customers. Genetic algorithm with statistical target function is used to select the property and reduce the dimension of the data and then by hybrid classification with the Boosting algorithm is applied to classify the data. The main objective of this study was to identify the behavioral patterns affecting sales in electronic-commerce stores. If we can correctly classify the data, we can greatly detect the effective pattern on sales or even predict its onset. The results of this categorization on the extraction features of presented algorithm were compared with the results of the classification using all the features. The results show that the proposed method has a significant advantage compared to other feature selection methods.
Keywords: Customer Behavior, Electronic-Commerce, Genetic Algorithm, hybrid Classification, Data Mining
1. Introduction
Todays, the strong presence of various competitors and their massive use of information and communication technology has made the competitive position of companies in undesirable conditions, and since traditional methods in analysis of data do not work effectively, it is necessary to design and modeling more appropriate strategy with a scientific and precise point of view. In
modern world, increasing sales and attracting customers is of main concerns to business owners.
Electronic-commerce is a new type of sales and marketing in which managers should recognize what is important to their customers in their target market and must model what advertising or which type of sales or even which social activity of Producer Company and which slogan can affect the audience more. Recently, it has been identified that the use of machine learning algorithms has a high practical value in solving a range of issues related to the identification and evaluation of customer’s behavior. In recent years, one of the most active research areas in the machine learning field has been the use of collective and combinatory categorizers. Research has shown that the combination of individual categorization has led to a significant improvement in categorization performance through general use as well as growth in their application. This research investigates a novel method for feature selection using genetic algorithm with statistical objective function and then classification based on the predicted behavior evaluation of three categorizers for different types of noise according to the accuracy of customer's classification and how such accuracy can be upgraded due to the use of categorization groups.
2. The General Framework of Proposed
Method
Modern businesses are subject to various crises that need to be able to equip themselves with new techniques in different parts of the organization as well as important sectors of marketing and sales, in order to avoid the losses caused by these crises. Accordingly, the prediction of
governing behavior patterns of customers, is an important part of a decision-making process in relation to the analysis and management of sales pattern. Over the past decade, a number of the world's largest electronics stores have developed complex systems for modeling and pattern recognition in relation to the important aspects of their business lines. Such models seek to assist these departments in quantifying, integrating and managing in geographical and production lines. The outputs of these models also play major roles in the management of sales and performance measurement processes. Most of the methods of exploring customer behavior patterns need past data through which models are created and validated. By employing a large number of advanced measurement techniques, most of sales and marketing data sets contain many irrelevant unrelated and duplicated data. Such problems can reduce the effectiveness of training algorithms, due to the fact that redundant or irrelevant features do not play any roles in creating a classifier. Only relevant features that feed the classifier are effective, thus reducing the dimension plays an important role in machine learning, helping to reduce the computational cost and improve the performance of classifier models, especially for high-dimensional data. In other words, in a smart detection system, eliminating repetitive and redundant features is a fundamental step and can help to increase the classifier's accuracy. Dimension reduction can be achieved by two approaches: feature extraction and feature selection. Feature extraction represents its linear or nonlinear transformation from the original space to a new, smaller space. On the other hand, the feature selection, produces a subset of features through selecting the important features of the original samples without any changes. In general, a good subset of features should have the following characteristics: First, the selected features can be able to represent input patterns, because unrelated features only increase the search space. Second, the selected features include all the information used to distinguish patterns with multiple tags of data sets. Such a subset of features can achieve the satisfactory and acceptable classifier performance, regardless of what educational algorithm was used. Third, removing the redundant features can reduce the size of the data set. If irrelevant and redundant features are chosen inappropriately, the learning process is overwhelmed and makes the training process ineffective. Finally, the computational cost and the time of the classifier process are also based on the subset cardinality, and the reduction in the number of features leads to a significant decrease in the computational complexity. Accordingly, a good subset of the features provides the most important independent information for the classification decision, so that these characteristics are not correlated to each other. Finding the
subset of the optimal feature Fs from the large set of F's,
which leads to the exponential growth (definition) of the search space (2d, where d here implies the size of F), which is not computationally attractive. Many unsustainable search methods have sought to find solutions that are close to optimal. Since the genetic algorithm is one of the optimization tools that is widely used to find solutions in complex and non-linear search spaces, it is also used to solve feature-selection problems.
In this study, a new intelligent system for automatic detection of client’s behavior patterns is presented. This system focuses on genetic algorithm-based selection, a proper subset of features for providing input patterns, through the use of a new benchmark of independence and resolution to reduce the dimension in order to identify the behavioral patterns of customers in electronic-commerce stores and to obtain a high degree of accuracy of category. An efficient method of selecting a subset based on a genetic algorithm is proposed for data on sales analysis in electronic-commerce stores. Since the proportion of similarity between classes to the similarity within the subset categories can provide their participation in the categories, the subset of the optimal features is selected in terms of the category's independence score. Similarity matrix among the variables refers to the relationship between variables in terms of their category tags, and as much as this criterion is larger, these two variables are less repetitive.
One of the main problems for using machine learning algorithms in identifying behavior patterns of electronic-commerce customers is the inaccessibility, scarcity and incompleteness of data, that is, data for model training. Most financial institutions do not share their data with other organizations, and, accordingly, an efficient database with a large amount of data can not be formed. In addition, surveys for collecting credit data are usually small, but their implementation is difficult and costly. The other important issue that has been addressed to researchers using a financial or credit data set is to create data noise in the data. Credit data sets can become noisy for some reason.
This includes inaccurate information or unreported information (Without a direct benefit, a manager or designer can view data collection as a complicated issue that can be done poorly, for example) or done in a place where data is combined from a number of different chain stores, and some specific areas can be left out because data is not collectable for all customers.
example, tests on individuals to evaluate the effectiveness of a new credit risk method, failing to follow the instructions can result in data noise. This is closely linked to the size of the collected data. By eliminating all the noise that we have, we reduce the size of the sample population to a greater degree. By eliminating all the items that have noise, we can reduce the population size of the sample to a greater degree. Noise data management is an important issue for learning classifier because the noise event in any of the training or testing sets (categories) affects the prediction accuracy of the trained classifiers. This can cause serious problems for researchers. For example, this can lead to bias and lead to inaccurate conclusions from a research study. Inappropriate noise management in the data set can also restrict the generalizability of research findings (Verma, 2016). For example, if you start your work based on statistical analysis, you may lose some important features of your data. Statistical analysis also provides some characteristics related to your data, such as the number of samples, the number of features, the number of categories, and so on. If these assumptions were wrong, the results of the statistical analysis can be totally false and invalid. The seriousness of this issue is based on the noise level and the type of feature that contains the noise. Accordingly, considering the amount of noise and the noise characteristics on which it exists, are important on the time of evaluating the noise of feature in the data. Learning machines and identification techniques of a variety of statistical models have been used in financial issues to identify the behavior patterns of electronic-commerce store customers. Studies on machine learning in behavior analysis systems indicate that this method is based on the fact that widely available tools use well-understood algorithms. Progress even as much as a fraction of one percent in precision will lead to maintenance of significant future capital investments. Hence, in recent years, there has been an enormous amount of articles on machine learning and statistical communities that have examined the issue of to combine models or model predictions. Many of the works in the field of machine learning and statistical pattern identification have shown that the combination of individual categorizers is an effective way to improve classification accuracy (Kargari et al., 2012). A combination was created by educating multiple educators for a single responsibility and then combining their predictions. There are different ways in which combinations can be created and the resulting output is combined to form new samples. Common approaches to creating compounds include changing the used samples for training through techniques, such as the packaging method, the method of boosting, the stacking method, the change in the characteristics used in the training, and the creation of a random state in the classifier itself. The package creates a
set of categorizers by sub-collections of training samples to create different assumptions. After various assumptions are made, they are combined through a voting mechanism. Boosting also uses a voting system to combine classifiers. But instead of subdividing the training samples, it creates a hypothetical assumptions. In each iteration, a new categorizer was created focusing on those cases that were incorrectly managed by the previous categorizer. This is accomplished by providing a weight to each item in the training samples and adapting these weights according to their importance after each repetition. Both packaging and Boosting techniques use categorizers generated by the same learning algorithm and are obtained by identical data. Finally, the stacking method can combine the classifiers derived from different learning algorithms using a high-level categorizer-i.e. Meta classifier-to combine lower-level models. This is based on the fact that different categorizers derive from matched data and different learning algorithms use different biases to search through hypothesis space. This approach expects the meta-classifier to be able to learn to choose between predictions created by the base classifier in order to obtain a precision better than any of them, which is largely similar to the choices of a group of experts.
Noise tolerance in educational data is an issue and tolerance of noise data in training sets is another issue. Data presented to a given categorizer can be as noise in one or more modes during the training or experimental processes. For example, attribute values or category tags can be noisy. In the direction of the goal, we assume that the tags of the categories are not noise, that is, only the feature values are considered to contain noise. Although the noise data issue is adequately investigated in the real world data set, there is much less research in relation to the consideration of the responsibility of assessing the learning accuracy and the classification of monitored machine learning algorithms for noise data. In addition, as far as we know, no research has been done on the effect of the combination of categorizers on the predictive accuracy of identifying the customers’ behavior patterns of electronic-commerce store.
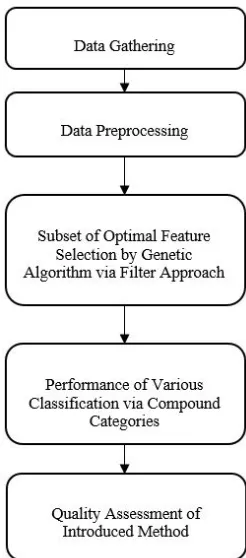
categorization issues. They can also achieve good performance in relation to many tasks. The figure below illustrates the steps in the proposed method.
Figure 1. General flowchart of the proposed method
The proposed approach has been validated with standard sales data in electronic-commerce stores and the proposed solution has been used to train three categorizers. In summary, in this research, a new intelligent system for automatic detection of patterns in sales analysis in electronic-commerce stores is presented. The system focuses on genetic algorithm-based selection, a proper subset of the feature to provide input patterns, by using a new correlation criterion to reduce the dimension of data and obtain high ranking accuracy of category. An efficient method of selecting a subset based on a genetic algorithm is proposed for transaction data of electronic-commerce stores. Since the ratio of the inter-similarity matrix to the similarity within a category of subsets can provide their contribution in the categories, the subset of the optimal property is selected in terms of the degree of correlation. Dispersion within the category shows the degree of similarity of data within a category to each other, and similarities between categories shows the degree of differentiation of the data in a category to other categories. After selecting the optimal features of the machine algorithm, the boosting method is used to classify the data. Another innovation is that the proposed method combines
three backup vector machine encoders, the decision tree C4.5 and the k-neighbor classifier, for the first time, and greatly enjoys the benefits of these algorithms. The proposed method has been implemented and good results have been obtained by testing on the appropriate data set. The results will be reviewed further.
3. Results and Discussion on Results
3.1 Implementation of Environmental Features
MATLAB R2016a software has been used to implement the proposed method. This simulation has been run on a computer system with corei7 processor with 4 GB of memory and running on the Windows 7 operating system.
3.2 The Used Data
To evaluate the methodology and compare it with other methods, a sample of actual data that belongs to the standard sales marketing system is used. This data set contains 45211 samples, each sample contains 20 features. The genetic algorithm has been applied to 50 runs during each experiment on the training set. At the end of each run, the best subset that has been discovered is used to train the proposed combinatory classifier and evaluate its performance. The optimal parameters of the genetic algorithm are unconsidered by the use of a set of preliminary tests, as listed in Table (1) and used for all reported experiments. Category models have been created on training samples. The functions of educational algorithms were evaluated on educational samples and averaged over 50 times of data repetition
3.3 Validation
In order to obtain the proposed categorization accuracy, the cross-validation method (circular estimation) is used in this study.
3.4 Evaluation Criteria
In each categorization, the answers fall into one of the following four categories:
True Positive answer (TP): Records of this category, are in the positive category, and the categorizer has correctly identified them as positive.
False Positive answer (FP): Records of this category, are in the negative category, and the categorizer has wrongly identified them as positive.
False Negative answer (FN): Records of this category, are in the positive category, and the categorizer has wrongly identified them as negative.
Accuracy= (1)
3.5 Setting the Parameters of the Genetic Algorithm
To simulate this method, parameters must be set in this algorithm, which are given in Table (1).
Table 1: Parameters of genetic algorithm and stop conditions
Parameters Amount
Population Number 100
The Number of Genes Per Chromosome 20
Selection Type Elitism
Number of Elitism 2
Type of Intersection Single-Point Integration
Crossover Probability 0.6
Probability of Intersection 0.2
Probability of Mutation To 200 Repeat or No Progress
in 5 Consecutive Repetition
3.6 Features Selected by the Proposed Selection
Method
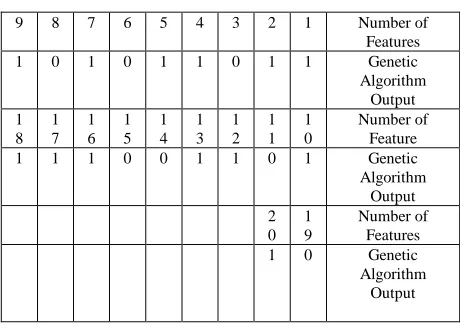
In this research, to select the features, a categorization function is used to evaluate the suitability of the feature subsets. This method does not use feedback from the applied learning algorithm. A genetic algorithm has also been used to search for valid features. The reason for using the genetic algorithm is that this algorithm can perform a random search and quickly converges to the best answer. Bit number 0 in the final chromosome of the genetic algorithm means no selection and the bit number 1 means the selection. Therefore, the columns that are not selected have little effect on determining the class of data and are removed from the data set. In the genetic algorithm used in this study for data on sales transactions, the total number of initial columns was 20 features, of which 13 were bits 1 in the final chromosome, and the rest of the 7 features were bits 0. This means that 13 properties are recognized as important attributes and the rest are deleted and sorting operations are performed on these 13 attributes. This means that 13 features are recognized as important features and the rest are deleted and categorization operations are performed on these 13 features. In the table below, the list of selected and not selected features are expressed. The
numbers 1 in the output of the genetic algorithm represent the feature selection and the zero numbers indicate the feature is not selected.
Table 2. Feature Selection Table
Number of Features 1
2 3 4 5 6 7 8 9
Genetic Algorithm
Output 1
1 0 1 1 0 1 0 1
Number of Feature 1
0 1 1 1 2 1 3 1 4 1 5 1 6 1 7 1 8
Genetic Algorithm
Output 1
0 1 1 0 0 1 1 1
Number of Features 1
9 2 0
Genetic Algorithm
Output 0
1
These 7 unallocated features are eliminated by the genetic algorithm from the data set, and only 13 of the important features selected by the genetic algorithm form the datasets used for categorization by the classifier.
3.7 Evaluation of the Quality of the Proposed
Method of Feature Selection
The proposed combinatorial categorization of this study was discussed in the previous section. This hybrid category has been used to evaluate the subset of the obtained property. The proposed algorithm's performance with the combined classifier is shown in the three general modes of features, the features selected by the genetic algorithm and the unmatched features in Table (2). The best and worst category accuracy are shown with increasing the number of repetitions. In order to confirm the efficiency and generality of our method, the functions obtained are compared with the functions derived from the whole set of features and unmatched features. Precision is for the time when all features and subsets of the optimal features are provided.
Table 3: Accuracy of categorization (percentage) due to the use of all selected and not selected features
The Proposed Combination Classifier
All Features 82.34
Subset of Selected Features 92.28
It is worth mentioning that the obtained performance by using the subset of the selected features is superior to the whole set of features. In particular, it contains categorization methods combined with the other states. Therefore, the results clearly show the quality of the proposed method. In order to validate the proposed method of selecting a feature based on the genetic algorithm, the results are compared with the results obtained from the two methods of choosing the classic feature selection grade F11 and the correlation-based feature selection. As it can be seen, our method offers better results than other methods. F grade method has a relatively worse performance compared to our method and shows relatively better performance compared to the correlation-based property selection method. Our approach with the proposed combined categorization has the most advanced category performance among these three feature selection methods. In general, the proposed method of feature selection based on genetic algorithm along with a hybrid categorization is very effective for identifying the behavioral pattern affecting sales in electronic-commerce stores. Table (4) shows this comparison.
Types of Classifiers
Feature Type The Proposed
Combination Classifier Decision
Tree C4.5 K-Nearest
Neighbor (KNN) Support
Vector Machine Classifier
Selected Features by
Genetic Algorithm 92.28
82.8 79.2
87.02
F-Score 84.78
81.49 78.6
85.08
Correlation-Based Feature
Selection 86.01
84.73 77.21
83.81
Table 4: Comparison of the percentage of accuracy obtained by the proposed method and other methods
3.8 Quality Assessment of Category Combination
After selecting the optimal features, the proposed algorithm uses the boosting method to categorize the data. Boosting algorithm is a machine learning algorithm used to improve performance, and to solve other learning algorithms problems. The boosting algorithm is an algorithm for sequential combining the categories. In this method, the categories are connected and run continuously. The categorization of each new step is set in favor of the falsified samples sorted in the previous steps. The proposed method combines the three category tree C4.5, the classifier of k- nearest neighbor and the backup vector
machine, and takes the advantage of these algorithms. To evaluate the proposed hybrid category method and to show that the hybrid category well utilizes the advantages of single category algorithms and the degree of obtained accuracy is higher than each of the categories, in this section the results of the combined method with each of the categorizers individually are compared.
These comparisons are expressed in two states of the general features and selected features, in order to show the effectiveness of the proposed feature selection method with the genetic algorithm. These results are shown in the table below. As the results show, the proposed method has the highest category accuracy compared to the neural network, the decision tree, and K nearest neighbor. By comparing the results based on the whole set of features, the categorization function of the proposed method has progressed. Table (5) illustrates the comparison well.
Types of Classifiers
Feature Type The
Proposed Combinatio n Classifier Decisio
n Tree C4.5
K-Nearest Neighbor
(KNN) Support
Vector Machine Classifier
Selected Features by
Genetic Algorithm 92.28
82.8 79.2
87.02
Total Primary Features 82.34
78.2 76.71
80.91
Table 5: Comparison of the accuracy of different categories (percentages) due to the use of all the selected features and optimal features.
3.9 Comparison of the Accuracy of the Proposed
Method with Other Methods
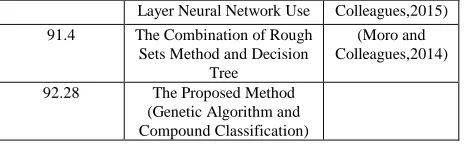
There are methods in which they operate in the field of sales pattern recognition. For the fairness of the evaluation of the proposed method, we need to look at algorithms that have done their proposed method on the data set provided in this study, i.e. the UCI Reservoir data set. For this purpose, two existing studies (Femina et. al., 2015) and (Moro et. al., 2014) are used that are the latest and best methods available in the field. This comparison implies that our method has the highest accuracy of detection. The comparison shown in Table (6) shows that our method accuracy is higher than the accuracy of other methods. It should also be noted that our method has a relatively less complexity; therefore, our method is generally very efficient.
Types of Studies Methods
Accuracy of Classification
in the Best Situation
(Femina and Regression and
Colleagues,2015) Layer Neural Network Use
(Moro and Colleagues,2014) The Combination of Rough
Sets Method and Decision Tree
91.4
The Proposed Method (Genetic Algorithm and Compound Classification) 92.28
Table 6: Comparison of the results of sales behavior pattern identification in different ways
As shown in this diagram, the method presented in this study is more accurate than the previous three methods, which shows the high quality of the categorization provided in this paper. This is because the hybrid categorization method presented in this study will be able to perform well on the selected features of the genetic algorithm and to perform a very accurate categorization. But this accuracy is generally calculated for all categories. As shown in the table and diagram, the dropped input data set in the proposed method provides better performance with the number of repetitive training and shows better performance against the results of previous work. Since the result derived from the dropped input dataset shows a better performance and shows a significantly higher advantage in computing, it is a better way to run in real situations. Accordingly, the proposed algorithm of combining methods with dominant input advisers can be a suitable method for deducing the problem of identifying a behavioral pattern affecting sales in electronic-commerce stores.
4. Conclusions
In this research, with the help of pattern recognition techniques, an effective method is presented for selecting the most effective features in identifying the effective behavioral pattern of sales in electronic-commerce stores; In which, using experimental patterns and different algorithms, the ability of each feature was selected individually along with other evaluation features, and finally, the features that had the best value of the function of performance evaluation were selected. Feature selection method based on the genetic algorithm has been proposed to determine the subset of the optimal property. Here, samples belonging to different categories are well-separated and features are less likely to have redundancy. This method does not require a one-dimensional preset search space. A new fit function of the genetic algorithm is expressed and used to evaluate the properties of the agent. Then the data classification procedure was performed using a hybrid category with the boosting algorithm. Simulation results on online transactions data of sales companies validate the proposed method in sales
operations. The solutions obtained have been approved in comparison with the methods of selecting the various categorization features, as well as in comparison with the two best practices of the previous studies.
References
[1] Alias Devi, P. I., Rajagopalan, S.P., (2012), “Analysis of Customer Behavior using Clustering and Association Rules”, International Journal of Computer Applications, Vol. 43, No.23, pp. 19-27.
[2] Berry, M. J. A., Linoff, G. S., (1997), "Data Mining Techniques: For Marketing, sales and Customer Support", ISBN: 978-0-471-17980-1, Vol. 3, No. 11, pp.32-37.
[3] Bertolini, M., Braglia, M., Carmignani, G., (2006). “Application of the AHP Methodology in Making Aproposal forA Public Work Contrac”, International Journal of Project Management, Vol. 24, No. 3, pp.19-27.
[4] Faisal K., Alamgir M., Dahal H. K., (2011), “Enhanced Classification Accuracy on Naïve Bayes Data Mining Models”, International Journal of Computer Applications, Vol. 28, No. 3, pp. 9-16.
[6] Femina, B. T, Elayidom, S. M, (2015), "An Efficient CRM-Data Mining Framework for the Prediction of Customer Behaviour", International Conference on Information and Communication Technologies.
[7] Kargari, M., Sepehri, M.M. (2012), "Stores clustering using a data mining approach for distributing automotive spare-parts to reduce transportation costs, Expert Systems with Applications 39, Vol. 1, No. 2, pp.56-67.
[8] Moro, S., Cortez, P., Rita, P., (2014), "a data-driven approach to predict the success of bank tele marketing", Decision Support Systems.
[9] Ngai, E. W. T., Xiu, L., Chau, D. C. K. (2009). "Application of data mining techniques in customer relationship management: A literature review and classification". Expert Systems with Applications, 36(2), 2592-2602, doi: 10.1016/j.eswa.2008.02.021.