Article
1
Modeling the Dynamic Concentration Profiles and
2
Efficacy of Type-I and Type-II Photopolymerization
3
Jui-Teng Lin 1, Da-Chuan Cheng 2, Kuo-Ti Chen 3, and Hsia-Wei Liu 4,*
4
1 New Vision Inc., 10F, No. 55, Sect.3, Xinbei Blvd, Xinzhung, New Taipei City, Taiwan; [email protected]
5
2 Department of Biomedical Imaging and Radiological Science, China Medical University, Taichung 404,
6
Taiwan; [email protected]
7
3 Graduate Institute of Applied Science and Engineering, Fu Jen Catholic University, New Taipei City,
8
Taiwan; [email protected]
9
4 Department of Life Science, Fu Jen Catholic University, New Taipei City, Taiwan; [email protected]
10
* Author to whom correspondence should be addressed; Hsia-Wei Liu, e-Mail: [email protected]
11
12
ABSTRACT: The kinetics and efficacy profiles of photoinitiated polymerization are theoretically
13
presented. For the same dose, lower light intensity achieves a higher steady-state-efficacy (SSE) in
14
type-I; in contrast, type-II has an equal SSE. Higher light intensity has a faster rising efficacy, due to
15
faster depletion of photoinitiator (PS) concentration. However, type-II process is also affected by the
16
available oxygen. Higher light intensity produces more efficient singlet oxygen, resulting a higher
17
transient efficacy, in which all intensities reach the same SSE when oxygen is completely depleted.
18
With external oxygen, type-II efficacy increases with time, otherwise, it is governed only by the light
19
dose, i.e., same dose achieves same efficacy. Moreover, type-II has an efficacy follows Bunsen Roscoe
20
law (BRL), whereas type-I follows non-BRL. The measured type-I efficacy and gelation profile are
21
analyzed by our analytic formulas. Schematics of the photocrosslinking stage defined by the
22
availability of oxygen is developed, where both type-I and –II coexist until the oxygen is depleted.
23
The overall efficacy may be enhanced by resupply of PS or oxygen during the light exposure. The
24
roles of light dose and PS concentration on the efficacy of photoinitiated polymerization should be
25
are governed a new concept of a volume efficacy (Ve), defined by the product of the crosslink (or
26
gelation) depth (CD) and local [efficacy].
27
Keywords: polymerization; modeling; kinetic; singlet oxygen; polymerization efficacy; crosslinking
28
29
1. Introduction
30
External stimuli such as such as pH, temperature, hydrophobicity, the presence of ions or
31
enzymes, and light-stimulation will cause the three-dimensional polymeric networks, called
32
hydrogels, to be physically or chemically linked for “gelation”, or crosslinking [1,2]. These processes
33
result in the increasing of polymer networks and viscosity of the medium, but decreasing solubility
34
of polymers. Physically-assembled gels are built with polymer networks tied via hydrogen bonds,
35
ionic interactions, hydrophobic associations, or agglomerations. Chemically-linked hydrogels are
36
commonly prepared via a three-dimensional polymerization using a water-soluble monomeric
37
polymer and a multi-functional cross-linker [2]. Photoinitiated polymerization and crosslinking
38
provide advantageous means over the thermal-initiated polymerization, including fast and
39
controllable reaction rates, spatial and temporal control over the formation of the material, and
40
without a need for high temperatures or pH conditions [1,2].
41
Photodynamic therapy (PDT) offers biometrical applications in dermatology, orthopedics
42
(tissue engineering), ophthalmology and cancer treatments in various parts of human body,
43
including early stage (micro-invasive) lung cancer, lung tumors (endobronchial, mesothelioma), skin,
44
brain, colorectal and breast cancer, chronic skin diseases (psoriasis, vitiligo), and oral cavity
(anti-45
bacterial, curing) [7-14]. Ophthalmology applications include age-related macular degeneration
46
(AMD), coagulation of retina and corneal crosslinking for keratoconus and ulcers [15-17].
47
The kinetics of photoinitiated polymerization systems (PPS) have been studied by many
48
researchers for uniform photoinitiator distribution or for the over simplified cases that the photolysis
49
product becomes completely transparent after polymerization or constant light intensity [18-23].
50
Kinetic modeling of PPS assumed either a constant light intensity (for thin polymers), or a
51
conventional Beer-Lambda law for the light intensity [13, 18-20]. For more realistic systems, the
52
distribution of the photoinitiator is non-uniform and the UV light may still be absorbed by the
53
photolysis product besides the absorption of the monomer. To improve the efficiency and spatial
54
uniformity (in the depth direction) particularly in a thick system (>1.0 cm), we have presented the
55
numerical results using a focused light [24] and two-beam approach [25] for the case of uniform PS
56
distribution; and analytic and computer modeling for the non-uniform case [26]. Optimal efficacy in
57
light-activated biomedical systems and nonlinear laws versus linear Beer-Lambert law were also
58
reported by Lin [27].
59
The kinetics and macroscopic modeling of PPS for anti-cancer have been reported by Zhu et al
60
[13] and Kim et al [14], which, however, are limited to the type-II oxygen-mediated process. Lin
61
reported the kinetic modeling for both type-I and type-II mechanism for the application in corneal
62
collagen crosslinking (CXL) [16,17,28], where the temporal and spatial profiles of PS concentration
63
and the CXL efficacy were also reported. Accelerated CXL has been clinically used for faster
64
procedure (within 3 to 10 minutes) using higher light intensity of 9 to 45 mW/cm2, in replacing the
65
conventional 3 mW/cm2 which took 30 minutes [29]. However, much less efforts have been done for
66
fast PPS in thick polymers using a high light intensity.
67
Photo-polymerization offers two major categories of biomedical applications: (a) photodynamic
68
therapy (PDT) using light-initiated oxygen free radical; and (b) crosslinking (or gelation) of
69
biomaterials using radical-substrate coupling for tissue engineering [1,2]. In general, both type-I and
70
type-II reactions can occur simultaneously, and the ratio between these processes depends on the
71
types and the concentrations of PS, substrate and oxygen, the kinetic rates involved in the process
72
[16,17]. Kim et al [14] have focused on the type-II oxygen-mediated process, whereas we have
73
previously focused on the non-oxygen-mediated type-I mechanism [27]. It is not yet fully understood,
74
theoretically or experimentally, the interaction between these two mechanisms.
75
In this study, we will further study the oxygen-mediated type-II mechanism, and compare the
76
significant different kinetics and efficacy of type-I and type-II by numerical simulations and analytic
77
formulas. Dynamic profiles of singlet-oxygen concentration, polymerization efficacy, and the cell
78
viability are produced by numerical solutions of macroscopic equations. Depending on the rate
79
constant, type-I and type-II mechanism may coexist to achieve a higher efficacy than type-II dominant
80
case, which is limited by the available oxygen. We will also explore the new strategy to enhance the
81
overall efficacy by resupply of PI or oxygen during the light exposure.
82
2.Methods and Modeling systems
83
2.1. Photochemical kinetics
84
The kinetics of corneal collagen crosslinking (CXL) shown by Fig. S-1 (shown in Supporting
85
Information) was previously reviewed by Lin [17] using UVA (365 nm) initiated riboflavin solution
86
as the sensitizer. Fig. 1 shows the 4 coupled dynamic equations defined as dI/dz, d[C]/dt, d[T]/dt and
87
d[O2]/dt, for, respectively, light intensity, PS concentration, triplet state, and oxygen molecular. The
88
three pathways are revised for a more general polymer system as shown in Fig. 1 and briefly
89
summarized as follows. In type-I pathway, the excited PS triple-state (T3) can interact directly with
90
the substrate (A); or with the ground state oxygen (O2) to generate a superoxide anion (O-), which
91
further reacts with oxygen to produce reactive oxygen species (ROS). In comparison, in type-II
92
pathway, T3 interacts with (O2) to form a reactive singlet oxygen (O*). In general, both type-I and
93
types and the concentrations of PS, substrate and oxygen, the kinetic rates involved in the process
95
[16].
96
97
98
Fig. 1 The kinetics of PDT, where [S0], [S1] and [T3] are the ground state, singlet excited state, and
99
triplet excited state of PS molecules. Three pathways are shown for both type-I and type-II process.
100
Ground state oxygen may couple to T3 to form either singlet oxygen [O*], or other reactive radicals
101
[O-]. In type-I pathway, T3 can interact directly with the collagen substrate (A); or with the oxygen
102
(O2) to generate a superoxide anion (O-); in type-II pathway, T3 interacts with the ground oxygen (O2)
103
to form a singlet oxygen (O*) [16].
104
These factors also influence the overall photopolymerization efficacy, particularly the PS triplet
105
state quantum yield (q) and its concentration. Furthermore, the specific protocols and the methods of
106
PS instillations prior to and during the photopolymerization also affect the short and long term
107
outcomes. The overall photopolymerization efficacy is proportional to the time integration of the light
108
intensity, I (z, t) and the PS and oxygen concentration, C (z, t), and [O2]. The efficacy reaches a
109
saturated (steady) state when C (z, t) or [O2] is depleted by the light, where higher intensity depletes
110
C (z, t) and [O2] faster and therefore reaches a lower steady-state efficacy [26,29].
111
Referring to the kinetic pathways shown by Fig. 1, a set of quasi steady-state macroscopic kinetic
112
equation for the PI ground-state, C (z, t), and the ground state oxygen molecule [O2] is constructed
113
[14,16]
114
∂C(z, t)
∂t = −𝑏[𝑔 + 𝑔′]C (1.a)
[ ]
= −s𝑏CG + P (1.b)
∂I(z, t)
∂z = −A′(z, t)I(z, t) (1.c)
A′(z, t) = 2.3[(a − b )C(z, t) + b C (z) + Q] (1.d)
where b=aqI (z, t); a=83.6wa’; w is the light wavelength; a’ and b’ are the molar extinction coefficient
115
of the initiator and the photolysis product, respectively; Q is the absorption coefficient of the
116
monomer and the polymer repeat unit. Typical values are [4,9]: a’=0.2 to 0.3 (1/mM/cm), b’=0.1 to 0.15
117
(1/mM/cm)), and C0= 1.0 to 3.0 mM; and for a UV light at 365 nm, a=0.00305a’ (1/cm).
118
For type-I, g=k8[A]G0/k3, G0=1/([O2] +k+K’); and for type-II, g’’=K’(C+d) G(z), with G(z)= [O2] G0,
119
k=(k5+k8[A])/k3; K’= k12/ (k6+ k12(C+d) + k72[A]); d is a low concentration correction related to the
120
diffusion of singlet oxygen [14]. [A] is the substrate concentration. q is the triplet state [T] quantum
121
yield given by q=k2/(k1+k2); s=s1+s2, with s1 and s2 are the fraction of [O2] converted to the singlet
oxygen and other ROS, respectively, in type-I and type-II [16]. All other rate constants, kj, kij are
123
defined by the reaction paths shown in Fig. 1.
124
In Eq. (1.b) we have included the light intensity in the polymer given by a time-dependent
Beer-125
Lambert law [27]. We have also included in Eq. (1.b) the oxygen source term P (z, t) =p(1-[O2]/[O0]),
126
with a rate constant p to count for the situation when there is an external continuing supply, or nature
127
replenishment (at a rate of p), besides the initial oxygen, [O0], in the polymer.
128
We note that Eq. (1) was also presented by Kim et al [14] for the anti-cancer kinetics. However,
129
they have assumed a constant UV intensity, i.e., A’ (z, t) is a constant in Eq. (1.d). They also ignored
130
the contribution from the type-I term, k8[A], since type-II is dominant in their anti-cancer process.
131
Most of the previous model have also ignored the dynamic of UV intensity given by Eq. (1.c) and the
132
depth-dependent profile of PI and light intensity [18-20]. Exact solutions of Eq. (1) require numerical
133
simulations. For analytic formulas, we will use an effective A (z, t) or its mean value, such that A’ (z,
134
t) becomes time-independent in solving Eq. (1). The effective absorption is given by [28], The effective
135
absorption is given by [28], A’=2.3x0.5(a’+b’) (1-0.25z/D) C0+Q.
136
2.2. Concentration Profile, Crosslink (or gelation) Time and Depth
137
In solving Eq. (1), we will choose initial profile (at t=0) I0(z)=I0(1-0.25z/D) for the light intensity;
138
and C0(z)=C0F(z), with F(z)=1-0.5z/D, for the PS concentration distribution; where D is the PS
139
concentration distribution depth; and when D>> 1.0 cm, F=1 representing a flat (or uniform) PS
140
distribution. Analytic solution of Eq. (1) is available for the type-I process and under certain
141
approximation. For g>>g’, or for the case that type-I is dominant over type-II, we obtain an
142
approximate solution, C (z, t) = C0F(z)exp(-bgt), assuming b and g are time-independent, or taking
143
their averaged value. A’ (z, t) in Eq. (1.d) has an initial value (A1, with b’=0) and steady state value
144
(A2, with C=0), given by: A1=2.3[a’C0F’+Q], and A2=2.3[b’C0F’+Q], with F’(z)=1-0.25z/D being the
145
integration of F(z) over z; the mean value is given by A=0.5(A1+A2). We have also developed
146
numerically fit value [9], A=2.3[mb’C0F + Q], with m=0.8 to 1.0 depending on the value of a’ and b’.
147
A crosslink (or gelation) time T* may be defined by when the PS concentration C (z, t=T*)
148
=C0(z)exp(-M), with M = 4, or C (z, t) is depleted to 0.018 of its initial value. We obtain an analytic
149
formula T*(z)=T0 exp(Az), where T0 is the surface depletion time given by T0=M/(bg), which is inverse
150
proportional to the light initial intensity, since b=aqI(z). T* may be also defined by the level of
151
photopolymerization efficacy, or the crosslink time (Tc), to be discussed later. The strong depletion
152
of C (z, t) will also affect the time-dependent profiles of the intensity, I (z, t), which in general, will
153
not follow the conventional Beer-Lambert law (BLL), and should be governed by a generalized,
time-154
dependent BLL first presented by Lin [27,28].
155
Another important parameter is called crosslink (or gelation) depth (z*) may be defined by the
156
depth having PS concentration C (z*, t=T*) reduced to a low value of C’ which typically is (1/e4, or
157
0.18%) of its initial value (at t=T*). Therefore, it is given by (for the case of flat distribution or F=1)
158
z*=(1/A)ln(bE0/M), with M=ln (C0/C’), which is proportional to the light fluence (or dose), E0. In
159
general, for F<1 (with D< 1.0 cm) and A is z-dependent, z* needs numerical calculation.
160
2.3. Efficacy Profiles
161
The normalized photo-polymerization efficacy defined by Ceff =1-[A]/[A]0 = 1-exp(-S), with
S-162
function for type-I (S1) and type-II (S2), and the overall efficacy is given by Ceff=1-exp[-(S1+S2)]. The
163
type-I efficacy may be further expressed by rate equation of conversion of collagen monomers [M] to
164
polymers, where the NOM term of Eq. (1.a), g=k8[A]G0/k3, is replaced by an overall rate constant (K)
165
including all polymerization chain reactions. The S functions are given by [13,16]
166
S = [ 𝑎𝑞𝑔K IC + (𝑓s 𝑎𝑞K′)I(z, t)G] dt (3.a)
S = 𝑓s aq𝐾 I(z, t)G dt (2.b)
for type-II.
167
The first term in Eq. (3.a) relates to the direct coupling of triplet state [T] with the substrate [A]
168
under hypoxic conditions or any other non-oxygen-mediated (NOM) reactions; and the second term
169
relates with the reactive oxygen species (ROS)-mediated reactions (in type-I). f is the fraction of all
170
ROS (including singlet oxygen) interacting with acceptors [A], or the oxygen-mediated (OM)
171
reactions in type-I and type-II. s2 and s1 are the fraction of [O2] interacting with [T] to produce singlet
172
oxygen (in type-II) and other ROS (in type-I), respectively.
173
2.4. Analytic formulas
174
For analytic formulas, we will use the mean value of A(z) such that I (z, t) =I0exp(-Az), and C (z,
175
t) = C0Fexp(-Bt), with B=bg=aqgI(z), Eq. (3.a), for the case that g’<<g, the type-I, S- function is given by
176
[16,28]
177
𝑆 = 4𝐾𝐶𝑜𝐹exp (𝐴𝑧)/(𝑎𝑞𝑔𝐼𝑜) 𝐸1 (4.a)
𝐸1 = [1 − exp(−0.5𝐵𝑡)] (3.b)
which is a nonlinear function of the light dose (E) given by its Taylor expansion 𝑆 =
178
(𝑎𝑞𝐼𝑜𝐾𝐶𝑜𝐹) exp (−𝐴𝑧) 𝑡[1 − 0.5𝑎𝑞𝑔𝐸 + ⋯ ], which follows Bunsen–Roscoe reciprocal law (BRL)
179
only for small time with the first term kept. In contrast, type-II efficacy, given by the time integral of
180
[IC] follows the BRL [26]. A crosslink time (T) may be defined by Eq. (4.b) when E1=0.87, or 0.5BTc=2,
181
which gives us Tc=4/B=4/(bg)= [4/(aqgI0)] exp(Az) = T0 exp(Az), with the surface crosslink time given
182
by T0=4/(aqgI0) =1000/I0, for aqg=0.004. We note that the crosslink time equals to the depletion time
183
(T*), when M=4, and it also defines the gelation time, or crossover time.
184
Type-II process is much more complex than type-I and requires numerical solutions to be shown
185
later. For analytic results for type-II dominant case (with g’>>g), we assume an approximated oxygen
186
concentration given by [O2] = [O0] – m’btC0, with m’ being a fit parameter; and the similar functional
187
forms for C(z,t) and I(z,t) as type-I, the time integral of Eq. (3.b) gives us, for k<< [O0] and P=0,
188
189
S = (𝑓𝑠𝑎𝑔)I′(z)𝐶 [(1 − k/[O ])(E1 + 𝑑t) − HO
190
(5)
191
192
with I’(z)=0.5(I1+I2) =0.5I0 exp(-A’z), is a mean light intensity, and HO is a high-order term. Eq. (5)
193
shows that the type-II efficacy is an increasing function of I0Co[O0]; and S2 has a transient state (with
194
E1= t) proportional to the light dose, I0t; and steady-state is only dose-dependent (for the case of P=0)
195
to be justified numerically later.
196
2.5. Nonlinear scaling law
197
As predicted by our S1 formula, the efficacy at transient state (for small dose) is proportional to
198
tI00.5, however, at steady-state, it is a nonlinear increasing function of [C0/I0] 0.5 or [t/E0]0.5. This nonlinear
199
scaling law predicts the clinical data more accurate than the linear theory of Bunsen Roscoe law (BRL)
200
[26]. Accelerated PPS based on BRL, therefore, has undervalued the exposure time (t) for higher
201
intensity using the linear scaling of t = [ E0 /I0], rather than t = [ E0 /I0]0.5, based on our nonlinear law.
202
To achieve the same efficacy, higher PS concentration requires higher light intensity; and for the same
203
dose, higher light intensity requires a longer exposure time.
204
The BRL is based on the conventional Beer-Lambert law for light intensity without PS depletion,
205
such that I(z) is time-independent, and C(z,t)=constant=C0F, therefore, S =
206
4KCoFEo exp (Az) which is a linear function of the dose E0 = (tI).
207
Our nonlinear law, as shown by Eq. (4) predicts that, for the same dose, higher intensity depletes
208
the PS concentration faster and reach a lower steady-state efficacy. Further discussion will be shown
209
higher efficacy as shown by the PS distribution function, F(z)=1-0.5z/D, which is an increasing
211
function of D, and F=1.0 for the flat (uniform) distribution case. The above features have been
212
clinically shown in corneal crosslinking [26], but not yet for other PPS.
213
2.6. Volume efficacy
214
The new concept of a volume efficacy (Ve), first introduced by Lin [30], is defined by the product
215
of the crosslink (or gelation) depth (CD) and local [efficacy], or Ve=z[1-exp(-S)], where z is the
216
polymerization (or crosslink) depth (PD) given by z=(1/A)ln(b’/E0), with b’=b/M, and E0 is the light
217
dose. For a type-II process, the local (at a specific depth z) efficacy is defined by Eff-=1-exp(-S), with
218
S function is given by Eq. (3). For a polymer thickness of z0, the normalized Ve is given by V’=Ve/z0.
219
For type-II application of anti-cancer for a cell sample thickness of z0, the cell viability (normalized
220
by z0) is given by CV=1-Ve/z0. We should note that both CD and S are increasing function of the light
221
dose, however, they are competing functions with respective to the PS concentration. Higher C0 offers
222
higher S (or local efficacy) but it has a smaller depth (due to the larger absorption, or larger A-value).
223
The general feature of Ve may be stated as follows: increasing light dose (for a fixed C0) offers both
224
higher [local efficacy] and [depth], and Ve; however, increasing C0 (for a fixed light dose) suffers a
225
shallow depth, although the [local efficacy] increases. Therefore, there is an optimal C0 for maximum
226
Ve. Numerical results and application for cell viability in anti-cancer and corneal crosslinking will be
227
presented elsewhere.
228
3.Results and Discussions
229
3.1. Concentration profiles
230
Numerical results of Eq. (1) are shown in Fig. 3 for the PS concentration dynamic profiles, for a
231
type-I dominant case, with g’<<g in Eq. (1.a). One may see that depletion of PS starts from the polymer
232
surface, and gradually into the volume (z>0). We note that the PS concentration profile is an
233
increasing function of z for the uniform case. In contrast, the non-uniform case shows a decreasing
234
function of z.
235
3.2. Efficacy profiles
236
Using typical values of: a’=0.2(1/mM/cm), b’=0.1(1/mM/cm), Q=0.1 (1/cm), q=0.5, aqg=0.012
237
cm2/mW; the mean A(z)=0.35C0F(z)+0.23, B=(0.006I0) exp(-Az)., with C0 in mM, I0 in mW/cm2. Eq. (4)
238
gives a normalized S-function defined by S=S1/S0, where S0=[4K/(aqg)]0.5 is a proportional constant,
239
such that 𝑆 = 𝐸1 (𝐶𝑜𝐹/𝐼𝑜 )exp (𝐴𝑧) .
240
In the follow figures, we will show the normalized S-function for S0=4, or K/(aqg)=4. In addition, the
241
transient factor E1 is based on aqg=0.012, or B=(aqg)I(z)=0.012I(z), and K=4(aqg)=0.048.
242
F
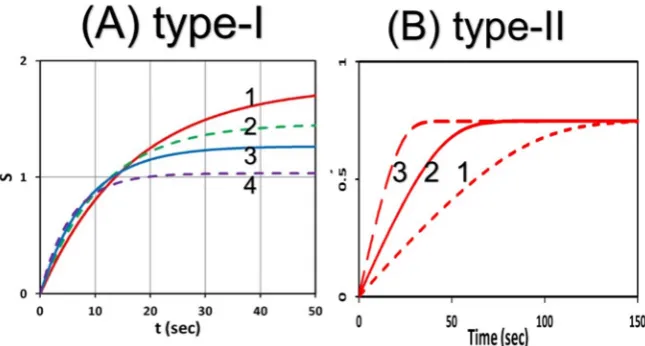
ig. 2 compares the efficacy S-function profiles for: (A) type-I, and (B) type-II, for various light243
intensity, I0 = (9,18,30,45) mW/cm2, for curves (1,2,3,4). The important features demonstrated by Fig.
244
4 and 5 are summarized as follows:
245
(i) For the same dose, lower light intensity achieves a higher steady-state-efficacy (SSE) in
type-246
I, as also shown by Eq. (4); in contrast to type-II, which has an equal SSE, as also shown by
247
Eq. (5).
248
(ii) In both type-I and type-II, higher light intensity has a faster rising efficacy, due to faster
249
depletion of PS concentration. However, type-II process is also affected by the available
250
oxygen. Higher light intensity produces more efficient singlet oxygen, resulting a higher
251
transient efficacy, as shown by Fig. 4-(B), in which all intensities reach the same SSE when
252
oxygen is completely depleted, as shown by Fig. 4-(B).
253
(iii) As shown by Fig. S-2 (shown in Supporting Information), for the same dose, lower light
254
only by the light dose (for the case of no external oxygen); i.e., same dose achieves same
256
efficacy. Moreover, type-II has an efficacy follows BRL, whereas type-I follows non-BRL
257
[27,17]. These numerical results are also predicted by our analytic formulas, Eq. (4) and (5).
258
259
F
ig. 2 Comparing the efficacy S-function temporal profiles for: (A) type-I, and (B) type-II, for various260
light intensity, I0 = (9,18,30,45) mW/cm2, for curves (1,2,3,4).
261
As shown by S-formulas, Eq. (5), for the anti-cancer type-II PDT efficacy S~ [O2]C, which requires
262
both PS concentration C and [O2]. Therefore, resupply of PS or oxygen would enhance the generation
263
of singlet oxygen radicals, and improve the anti-cancer efficacy via type-II PDT. Resupply of PS or
264
oxygen during the light exposure would enhance the overall efficacy; this new strategy has been
265
proposed in type-I corneal crosslinking [13], but not yet in gelation of thick polymers. These
266
theoretically predicted features have been only partially proven clinically for corneal crosslinking
267
[27]. Therefore, further experimental studies are highly desired in polymer systems.
268
3.3. Analysis of experiments
269
Our formula, Eq. (4), predicts that the type-I steady-state-S is proportional to the square-root of
270
the PS concentration (C0). Therefore, the crosslink efficacy, defined by Eff=1-exp(-S), is also an
271
increasing function of C0. This feature has been clinically reported by O’Brart et al in corneal
272
crosslinking [30], where the PS is riboflavin solution initiated by a UVA light at 365 nm. The role of
273
PS concentration was also shown by Table 1 of Holmes et al [31], where (for LAP) increasing the PS
274
concentration from 0.1% to 0.5% (w/v) in the thiol-ene mixture resulted in a 15-fold increase in the
275
storage modulus. This increasing feature may be analyzed by our S-function, Eq. (4), given by a
276
steady-state formula S’=S0 [C0 exp(Az)]0.5. For C0 increase five times, and for Az=0.9, we calculate
S-277
function increases a factor of 2.23x exp(2Az) =14.5, which is comparable to the increase of storage
278
modulus; noting that when C0 is 5 times, A is also 5 times, given by A=2.3mb’C0F(z) + Q, if Q<<0.1
279
(1/cm).
280
Fig. 3 of Holems et la [31] shows the gelation kinetic profiles which has a strong similarity as our
281
Fig. 2 (red curve). The storage modulus was found to increase with time and UV exposure until a
282
plateau was reached within 300 s, indicating no further elastic properties (complete chemical gel).
283
The plateau-time corresponds to our crosslink time (T*) defined before. Similarly, the measured data
284
of Shih et al [11] (in their Fig. 1) showed crosslinking of thiol-norbornene PEG- peptide hydrogels
285
(initiated by a visible light). Also has a strong similarity as our Fig. 2 (red curve), except the time scale
286
which depends on the types of PS and light used in the process. Unfortunately, Shih et al [11] and
287
Holems et al [31] did not measure the profiles for different light intensity, as shown in our Fig. 2, to
288
justify our predicted feature that higher light intensity is less efficient in gelation. However, our
289
Anti-cancer via oxygen-mediated type-II mechanism has been clinically studied [32,33], where
291
the cytotoxic effect of photodynamic therapy (PDT) to tumor tissue is resulted by the generation of
292
singlet oxygen. Efficacy of PDT is mainly influenced by: the concentration of PS drug accumulated
293
into the cells, molecular oxygen in tissue, the light dose, intensity and dose (fluence) [34]. High
294
concentrations of singlet oxygen can lead to necrotic cell death. In contrast, low concentrations lead
295
to cell survival and increase the metabolism; whereas medium singlet oxygen concentrations lead to
296
initiation of apoptosis or autophagy [32]. Therefore, the threshold light dose and singlet oxygen dose
297
play the important role in PDT for anti-cancer. The singlet oxygen threshold dose, and the
dose-298
dependence cell viability curves of human cancer cells of K562 and Hela after red-light irradiation of
299
Radachlorin were reported in vivo by Klimenko et al [32]. They showed that the cell viability, defined
300
by CV=exp(-S), is lower for higher C0 and/or light intensity (I0). Moreover, with p>o, external oxygen
301
offers lower CV, or better cell killing. The threshold dose E*=I0t* (or time t* for a fixed light intensity)
302
to reach a cell viability CV*<25%, is higher for smaller C0 and/or I0. These features are in consistent
303
with our numerical results for type-II PDT to be shown later.
304
Above examples demonstrate that our formulas predict very well the measured results, at last
305
the overall trends. However, the accuracy of our formulas will require accurate measurement of the
306
parameters involved, such as the rate constant (K), the quantum yield (q), the molar extinction
307
coefficient of the initiator (a’), the photolysis product (b’), and the monomer and the polymer repeat
308
unit (Q) et al. In addition, further experimental measurements should also include the roles of PS
309
concentration and light intensity. Our group has also worked on the in vitro measurement of cell
310
viability, which may be empirically analyzed by our formulas, and results will be published
311
elsewhere.
312
3.4. The role of oxygen
313
By solving the kinetic coupled Eq. (1) for oxygen, we have previously developed a schematic for
314
type-I and type-II mechanisms in CXL, which has a very short oxygen depletion time (t*)
315
approximately 10 to 30 seconds [16,17]. For thick polymer system, t* has a wide range of 50 to 500
316
seconds, depending on the PI, light intensity and kinetic rate constants. For example, in anti-cancer
317
process, t* is few minutes and type-II process is predominant [14], whereas in CXL (with t*< 20
318
seconds), type-I is predominant. Therefore, we re-plot a schematic shown in Fig. 3 for a more general
319
PPS without specifying t*. In the transient stage (with t<t*), both type-I and –II coexist until the oxygen
320
is completely depleted; then type-I dominates before the oxygen is resupplied or replenished. In
321
general, both type-I and type-II reactions can occur simultaneously, and the ratio between these
322
processes depends on the types and the concentrations of PS, substrate and oxygen, and the kinetic
323
rates involved in the process [17].
324
325
Fig. 3 Schematics of the oxygen profiles during the photocrosslinking process; in the transient stage,
326
both type-I and –II coexist until the oxygen is depleted. (Figure revised from previous schematics
327
[17]).
328
3.5. Numerical results
330
We will now explore the roles of each of the parameters involved in type-I and type-II
331
mechanisms, where the macroscopic coupled Eq. (1) will be numerically solved for various
332
parameters of: initial values, C0, I0, [O0], [A]; rate constants k’=k8/k3, k=(k5+k8[A])/k3, K’, small signal
333
d, and the oxygen source term (p). The S functions defined by Eq. (2) will then calculated to obtain
334
the associate singlet-oxygen concentration, efficacy, Eff=1-exp(-S), and the cell viability,
CV=exp[-335
(S1+S2)]. Typical values are used in our calculations [13,14]: fixed [O0] =7.3(uM), k=11.9(uM), d= 33
336
(uM); and others will have ranges to show their roles: I0= (50,100,200) mW/cm2, C0= (6,8.5,10) uM, [A]=
337
(50,100) uM, k’= (0.0001, 0.05) 1/s. Above various parameters allow us to investigate the roles of [A],
338
I0, C0, the interaction of type-I and type-II (via k’) and the oxygen source term (p).
339
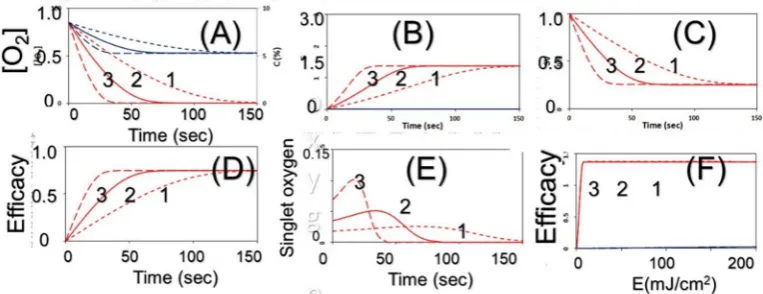
Fig. 4 shows the calculated temporal profiles of: (A) oxygen (red curves) and PS concentration
340
(blue curves), (B) S2-function, (C) cell viability, (D) efficacy vs. time, (E) singlet-oxygen, and (F)
341
efficacy vs. light dose (E0) for a small [A]=50 uM and k’ value (0.0001), or type-II is dominant, whereas
342
Fig. S-3 (in Supporting Information) shows the profiles for a higher [A]=100 uM which leads to a lower
343
efficacy. Fig. S-4 (in Supporting Information) shows profiles with external oxygen supply, or P>0,
344
where the type-II efficacy increases due to the resupply of oxygen, comparing Fig. (D) of Fig.4 and
345
Fig.S-4. The role of substrate [A] is shown by Fig. S-5 (in Supporting Information) that higher [A]=100
346
uM has a lower type-II efficacy, but higher type-I efficacy. Fig. S-6 (in Supporting Information) shows
347
the comparison of type-II S-profiles for the case without (p=0), and with external oxygen (p>0). We
348
note that the efficacy is governed by the light dose only when p=0 and independent to light intensity;
349
in contrast to p>0, which also shows the intensity-dependence for the transient state.
350
In contrast to Fig. 4 with a small k’=0.0001 (for type-II dominant), Fig. 5 shows profiles for a
351
higher k’=0.05, in which type-I and type-II coexist. Comparing to Fig. 4(A), Fig. 5(A) shows more
352
depletion of PS concentration, C (z, t), due to the combined type-I and type-II, which also shows
353
higher efficacy and lower cell viability, as shown by Fig. (C) and (D). We note that, as shown by Fig.
354
5 (B) and (F), S2 reaches its steady state, when oxygen is completely depleted; in contrast, S1, is an
355
increasing function of PS concentration and does not require oxygen.
356
The singlet oxygen threshold dose, and the dose-dependence cell viability curves after red-light
357
irradiation of Radachlorin were reported in vivo by Klimenko et al [32], in which their Fig. 5 may be
358
compared with our Fig. (C) of Fig. S-4 (in Supporting Information). Our group has also worked on
359
the in vitro measurement of cell viability, which may be empirically analyzed by our numerical data
360
(results will be published elsewhere). Resupply of PS or oxygen during the light exposure would
361
enhance the overall efficacy. This new strategy has been proposed in type-I corneal crosslinking by
362
Lin [29] and type-II anti-cancer by Lin et al [35].
363
364
Fig. 4 The calculated temporal profiles of: (A) oxygen (red curves) and PS concentration (blue curves),
365
(B) S2-function, (C) cell viability, (D) efficacy vs. time, (E) singlet-oxygen, and (F) efficacy vs. light dose
366
(E0), for various light intensity of 50, 100, 200 mW/cm2, (for curves 1,2,3), without external oxygen
367
369
Fig. 5 Same as Fig. 4, but for a higher k’=0.05 and with external oxygen source (p=0.15), in which
type-370
I and type-II coexist. Fig (B) and (F) show both S1 (blue curves) and S2 (red curves).
371
4. Conclusion
372
For the same dose, lower light intensity achieves a higher steady-state-efficacy (SSE) in type-I;
373
in contrast to type-II, which has an equal SSE. Type-II process is also affected by the available oxygen.
374
Higher light intensity produces more efficient singlet oxygen, resulting a higher transient efficacy, in
375
which all intensities reach the same SSE when oxygen is completely depleted. With external oxygen,
376
type-II efficacy increases with time, otherwise, it is governed only by the light dose, i.e., same dose
377
achieves same efficacy. Moreover, type-II has an efficacy follows Bunsen Roscoe law (BRL), whereas
378
type-I follows non-BRL. The photopolymerization dynamics may be defined by the availability of
379
oxygen, where both type-I and –II coexist until the oxygen is depleted. The roles of light dose and PS
380
concentration on the efficacy should be governed a new concept of a volume efficacy (Ve), first
381
introduced by Lin [30], defined by the product of the crosslink (or gelation) depth (CD) and local
382
[efficacy].
383
Acknowledgments: This work was supported by the internal grant of New Vision Inc. KT Chen is partially
384
supported by the Ph. D program of Graduate Institute of Applied Science and Engineering, Fu Jen Catholic
385
University, Taiwan.
386
Author Contributions: Conceptualization, Jui-Teng Lin; Data curation, Jui-Teng Lin and Da-Chuan Cheng;
387
Formal analysis, Jui-Teng Lin; Funding acquisition, Hsia-Wei Liu and Da-Chuan Cheng; Methodology, Jui-Teng
388
Lin; Project administration, Hsia-Wei Liu; Software, Kuo-Ti Chen and Da-Chuan Cheng; Supervision, Jui-Teng
389
Lin.
390
Conflicts of Interest: Jui-Teng Lin is the CEO of New Vision Inc.
391
References
392
1. Fouassier J-P. Photoinitiation, Photo-polymerization, and Photocuring: Fundamentals and Applications.
393
1995, Hanser Gardner Publications Munich.
394
2. Anseth KS, Klok HA. Click chemistry in biomaterials, nanomedicine, and drug delivery.
395
Biomacromolecules, 2016; 17:1–3.
396
3. Chen FM, Shi S. Principles of Tissue Engineering, 4th ed.; 2014, Elsevier: New York, NY, USA.
397
4. Drury JL, Mooney DJ. Hydrogels for tissue engineering: scaffold design variables and applications.
398
Biomaterials 2003, 24, 4337–4351.
399
5. Pereira R, Bartolo P. Photopolymerizable hydrogels in regerative medicine and drug delivery. Top.
400
Biomater. 2014, 6–28.
401
6. Chen MC, Garber L, Smoak M et al. In vitro and in vivo characterization of pentaerythritol
triacrylate-co-402
trimethylolpropane nanocomposite scaffolds as potential bone augments and crafts. Tissu Eng. Part A 2015,
403
21, 320–331.
404
7. Chatani S, Gong T, Earle BA, Podgórski M, Bowman CN. Visible-light initiated thiol-Michael addition
405
photopolymerization reactions. ACS Macro Lett. 2014; 3(4):315–318.
406
for osteochondral tissue engineering Scientific Report, 2014, 4457, DOI: 10.1038/srep04457.
408
9. Zhang X, Xi W, Wang C, Podgórski M, Bowman CN. Visible-light-initiated thiol-Michael addition
409
polymerizations with Coumarin-based photobase generators: another photoclick reaction strategy. ACS
410
Macro Lett. 2016; 5:229–233.
411
10. Xi W, Peng H, Aguirre-Soto A, Kloxin CJ, Stansbury JW, Bowman CN. Spatial and temporal control of
412
thiol-Michael addition via photocaged superbase in photopatterning and two-stage polymer network
413
formation. Macromolecules. 2014; 47(18):6159–6165.
414
11. Shih H, Liu, HY, Lin CC. Improving gelation efficiency and cytocompatibility of visible light polymerized
415
thiol-norbornene hydrogels via addition of soluble tyrosine. Biomater. Sci. 2017, 5:589–599.
416
12. Fairbanks BD, Schwartz MP, Bowman CN, Anseth KS. Photoinitiated polymerization of PEG-diacrylate
417
with lithium phenyl-2,4,6-trimethylbenzoylphosphinate: Polymerization rate and cytocompatibility.
418
Biomaterials. 2009, 30:6702–6707.
419
13. Zhu TC, Finlay JC, Zhou X, et al. Macroscopic modeling of the singlet oxygen production during PDT. Proc
420
SPIE. 2007; 6427:6427O81–6427O812.
421
14. Kim MM, Ghogare AA, Greer A, Zhu TC et al. On the in vivo photochemical rate parameters for PDT
422
reactive oxygen species modeling. Phys. Med. Biol. 2017, 62, R1–R48.
423
15. O’Brart NAL, O’Brart DPS, Aldahlawi et al, An Investigation of the effects of riboflavin concentration on
424
the efficacy of corneal cross-Linking using an enzymatic resistance model in porcine corneas. Invest.
425
Ophthalmol Vis Sci. 2018; 59: 1058-1065. doi:10.1167/iovs.17-22994.
426
16. Lin JT. Efficacy S-formula and kinetics of oxygen-mediated (type-II) and non-oxygen-mediated (type-I)
427
corneal cross-linking. Ophthalmology Research. 2018; 8(1): 1-11.
428
17. Lin JT. A Critical Review on the Kinetics, Efficacy, Safety, Nonlinear Law and Optimal Protocols of Corneal
429
Cross-linking. J Ophthalmology & Visual Neuroscinece, 2018; 3:017.
430
18. Terrones G, Pearlstein AJ. Effects of optical attenuation and consumption of a photobleaching initiator on
431
local initiation rates in photopolymerizations. Macromolecules. 2001, 34: 3195–3204.
432
19. Kenning NS, Kriks D, El-Maazawi M, Scranton A. Spatial and temporal evolution of the photo initiation
433
rate for thick polymer systems illuminated on both sides. Polym Int. 2005, 54: 1429–1439.
434
20. Miller GA, Gou L, Narayanan V, Scranton AB. Modeling of photobleaching for the photoinitiation of thick
435
polymerization systems. J Polym Sci Part A Polym Chem 2002;40(6):793–808.
436
21. Okay O, Bowman CN. Kinetic modeling of thiol-ene reactions with both step and chain growth aspects.
437
Macromol. Theory Simul. 2005; 14:267–277.
438
22. Reddy SK, Cramer NB, Kalvaitas M, Lee TY, Bowman CN. Mechanistic modelling and network properties
439
of ternary thiol-vinyl photopolymerizations. Aust. J. Chem. 2006; 59(8):586–593.
440
23. Claudino M, Zhang X, Alim MD et al. Mechanistic kinetic modeling of Thiol–Michael addition
441
photopolymerizations via photocaged “superbase” generators: An analytical approach. Macromolecules.
442
2016; 49(21): 8061–8074. doi:10.1021/acs.macromol.6b01605.
443
24. Lin JT, Liu HW. Cheng DC. Optimal focusing and scaling law for uniform photo-polymerization in a thick
444
medium using a focused UV Laser. Polymers. 2014, 6:552-564. doi:10.3390/polym6020552.
445
25. Lin JT, Liu HW. Cheng DC. Modeling the kinetics of enhanced photo-polymerization under a collimated
446
and a reflecting focused UV laser. Polymers. 2014, 6: 1489-1501.
447
26. Lin JT, KC Wang. Analytic formulas and numerical simulations for the dynamics of thick and non-uniform
448
polymerization by a UV light. J Polym Res. 2016, 23: 53; DOI 10.1007/s10965-016-0934-4.
449
27. Lin JT. Optimal efficacy in light-activated biomedical systems and nonlinear laws versus linear
Beer-450
Lambert law and Bunsen- Roscoe reciprocal law. Op Acc J Bio Eng & Biosc 1(5)- 2018.
451
OAJBEA.MS.ID.000123.
452
28. Lin JT, Cheng DC. Modeling the efficacy profiles of UV-light activated corneal collagen crosslinking. PloS
453
One. 2017;12:e0175002. DOI:10.1371/journal.pone.0175002.
454
29. Lin JT. A proposed concentration-controlled new protocol for optimal corneal crosslinking efficacy in the
455
anterior stroma. Invest. Ophthalmol Vis Sci. 2018;59:431–432.
456
30. Lin JT. The role of stroma riboflavin concentration in the efficacy and depth of corneal crosslinking. Invest.
457
Ophthalmol Vis Sci. 2018; 59:4449-4450.
458
31. Holmes R, Yang XB, Dunne et al, Thiol-Ene Photo-Click Collagen-PEG Hydrogels: Impact of Water-Soluble
459
Photoinitiators on Cell Viability, Gelation Kinetics and Rheological Properties. Polymers 2017, 9, 226;
460
32. Zhu TC, Kim MM, Liang X et al. In-vivo singlet oxygen threshold doses for PDT. Photonics Lasers Med,
462
2015: 4:59-71.
463
33. Klimenko VV, Shmakov SV, Kaydanov et al. In vitro singlet oxygen threshold dose at PDT with
464
Radachlorin photosensitizer. 2017; SPIE Proc. Vol. 10417.
465
34. Lin JT. Advances of cancer synergic photo-therapy: kinetics and efficacy. Nov Appro in Can Study. 2018;
466
2(1). NACS.000529.2018. DOI: 10.31031/NACS.2018.02.000529.
467
35. Lin JT, Chen KT, Liu HW. Analysis the role of oxygen, light intensity, threshold dose and efficacy
468
improvement of anti-cancer via type-II photodynamic therapy. Nov Appro in Can Study. 2018; 2(1).