Plant
Induced
Soil Salinity
Patterns
in
Two Saltbush
(Atriplex
spp.)Communities
M. L. SHARMA AND D. J. TONGWAY
Highlight: A detailed examination was made into the soil the arid and semi-arid regions of Australia (Leigh and Noble, salinity distribution of two Atriplex communities, A. vesicaria
and A. nummularia, established at regular spacings on two soil 1969) and other parts of the arid world. They are tolerant to types. The results based on total soluble salts and chlorides drought and salinity and have high salt content in their leaves suggested that both saltbush species induced significantly (Wood, 1925; Beadle et al., 1957). Our own studies (Sharma et higher salinity in the 0- 15 cm soil horizon beneath the bush al. unpublished) on oldman saltbush (A. nummularia) and canopies compared to between the bushes, although A. num- bladder saltbush (A. vesicaria) have indicated the extremely mularia induced significantly higher salinity than A. vesicaria high salt concentration in their leaves and its fluctuation with on both the soils. The pH was also significantly increased under the season. The leaves of these and similar plants, after falling the bushes, but only for the 0- 7.5 cm layer.
A mechanism for plant-induced soil salinity is proposed by which distinct zones of salt depletion, accumulation and com- pensation are established. It is suggested that the accumulation of significantly large quantities of salt in the surface layer under the bushes occurred as a result of decomposition of large quantities of salt-rich leaves and fruits. This salt is mainly derived from the soil profile under the plant. Implications of the spatial variability in soil salinity are discussed.
to the ground, are likely to increase the salinity of soil beneath the plant (Jessup, 1969). Other arid plants, such as greasewood
(Sarcobatum vermiculatum), shadscale (Atriplex confertifolia), and sagebrush (Artemisia tridentata), have also been reported to be directly responsible for changing the chemical properties of soil beneath the plant (Roberts, 1950; Fireman and Hayward, 1952). However, these studies have been of an observational type in naturally occurring, irregularly distrib- uted plant communities; and for this reason, critical interpreta-
In understanding drylands, interest in soil-site relationships tion of salt distribution has not been possible. The purpose of centers on the soil as one of the environmental factors the present study was to investigate such plant induced soil important in determining species composition and plant variability in terms of soil salinity and related properties in growth. Soils and vegetation do not exist as independent two regularly spaced, semi-arid saltbush communities.
components of the ecosystem, but rather each plays an important role in determining the character of the other. Some plants exert a pronounced influence on soil properties, and this influence must be appreicated and evaluated if a better understanding of the dryland ecosystem is to be accomplished.
Various species of Atriplex occupy a considerable area in
The authors are with the Rangelands Research Unit, Riverina Labo- ratory, Commonwealth Scientific and Industrial Research Organization, Deniliquin, N.S.W. 2710, Australia.
The authors gratefully acknowledge the technical assistance of Mr. J. Tunny. They also wish to thank Dr. J. H. Leigh and Mr. W. Mulham, who established the saltbush plantations.
Manuscript received February 22, 1972.
Methods and Material
Climate, vegetation and soils
The experimental site is located at the Falkiner Memorial Field Station, about 24 km north of Deniliquin (35O 30’S altitude 100 m) in southwest New South Wales.‘The climate of the area is semi-arid with an average annual precipitation of 380 mm and potential evaporation of 1,550 mm. Most of the effective rain is received during winter, with few summer storms. Table 1 summarizes some of the climatological data at the site for the experimental period.
In the present study, established plantations of A. nummu- laria and A. vesicaria growing side by side on two types of soils
Table 1. Monthly rainfall (mm), evaporation (mm) (U. S. Class A pan), and minimum and maximum temperatures (‘C) at the experimental site.
TemDerature Date
_
Rainfall Evaporation Minimum Maximum 1969
1970
June 9.6 41.4 2.1 12.2
July 34.3 42.2 3.9 14.7
August 29.2 74.2 2.2 16.7
September 22.1 90.2 3.9 16.1
October 20.6 181.1 8.4 23.9
November 23.4 231.6 10.5 21.6
December 8.9 315.2 11.4 27.8
January 73.9 271.5 15.6 29.2
February 15.0 283.5 16.4 33.1
March 43.4 184.4 12.6 26.3
April 75.7 118.6 10.5 23.1
May 12.7 62.2 6.5 17.4
June 35.3 33.3 3.9 12.6
were used. The Atriplex had been planted at regular spacings on soils which had not previously, at least in recent years (>lOO), carried these plants. Therefore, the observed salinity patterns in these communities can be attributed to the presence of these plants. The important plant factors which might affect salt distribution appear to be age and size of plants, distance between plants, intervening vegetation type, etc. These features for the plants of the experimental communities are summarized in Table 2.
On the Riverine Plain, saltbush communities occur natu- rally on a group of soils known as grey, brown, and red clays. Two important members of this group, Billabong and Riverina clay, supported the plant communities of the present study. The landscape of both soils is flat with an average grade of
1: 1500. Some features of the soils are given below:
Billabong clay-An A horizon of loam to clay loam about 5 cm deep, diffusing into a light clay and then to dark brown heavy clay. Traces of calcium carbonate occur at about 30 cm and a mixture of calcium carbonate and crystalline gypsum at about 45-50 cm.
Riverina Clay-An A horizon of brownish silty clay loam, about l-2 cm deep, abruptly changing into dark grey heavy clay. Traces of calcium carbonate and crystalline gypsum occur at about 45 cm. This soil exhibits more shrinking and swelling properties and micro-gilgai surface patterns than Billabong clay.
Experimental procedure
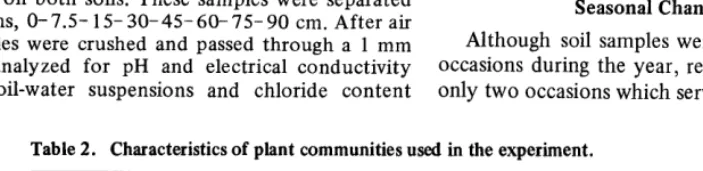
On each of five occasions during the year 1969- 1970, seven paired soil core samples were collected from two positions: under the bush canopies (U), and between bushes (B) from each community on both soils. These samples were separated into profile depths, 0- 7.5- 1 S- 30-45- 60- 75- 90 cm. After air drying, the samples were crushed and passed through a 1 mm sieve and then analyzed for pH and electrical conductivity (EC5) in 1:5 soil-water suspensions and chloride content
determined by the titration method using silver nitrate (U.S. Salinity Laboratory Staff, 1954).
In order to examine the distribution of salts in the profile with respect to distance from plant and profile depth, in March 1970 seven transects were sampled in the A. nummu-
Zaria community on Billabong clay. Seven profile samples were collected along each transect between two plants, spaced 3 m apart. The sample nearest to each plant was 0.3 m from the plant, while subsequent samples were 0.4 m apart from each other. These samples were analyzed for chloride.
Results
Spatial Pattern of Variation in Salinity
Average EC5 data based on soil samples (seven samples from each U and B position) collected in March 1970 are presented in Table 3. These results indicate that (1) there was a significantly higher salt concentration down to 15 cm depth at U compared with B position for both species on both soils; (2) invariable the soil salinity of the surface layer under A.
nummularia was significantly higher than under A. vesicaria;
(3) there were no significant differences at position B for the two communities in both soils, although there was slightly higher salinity at this position in A. nummularia; (4) at depths below 45 cm, generally there was higher salinity at B compared to U positions, particularly in A. vesicaria. These differences were not always statistically significant. (5) Salinity associated with each plant species were similar on both soils.
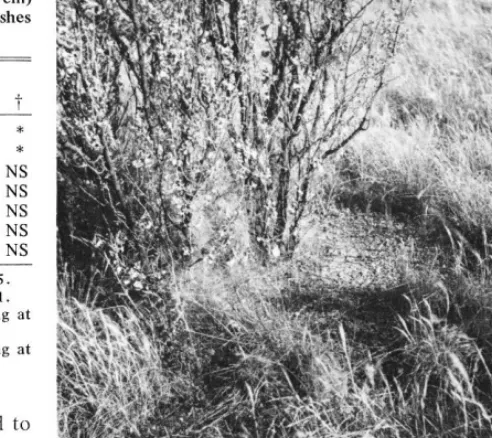
The chloride contents of soils, in general, followed the EC5 trends. This is illustrated by Figure 1 showing the average chloride concentration in the Billabong clay profile. These determinations were made on the same samples as were used for EC5 measurements of Table 3. Again, similar conclusions can be drawn. This indicates that the salts are predominantly chlorides of various cations.
The spatial variability among replicates was higher in EC5 than in chloride, particularly at depths below 30 cm where gypsum and calcium carbonate start appearing. Therefore, it is felt that chloride content would be a better indicator of salinity level than EC5 .
The pH was significantly higher at U compared with B positions in both communities and on both soils, but only for the surface (O-7.5 cm) layer; otherwise it remained relatively unchanged. For example, in March the pH values of O-7.5 cm Billabong clay at B and U positions in A. nummularia were 6.56 and 7.12, and in A. vesicaria 6.68 and 7.10 respectively. The corresponding pH values of Riverina clay in A. nummu-
Zaria were 6.56 and 6.85 and in A. vesicaria, 6.32 and 6.62.
Seasonal Changes in Soil Salinity
Although soil samples were collected and analyzed on five occasions during the year, results are presented in Table 4 for only two occasions which serve to illustrate the extremes. As is
Table 2. Characteristics of plant communities used in the experiment.
Average distance Average height Average diameter Age of Predominant vegetation between plants of plants of plants plants in the intervening area
Community (m) (m) (m)
A. nummuluria 3 1.26 f 0.19 1.16 + 0.45 10 years Danthonia caespitosa, Stipa variabilis A. vesicaria 2 0.46 + 0.12 0.94 k 0.41 10 years Danthonia caespitosa,
Stipa variabilis, A. vesicaria
do
CHLORIDES - PPM
1OD 1000
1.5-
60.0-
75.0-
9ocl
1
Fig. 1. Chloride as a function of profile depth of Billabong clay from
under (U) and between (B) the plants of A. nummularia (ATN) and
A. vesicaria (A TV).
clear from the table, the salinity level of only surface layers (O-7.5 15 cm) fluctuated with the season; the salinity was highest during and after summer when the evaporative demands were high, and lowest during winter after rains (Table 1).
Salinity Distribution
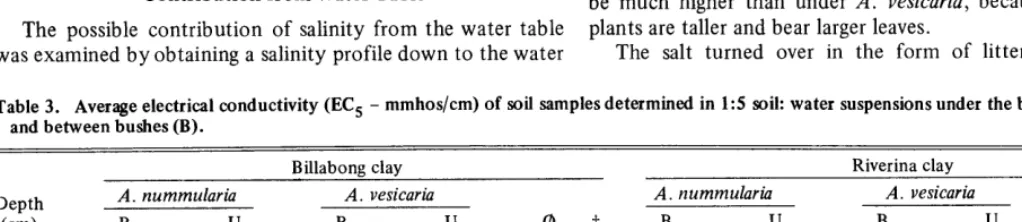
The distribution of chloride in the profile with respect to distance from the A. nummularia plant and profile depth is presented in a generalized diagram (Fig. 2) which was constructed mainly from the chloride results of seven tran- sects. The diagram shows that chloride content under the plant, compared to that between the plants, was higher in the O-7.5 cm layer, but was lower in the 30-45 cm layer. The differences in chloride between U and B positions at both depths were significant (P < 0.05). The chloride content of the
15-30 cm layer was almost the same as U, B, and intervening positions. Based on the net gain or loss of chloride with respect to position, three distinct zones are proposed; accumu- lation zone, compensation zone, and depletion zone.
Contribution from Water Table
The possible contribution of salinity from the water table was examined by obtaining a salinity profile down to the water
table (about 15 m). From such a deep water table, it can be suggested that transport of salts by capillarity is extremely doubtful.
Discussion
It is hypothesized that accumulation of a significantly higher quantity of soluble salts in the surface layers (“accumu- lation zone”) has occurred as a result of the large turnover of salts derived from leaves and fruits, which are shed in large quantities. It is suggested that this salt is derived mainly from the soil profile under the plant, thus creating a “depletion zone .” It is further suggested that in the “compensation zone ,” the depletion of salts by plant uptake is compensated by salt leachates from surface layers. Thus, salt accumulation, depletion, and compensation are a net result of processes which accumulate salts at one position and those which deplete them from the other. In order to discuss these results, several processes need to be considered: plant litter fall and its decomposition; leaching of salts from plants with rain, also leaching in the soil profile; evaporation of water from soil surface and deposition of salts at the soil surface; water movement to plant roots and convectional transport of salts, and salt transport by ionic diffusion.
The old leaves of both A. nummuZaria and A. vesicaria are shed steadily during autumn and winter, but heavy shedding occurs particularly after a prolonged dry season. The litter is compounded from separate growth flushes. In
A.
vesicaria the annual litter fall is much greater than the amount of vegetative material on the plant when it is in its period of maximum production, the fruit fall contributing to about 50 to 60 per cent of total litter fall (Charley, 1959). The sodium chloride content of leaves of both Atriplex sp. varied with the age and was much higher compared to other plant parts (Table 5). The fruits contain about half the amount contained by leaves (Charley, 1959). It is proposed that these falling leaves and fruits on rapid decomposition (Charley and Cowling, 1968) release a considerable amount of salt, which raises the salinity level of the soil under plants.Table 3 shows that surface soil under A. nummularia contains significantly higher salt than soil under A. vesicaria, although the salt concentration of leaves of both plants is about the same (Table 5). However, the amount of litter fall per unit area under the canopy of A. nummularia is likely to be much higher than under A. vesicaria, because the former plants are taller and bear larger leaves.
The salt turned over in the form of litter is apparently
Table 3. Average electrical conductivity (EC, - mmhos/cm) of soil samples determined in 1:s soil: water suspensions under the bush canopies (U) and between bushes (B).
Billabong clay Riverina clay Depth A. nummularia A. vesicaria A. nummularia A. vesicaria
(cm) B U B U Q,t B U B U Q, t
0 - 7.5 0.301** 0.677** 0.229* 0.388* NS ** 0.218** 0.605 * * 0.185** 0.331** NS * 7.5 - 15 0.658* 1.051* 0.443* 0.727* NS NS 0.258** 0.608** 0.206* 0.339* NS ** 15 - 30 1.609 1.807 1.578 0.912 NS ** 0.564 0.837 0.360 0.545 NS NS 30 - 45 2.271 2.394 1.974 1.811 NS * 0.898 1.425 0.873 1.002 NS * 45 - 60 3.207 3.758 4.693* 2.804* * NS 1.872 2.120 1.507 1.457 NS * 60 - 75 4.791 5.150 5.671 5.363 NS NS 3.790 4.350 3.857 2.094 NS ** 75 - 90 4.350 3.552 3.580 2.684 NS NS 4.120 5.130 5.708 4.782 * NS 0 Statistical significance between A. nummularia and A. vesicaria at position B.
t Statistical significance between A. nummularia and A. vesicaria at position U. * Difference between means significant at specified depths P < 0.05.
derived from the soil beneath the bush, thus causing a depletion of salts in the 39-45 cm layer (Fig. 2). Part of this salt may also be derived from the area between bushes (Jessup, 1969). Since at B position salt content in the two communities was similar to that in an adjacent non-saltbush area, it is suggested that the amount of salt taken by roots from the intervening areas may be of minor consequence.
Direct leaching of salts from intact leaves on the plants contributes very little to salt turnover, although fruits are more easily leached by rains (Charley, 1959; Sharma et al., unpublished). The leaching of salts from the surface soil to lower horizons explains the seasonal decrease in salt content of surface layers after rainy seasons (Table 3) and the formation of a “compensation zone.” Continuous uptake of salt from lower depths, its deposition at the surface under the canopy, and its subsequent leaching seem to be an endless cycle. Because of this, salt depletion from the 15-30 cm layer (Fig. 2) seems to be compensated by salt leachate. This was confirmed by our supporting studies, which indicated that water penetration in these soils did not exceed 30-40 cm depth.
Evaporation of soil water from the surface soil and deposition of salts on the surface is the usual process of salinity build-up. During and after summer, increased salinity
ATN
under the plants may be a consequence of a combination of large litter fall and evaporation, but increased salinity in the intervening area is certainly caused by the evaporation mechanism (Table 4). Movement of water carrying salts from B to U position is unlikely since there is extensive non-saltbush vegetation in the intervening area. Even in summer when intervening vegetation is dormant, direct upward loss of water is more likely during wet periods because of high evaporative demands.
Figure 2 indicates that there is a large chloride accumu- lation directly under the canopy, with a gradual decline towards the B position. There are two explanations offered for this. Firstly, it is likely that some litter is carried beyond the canopy by wind and deposited. Secondly, during dry seasons, when chances of having convective flow of salts to the plants are slight, ionic diffusion under concentration gradients might still cause some salt movement away from the plants.
An increase in soil salinity can affect plant growth directly, by lowering the soil water potential and by its toxic effects, and indirectly, by changing the hydrologic properties of soil and thus affecting the water balance. Our approximate calculations show that the osmotic potential values attained at -0.1, - 1 .O, and - 15 bars matric potential of surface layer (O-7.5 cm) of Billabong clay in an A. nummularia community
ATN (
Cl iLORI D ., . . . . . .
ES- PPM o-so 50-100
100-200
200-500
500-1000
1000-2000
2000-3000
3M
Fig. 2. Pictorial diagram showing distribution of chloride as a function of profile depth between two plants of A. nummularia (ATN) on Billabong
clay.
Table 4. Seasonal changes in electrical conductivity l,ECg - mmhosicm) of a Bitlabong clay in A. nummulorin community under the bushes (“) and between bushes(B).
Soil depth August 1969 December 1969
(cm) B U B U Q t
O-7.5 0.23* cl.39* 0.34** O&9** * * 7.5 - 15 0.48’ 0.69* 0.5** 1.07* NS *
15-30 1.29 1.66 1.31 1.67 NS NS
30-45 2.29 2.61 2.11 2.28 NS NS
45 60 2.66 3.30 3.55 2.80 NS NS
60 - 75 5.16 6.37 6.32 7.01 NS NS
75 - 90 4.85 5.05 5.18 4.55 NS NS
* Difference between means significant at specified depth P < 0.05. ** Difference between means rignificant at swcified depth P < 0.01. Q statistica, significance between A”g”St and December sampling at
position B.
+ statistica, significance between *ugwt and December sampling at pOSition “.
would be -3.1, -5.2, -7.8 bars under the bush compared to - 1.4, -2.4, -3.6 bars between the bushes respectively. These values indicate that germination, seedling survival, early establishment, and plant growth of non-halophytes are likely to be affected by the spatial distribution of salinity (U. S. Salinity Laboratory Staff, 1954). This might cause spatial variability in vegetation density and composition.
Table 5. Sodium chloride* content of various plant parts of two Awiplex species, deter- mined January 18, 1971.
Leaves
Medium 18.52 15.05
Senescing 15.58 12.01
Young 23.68 21.46
stems
Fine 0.58 0.59
Maill 0.28 0.22
Rno,r
^.__.”
Fine 0.69 0.58
Main 0.41 0.33
‘Chlorides are expressed as sodium chloride assuming that all the chlorides are associated with sodium.
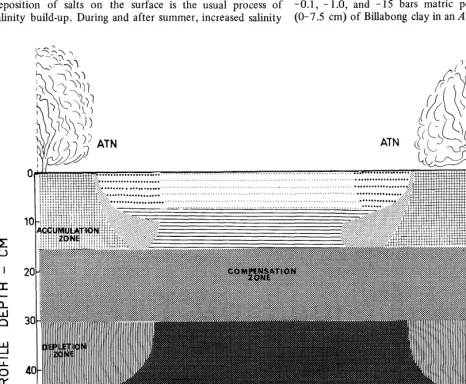
Our observations indicated that the vegetation under A. vesicmia plants was denser than between the bushes, whereas in most cases, the soil surface under A. nummulnria plants was devoid of vegetation (Fig. 3). However, these differences cannot be solely attributed to salinity buildup under the latter species since other features such as light, temperature, water withdrawal, nutrient status of soil, etc., are also affected by the presence of bushes.
Our preliminary studies indicated that salinity buildup and increase in pH under the bushes were also associated with an increase in exchangeable sodium, which significantly affected soil physical properties such as structure, water retention, etc.
However, whether this alteration in physical properties of soils would affect plant growth to a significant extent is not known. Although the pH of the surface soil was significantly increased by the presence of plants, it appears unlikely that such small increases in pH near neutral range would affect plant processes to any considerable degree.
It should be emphasized that our results distinctly imply that extreme care must be exercised while collecting represen- tative soil samples from Atriplex plant communities. Large differences in the chemical and physical properties of soil can be encountered in samples collected only a few metres apart.
Literature Cited
Beadle, N. C. W., R. D. B. Whaltey, and J. B. Gibson. 1957. Studies in halophytes. II. Analytic data on the mineral constituents of three species of Arriplex and their accampanying soils in Australia. Ecology 3X:340-344.
Charley, J. L. 1959. Soil salinity-vegetation patterns in western New South Wales and their modification by wer grazing. Ph.D. diss. Univ.
of New
England.chantey, J. L., and 8. W. Cowling. 1968. Changes in soil nutrient status
resulting
from
overgrazing and their consequences in plant com- munities of semi-arid zones. Proc. Ecol. Sot. Aust. 3:25-3X. Fireman, M., and H. E. Hayward. 1952. Indicator significance of wmeshrubsin theEscalante Desert, Utah. Bat. Gaz. 114:143-155. Jessup, R. W. 1969. Soil Salinity in saltbush country of northeastern
South Australia. Trans. Roy. Sot. 8. Aust. 93:69-78.
I&h, 1. H., and J. C. Noble. 1969. Vegetation resou~es. In: Arid lands of Australia. (R. 0. Slatyer and R. A. Perry, eds.) Aust. Nat. Univ. Press 5:73-92.
Roberts, E. C. 195Cl. Chemical efiects of salt-tolerant shrubs 0n soils. Int. Congr. Soil Sci. 4th. Amsterdam 1:404-406.
U. S. Salinity Laboratory Staff. 1954. Diagnosis and improvement of saline and alkali soils. U. S. Dep. Agr. Handbook No. 60.