Accelerated Playback of Meeting Recordings
by
Gerrit Hendrikus van Doorn
July 2007©
A thesis submitted in partial fulfillment of the requirements for the degree of
Master of Science
Graduation committee Prof. dr. ir. Anton Nijholt1 Dr. Roeland Ordelman1
Mike Flynn2
Dr. Pierre Wellner2
1
Chair Human Media Interaction, Dept. of EE-Math-CS, University of Twente, Enschede, Overijssel, The Netherlands
Acknowledgements
I would like to thank the following people, without whom this thesis would not have been possible:
My advisors Roeland Ordelman and Anton Nijholt for their advice, encouragement and patience.
My advisors Mike Flynn and Pierre Wellner for their advice, encouragement, and work on the Speed/Accuracy trade-off model.
Simon Tucker from the University of Sheffield for letting me use his Mach1 Matlab implementation.
Ferran Galán and Eileen Lew for participating in one of the user tests and providing me with feedback.
II
4.4.3 Overlap speakers and remove pauses ...35
4.4.4 Overlap parts with least amount of overlap...36
4.4.5 Overlap fixed parts ...38
4.4.6 Pitch shifting...39
4.4.7 The initial overlap browser implementation ...39
4.4.8 Initial overlap browser user test ...41
4.4.9 Final overlap browser...41
5 RESULTS ... 43
5.1 THE SUBJECTS...43
5.2 THE DATA...43
5.3 BETSCORES...45
5.4 SPEED/ACCURACY TRADE-OFF MODEL...47
5.4.1 Method ...47
5.4.2 Results...49
5.4.3 Model validity ...50
5.5 QUESTIONNAIRE...50
5.5.1 Base condition ...51
5.5.2 Speedup condition ...51
5.5.3 Overlap condition ...52
5.5.4 General remarks ...52
6 CONCLUSION ... 53
BIBLIOGRAPHY ... 55
APPENDIX ... 57
III
List of figures
FIGURE 1.SAMPLING TECHNIQUES... 6
FIGURE 2.SOLA EXAMPLE OF TIME STRETCHING. ... 7
FIGURE 3.HRTFS FOR THE LEFT AND RIGHT EARS AS HRIRS. ...11
FIGURE 4.HRIR MEASUREMENTS USING KEMAR ...12
FIGURE 5HRIR FOR LEFT AND RIGHT EARS AT AN ELEVATION OF 0 DEGREES AND AZIMUTH OF -45 DEGREES...13
FIGURE 6.THE BET PROCESS AS DESCRIBED IN WELLNER ET AL.(2005) ...18
FIGURE 7.CREATING OBSERVATIONS...19
FIGURE 8.OBSERVATION IMPORTANCE...19
FIGURE 9.PLUG-INS PASSING MESSAGES THROUGH THE ETHER...28
FIGURE 10.BASIC AUDIO PLAYER...29
FIGURE 11.BASELINE BROWSER...30
FIGURE 12.SPEEDUP BROWSER...31
FIGURE 13.SELECTING THE SPEEDUP FACTOR...32
FIGURE 14.SPEEDUP BROWSER MEDIA TIMELINE...32
FIGURE 15.TIME-COMPRESSION IMPLEMENTATION TEST GRID...33
FIGURE 16.SCHEMATIC PRESENTATION OF HOW A BINAURAL AUDIO STREAM IS CREATED FROM N MONAURAL AUDIO STREAMS...35
FIGURE 17.OVERLAP SPEAKERS AND PAUSE REMOVAL.EACH BLOCK REPRESENTS A SEGMENT OF SPEECH...36
FIGURE 18.MOVING AVERAGE OF THE PER PERSON SPEAKING TIME DURING MEETINGS IS1008C AND IB4010 ...37
FIGURE 19.PERCENTAGES OF OVERLAP OF ONE SPECIFIC TIME SEGMENT AND THE AVERAGE OF 11 RANDOMLY CHOSEN MEETINGS...37
FIGURE 20.MOVING AVERAGE OF THE PER PERSON SPEAKING TIME DURING MEETINGS IB4001 AND IB4003 ...38
FIGURE 21.PITCH SHIFTING THE BINAURAL AUDIO UP ONE SEMITONE...39
FIGURE 22.INITIAL OVERLAP-BROWSER IMPLEMENTATION...40
FIGURE 23.OVERLAP BROWSER...42
FIGURE 24.RAW TEST SCORES BASE CONDITION...44
FIGURE 25.RAW TEST SCORES SPEEDUP CONDITION...44
FIGURE 26.RAW TEST SCORES OVERLAP CONDITION...45
IV
List of tables
TABLE 1.ABET OBSERVATION...17
TABLE 2.BET MEETINGS...21
TABLE 3.OVERVIEW OF TEST CONDITIONS AND MEETING RECORDINGS...22
TABLE 4.BET RESULTS: MEAN ACCURACIES AND SPEEDS, AVERAGE OF EACH MEETING AVERAGE..46
TABLE 5.BET RESULTS: MEAN ACCURACIES AND SPEEDS, AVERAGE OF ALL OBSERVATIONS INDIVIDUALLY...46
TABLE 6.STANDARD DEVIATION OF RAW TEST SCORES...46
TABLE 7.CORRELATION (PEARSON’S R) BETWEEN CALIBRATION CONDITION AND THE TEST CONDITION MEETINGS...46
TABLE 8.PARAMETERS ESTIMATED FROM CALIBRATION CONDITION...49
TABLE 9.SPEED/ACCURACY TRADE-OFF MODEL QUALITY FACTORS...49
TABLE 10.RMS ERROR FOR MEAN MODEL AND TRADE-OFF MODEL...50
TABLE 11.QUESTIONNAIRE LIKERT SCALE RESULTS FOR BASE CONDITON...51
TABLE 12.QUESTIONNAIRE LIKERT SCALE RESULTS FOR SPEEDUP CONDITION...51
V
Abstract
Current technology allows us to record and store multimodal recordings of meetings. These recordings can function like an archive, as a replacement for minutes. Although recording these meetings is straightforward, finding specific information in them is not. In order to make it easier to find information in meeting recordings, meeting browsers are developed. A meeting browser may consist of many different components, each making it possible to browse or search the recorded media in a different manner. Meeting recordings consist of video and audio recordings. Other modalities, such as speech recognition transcripts and speech segmentations can be extracted from these sources and used to make browsing and searching the meeting more efficient in the sense that information can be found easier and quicker.
1
1
Introduction
The goal of this research is to explore more efficient ways of browsing archived meeting recordings. This research focuses specifically on methods to present audio efficiently.
1.1 Motivation
Meetings are an important part of our working lives. No matter what company branch you work in or weekend sports club you are part of, decisions have to be made and information has to be exchanged at any level of the hierarchy. The acts or processes of coming together to communicate, discuss issues, set priorities, and make decisions are called meetings. In order for participants of a meeting to look back on what happened during a meeting, minutes are made of the meeting. These minutes are usually an abstract of the meeting and contain only the main ideas and decisions.
The increase of low-cost disk space and improved multimedia encoding techniques, have made multimodal recordings of meetings possible. Having complete recordings of meetings available makes it possible to recall exactly what happened during a meeting.
People that could not attend a meeting or participants who would like to recall what happened during a meeting can playback the meeting as if they were there. The duration of meetings can vary from very short to hours and sometimes multiple days. Although a meeting might take up a lot of time, the information contained in a meeting is often scarce. People might want to recall a certain topic, the decisions made during a meeting, or look at the process that led to a certain decision. Having audio/video recordings of your meetings thus can have great benefits. However, although it is easier to speak than to write, it is slower to listen than to read (Arons, 1997). Therefore, having to playback one or more meeting recordings to find some piece of information is a slow process and in this respect inefficient. A more flexible method of playing back audio is through browsing. We define playback of audio as “a method of reproducing sound recordings” and browsing as “to scan through in order to find items of interest, especially without knowledge of what to look for beforehand”. Browsing, in the case of a media recording, adds an interactive element to playback as it allows skipping content that is potentially irrelevant. Although playing back a meeting is straightforward, browsing a meeting is much more laborious. Creating new technologies to enhance browsing of recorded meetings has therefore become an active area of research.
1.2 Problem description
2
Locating a piece of information in a meeting recording can be a difficult task. Playing back a meeting completely to find a specific piece of information is not very efficient. At best this information is located at the beginning, at worst at the end. When the meeting recording consists of just audio and video, the timeline of a general-purpose media-player can be used to browse through the meeting and skip irrelevant information, but this too is not very efficient and laborious. Adding additional information, such as slides, can make it easier to locate specific information in the audiovisual recording. Slides are structured and contain headings and other content. Locating specific audiovisual content can be done more easily by linking presentation slides to their corresponding audiovisual content, than by browsing just the audiovisual content.
The use of presentation slides makes answering certain questions easier, for example:
• “What material did Christine prefer the remote control to be made of?” • “What was the result of the discussion about which materials to use?” • “Why was wood chosen as the material for the remote control?
It is not always the case that presentation slides give an indication of where to look for the information, as is the case with questions like:
• “What was Christine’s role in this meeting?”
• “What did Christine say about the previous meeting?”
The first question is general while the second question is very specific. Therefore it is not clear if they belong to a certain topic or part of the meeting. In order to answer these questions you often need to listen to or skim through a large part of the media.
The problem with meeting recordings and audiovisual (A/V) recordings in general, is that they have a sequential/transient nature (Ranjan, 2005); there is no natural way for humans to skim speech information as the ear cannot skim in the temporal domain the way the eyes can browse in the spatial domain (Arons, 1997).
Unlike text documents, where you can skim through the content of the document, you need to play back the complete recording in order to know the structure of the content. You can skim through the recording but still you need to listen for at least several seconds to know what it is about at a specific time in the recording. If we can shorten the playback time of a recording, browsing the recording would become more efficient since the same amount of information would be processed in a shorter timeframe. Of course, while doing this we do not wish to remove content from the recording that might be of interest to a user. The combination of not removing content from media recordings and their sequential nature of media recordings leaves open only two options for shortening playback length:
• Speedup audio playback
• Present multiple streams of audio simultaneously
3 possible to browse through more audio in the same amount of time. These techniques will be discussed in more detail in Chapter 2.
1.3 Hypothesis
The hypothesis we set out to test is:
“Accelerated playback will improve meeting comprehension in a limited time situation”
When the length of a meeting is shortened users will have less meeting to skim through.
We will be investigating techniques to shorten the playback time of meeting recordings with the use of sped up speech and simultaneous playback of speech in interactive meeting browsers.
These meeting browsers will be designed to make browsing meetings more efficient, in comparison to using a general-purpose meeting browser, by decreasing the playback length of the meeting.
User tests will be conducted on 3 browsers to see what the effects of the implemented techniques are on browsing meetings, and to compare the performance of the different browsers.
We expect that decreasing the playback time of a meeting increases the efficiency of browsing. We will prove this expectation false or true by comparing the number of questions users can answer in a limited time situation using sped up and overlapped speech and speech played back at a normal rate.
1.4 Overview of document
The thesis is organized as follows:
In Chapter 2 we review previous work from which our research draws. Time-compression and binaural audio algorithms and implementations are discussed to give an understanding of these techniques and the way they are used in the implementation of our meeting browsers. Also, some related systems are discussed.
Chapter 3 discusses the setup of the user test that was used to compare the use of time-compression and binaural audio techniques in a meeting browser, using an objective measure.
Chapter 4 describes the design of the implemented meeting browsers, based on literature and observations from informal tests.
Chapter 5 gives a summary of the results collected during the user test described in chapter three.
5
2
Background
The following sections will give background on techniques to speed-up audio or enhance the ability of people to listen to multiple sound sources at once.
2.1 Time-compressed speech
Time compression technologies allow the playback speed of a recording to be increased and therefore decrease the time needed to listen to a complete recording. Time compressed speech is also referred to as accelerated, compressed, time-scale modified, sped-up, rate-converted, or time altered speech (Arons, 1994).
2.1.1 Perception of time-compressed speech
Time compressed speech can be used to increase the amount of information a person can perceive per time-unit and increase storage capacity of speech recordings.
Research by Sticht has shown that listening twice to teaching materials that are sped-up twice, is more effective than listening to the same recording once at normal speed (Arons, 1994).
According to Arons (1997), Beasley and Maki informally reported that, following a 30-minute exposure to time-compressed speech, listeners became uncomfortable if they were forced to return to the normal rate of presentation. They also observed that subject’s listening-rate preference shifted to faster rates after exposure to compressed speech. According to Janse (2003), this adaptation is not permanent. The type of adjustment is not like learning a ‘trick’ that is stored in long-term memory.
2.1.2 General techniques
There are many ways of compressing speech. Some general techniques are: Changing the playback rate
When playing back speech, the playback rate can be changed to slow it down or speed it up. This is similar to playing a tape faster or slower or playing a 45rpm record on a 78rpm record player. When playing back a speech recording at 44 KHz that was recorded with a sampling rate of 22 KHz, the playback time will be halved, but an unwanted pitch-shifting effect will occur. The frequency shift is proportional to the change in playback speed; when the speech is sped up twice, the frequency will be doubled and the speech will sound like chipmunks. Preserving pitch and timbre is important to maximize intelligibility and quality of the listening experience (Omoigui, He, Gupta, Grudin, & Sanocki, 1999; Verhelst, 2000).
Speaking faster
6
Speech synthesis
Text-to-speech systems make use of speech synthesis to generate artificial human speech. These speech synthesizers are capable of reducing phoneme and silence durations in order to produce speech with different word rates. This technique is particularly helpful as a technical aid for visually impaired people but is irrelevant for recorded speech (Arons, 1992b).
Pause removal
Since silences do not contain any lexical information, they are redundant. Most spontaneous speech contains pauses and hesitations. By removing these silences the playback time of the recording can be reduced. Removing pauses will be experienced as disruptive when they occur within clauses, making it important to distinguish between different pauses. The duration of a hesitation is often smaller than the duration of a grammatical pause. Recent research has shown that a distinction between these two can not be made solely based on duration (O’Shaughnessy, 1992). Because pauses are not uniformly distributed over a recording and differ in length, removal or shortening of pauses can be seen as non-linear time-compression, making it difficult to obtain a pre-determined compression ratio.
2.1.3 Sampling
Much of the research on time-compressed speech was influenced by Miller and Licklider (1950), who demonstrated the temporal redundancy of speech. Their research shows that large parts of a speech recording can be removed without affecting intelligibility, by discarding interrupted speech segments when interruptions were made at frequent intervals. This technique is referred to as Fairbanks sampling. An implementation of this technique is shown in Figure 1.
Figure 1. Sampling techniques
The Fairbanks sampling from Figure 1 compresses the original speech signal by 50%. By adjusting the frequency and interval size, the amount of compression can be adjusted. However, the sampling interval should be at least as long as one pitch period and not longer than the length of a phoneme (Arons, 1994). Although this technique is computationally simple and very easy to implement, it introduces discontinuities at the interval boundaries and produces clicks and other signal distortions.
7 signal on one ear, while playing the discarded intervals to the other ear. Information is lost when the compression ratio is greater than 50%.
2.1.4 SOLA
The Synchronized OverLap Add (SOLA) method is a variant of the sampling method and was first introduced by Roucos and Wilgus (1985). SOLA does not discard intervals
SOLA uses correlation techniques to perform time-scaling speech. It is a very popular time-scaling technique as it is computationally simple yet generates good quality sped up speech, and therefore can be used for real-time applications. The speech signal is broken up into fixed sized segments that are shifted according to the time-scaling factor
α
. Then, for each segment, the discrete time lag factor∆
t
n is determined using cross correlation of the overlapping parts to find the point of maximum similarity. The overlapping parts are added together using a fade-in/fade-out-function, producing less artifacts than traditional sampling-techniques (Zölzer et al., 2002). SOLA operates in the time-domain, without making use of Fourier Transforms, making it very computational efficient.Figure 2. SOLA example of time stretching.
Figure 2 gives an example of time-stretching using SOLA. Time-compression is achieved in a similar matter, but with a different
α
value.Algorithm:
1. Segment the input signal into blocks of N with a time shift Sa 2. Reposition the blocks with the time scale factor to
S
s=
α
S
a3. Compute the cross correlation of the overlapping parts
4. Extract the discrete time lag
∆
t
n where the cross correlation has its maximum value5. Using this
∆
t
n, fade out the first segmentx n
1( )
and fade in the second segmentx n
2( )
8
High quality time-compressed speech is achieved using the SOLA technique, and speech that is processed with SOLA does not result in speech that is pitch-shifted.
2.1.5 PSOLA
A variation on SOLA is Pitch-Synchronous OverLap-Add (PSOLA). PSOLA was proposed by Moulines and Charpentier (Zölzer et al., 2002). PSOLA makes use of the pitch to correctly synchronize time segments, avoiding pitch discontinuities. By duplicating or eliminating segments of the speech signal at a pitch-synchronous rate, voiced speech can be time-compressed or time-stretched. As with SOLA, duration manipulations obtained with PSOLA are applied directly to the signal itself. First a pitch detector places markers at each pitch period. At the pitch-mark locations, the signal is decomposed into separate but overlapping windows, with the use of Hanning windows that are usually twice the fundamental frequency duration. When the speech signal is time-compressed, pitch periods are deleted from the signal, as much as is necessary to realize the wanted duration. The resulting signal contains less pitch periods but still has many of the brief acoustic events important to speech perception. However, when compressing the speech signal to 50% of its original duration, neighboring pitch-periods will be removed.
2.1.6 WSOLA
Another variant of the SOLA algorithm is the Waveform-similarity-based Synchronous Overlap and Add algorithm (WSOLA) (Verhelst, 2000; Verhelst & Roelands, 1993). WSOLA uses an asynchronous segmentation technique with a fixed length window in combination with regularly spaced synthesis. It is computationally and algorithmically more efficient than SOLA and PSOLA.
2.1.7 Mach1
Covell, Withgott and Slaney (1998a; 1998b) propose a new approach to non-uniform time compression. Mach1 tries to mimic the natural timing of speech that is used by humans when they talk fast. When speaking fast, human speakers compress silences and pauses the most, stressed vowels the least and unstressed vowels intermediate. The compression of consonants is based on their neighboring vowels. On average, consonants are more compressed than vowels. Covell et al. (1998a; Covell et al., 1998b) also avoided over-compressing already rapid sections of speech. To achieve this, Mach1 tries to estimate something they call the Audio Tension, which is the degree to which the local speech segments resist changes in rate. High-tension segments are compressed less than low-tension segments. The Audio Tension is constructed from two estimated continuous-valued measurements of the speech signal: local emphasis and
9 local target rates are used as input for a standard time-compression algorithm like SOLA.
User tests were conducted to compare user’s comprehensibility and preference between Mach1 and SOLA. The tests showed significant improvements in comprehension on the behalf of Mach1, especially at high compression rates. Users preferred Mach1 95% of the time on average over SOLA, increasing with compression rate. Comprehension tests were conducted on short dialogues, long dialogues and monologues. Mach1 performed better on the short dialogues and monologues but showed no statistical significant comprehension improvement on the long dialogues. This could be due to confusing interactions between Mach1 and turn-taking techniques in the conversations.
Non-linear time-compressed audio (e.g. Mach1) is more comprehensible than linear time-compressed audio (like SOLA) at higher speeds. There is no significant difference in comprehension at lower speeds (He & Gupta, 2001). Although Mach1 is perhaps the most sophisticated and most promising algorithm for time-compressed speech playback, there are some drawbacks:
• The Mach1 algorithm is an open loop algorithm; the eventual global compression rate can be different from the desired global compression rate
• Because of the high computational load, it can not be used in real-time
2.1.8 SpeechSkimmer
10
speech from the other speaker. The speed of the segments at skimming levels 2, 3 and 4 can be adjusted continuously. A usability test where users have to think aloud was conducted on the system. The test looks at the interface and skimming of speech. No tests were done to see which time compression technique performs the best (e.g. has good comprehension at high compression rates). Some users thought there was a major improvement when using headphones. One user was amazed at how much better the comprehension was when using dichotic time-compressed speech instead of hearing monaural speech presented over a speaker. An interesting thing to note is that most users skimmed (level 3) a recording to find the general topic of interest after which they switched to level 1 (playing) or level 2 ( pauses removed), usually with time compression.
2.2 Binaural audio
among a cacophony of others or background noise has been studied by many, an extensive overview can be found in Arons (1992a) and Stifelman (1994). Early research made use of dichotic audio to study the phenomena of selective attention. With dichotic audio, 2 messages are played back over headphones, each message on a different ear. Subjects usually had to shadow (i.e. repeat the speech out loud word by word) a primary message, while a secondary message was played in the other ear. Subjects did not recall the secondary message, except when it was the subject’s name or some other material of “importance”. When subjects needed to detect target words from either the primary or secondary message, while shadowing the primary message, detection of words in the primary message was higher (87%) than in the secondary message (9%). The high cognitive load of shadowing task interferes with the transfer from short-term memory to long-short-term memory, but non-attended messages do get into short-term memory.2.2.2 Stream segregation
Treisman (1964) studied the effect of irrelevant messages on selective attention (Stifelman, 1994). He found that interference with the primary shadowed messages occurred when the irrelevant messages (0 to 2) where distinguished by voice (male versus female) and spatial location (left, center, or right). When all irrelevant messages had the same voice and location, performance improved. This effect is due to auditory stream segregation. When two sound sources have similar acoustic features (like pitch and location), they are perceived as one single sound source. When the irrelevant messages had different acoustic features, performance decreased because the number of interfering channels was higher than when their acoustic features were similar.
Multiple factors exist that can enhance stream segregation, like: • Difference in pitch (male, female)
11 Yost (1994) showed that subjects could detect more words, numbers, and letters from three simultaneous sound sources when they were presented binaurally than when presented monaurally. When the number of sound sources increased, subject’s performance decreased (Stifelman, 1994).
2.2.3 What is binaural audio?
Binaural literally means “having or relating to two ears”. Humans hear with two ears. Our auditory system allows us, with only two ears, to perceive sounds from all direction. With these two ears, people can distinguish what direction sounds come from, approximate at what distance the sound source is located and approximate how big the sound source is. There are several perceptual cues we can perceive that make it possible to do this:
• The amplitude of the sound at each ear • The time difference of the sound at each ear • The frequency spectrum of the sound at each ear
By applying these perceptual cues to a monaural audio stream, the monaural audio stream can be perceived as being at a specific spatial location. This is best perceived when using headphones.
2.2.4 HRTF and HRIR
HRTF stands for Head Related Transfer Function and is a function that describes how a sound wave is modified by the diffraction and reflection caused by the human torso, shoulders, head and pinnae (the visible part of the ears) in the frequency domain. The time domain equivalent of the HRTF is called the Head Related Impulse Response (HRIR). The HRTF varies in a complex way with frequency, elevation, azimuth, range. It also varies significantly per person as it depends on a person’s body shape.
12
In Figure 3 the sound x is filtered by hr and hl before it arrives at the inner ear as
xr and xl. By applying the HRTF of the person from Figure 3 to a monaural
stream, this person perceives the audio stream as coming from a specific direction when heard through headphones. HRTF’s can either be experimentally measured, or they can be approximated using a model.
2.2.5 Measured HRTF
One way to obtain the HTRF for a given source location is to measure the HRIR of an impulse at the ear drum of a person or dummy. This is usually done in an anechoic room. An anechoic is a room that is isolated from external sound or electromagnetic radiation sources, and prevents against reverberation. The room is completely covered with anechoic tiles, which absorb the sound waves in order to minimize reflections of the sound. In this way, the effect of the surroundings is minimized when measuring the HRIR, and thus only captures the influence of head, pinnae, and/or torso.
Figure 4. HRIR measurements using KEMAR1
HRIR measurements are done by placing microphones in a human or dummy ear and measuring the response to an impulse
δ
( )
t
. The person or dummy is usually located in the centre of the room and is surrounded by loud speakers. The HRIR is measured for a fixed number of elevation and azimuth angles. As an HRIR is person dependent, these measurements sometimes are carried out for different individuals.
1
13 headphones. By interpolating HRIR measurements, HRIRs of locations not included in a HRIR database can be created. In Figure 5 we can see that the HRIR of the right ear is delayed and the amplitude is smaller than that of the left ear. This makes sense as the sound has to travel around the head towards the right ear as is illustrated in Figure 3.
There are several public domain HRIR databases available online, such as the However, measuring an HTRF accurately is time consuming and experimentally difficult. Low-frequency measurements are specifically difficult, as large loudspeakers are needed during the HTRF measurements. This can be problematic considering the setup of such measuring environments, as can be seen in Figure 4.
14
Intensity Difference (IID) and pinna. Other sub-models, such as a shoulder model, can be incorporated to enhance the approximation.
The model proposed by Brown and Duda (1997) is comprised of the following sub-models:
• Head model
describing the ITD and IID as primary cues for azimuth
• Pinna model
the pinna (visible part of the ears) is an important cue for elevation
• Room model
to create an externalization effect using room reverberation and range
The ITD describes the delay occurring when sound arrives at the ear furthest from the sound source compared to the closer ear. The IID describes the change in intensity caused by the head shadow.
Woodworth and Schlosberg (1954) proposed the following formula to model the azimuth between sound source and listener. This model was also used by Brown and Duda (1997). The model is based on simple geometric considerations, assuming the head is spherical. In reality the ITD is slightly larger and differs at low frequencies. Other models assume different geometric models like the adaptable ellipsoidal head model (Duda, Avendano, & Algazi, 1999).
The IID is often modeled by a pole filter. The following filter was used by Brown an Duda (1997). combined to create the head model. This IID model, unlike the ITD model, does take frequency into account. By adding a pinna model, elevation can be included. The pinna is considered to be a primary source for elevation.
15 visual spatial memory to recall topics; this is not possible with audio due to the temporal nature of sound. In order to reliably know the topics in an audio stream, we need to listen to the complete stream. Dynamic Soundscape tries to overcome this limitation by simultaneous presentation and mapping of media time to a spatial location. A sound recording is presented to the listener by so called speakers that orbit around the listener. A speaker is a sound stream that is orbiting around the listener’s head (with 4.8 degrees per second) by using binaural audio playback through headphones. The position of a speaker is related to the time in the audio recording, thus mapping time to space. There can be 1 to 4 speakers at once orbiting the listener, each playing back a different part of the recording. When the system starts, one speaker is orbiting the listener. When a listener wants to go back or skip ahead in the recording it can point (using a touch-pad) to a previous or future location. A new speaker will be created that starts playing at the indicated location. The listener can focus on one sound source while he/she can still hear the other sound sources in the background and switch to one of these sound sources when something of interest comes up. A rough initial implementation was first made that showed that slow continuous motion made listeners remember more topics and their location. Increasing the loudness of the speaker, towards which the listener is leaning to, enhances selective listening, especially when multiple speakers are talking with the same announcer voice. In order to know towards which speaker a listener was leaning to, a Polhemus sensor was attached to the headset.
2.2.8 AudioStreamer
Another non-visual user interface for simultaneous presentation of sound sources is AudioStreamer (Mullins, 1996; Schmandt & Mullins, 1995). Users of AudioStreamer listened to three simultaneous sound sources, segregated by exploiting the cocktail party effect. Users were able to enhance their ability to selectively attend to a single audio stream by bringing this stream into “focus” using head pointing. Subjects could make one of the streams acoustically prominent by moving their head in the direction of the audio streams. By auditory alerting the user of salient events (acoustic cues) the user’s ability to perceive events on channels that are out of focus was augmented.
17
3
User tests
3.1 Browser Evaluation Test
In order to build better meeting browsers we need to be able to evaluate a browser’s performance using objective metrics. First we need to define what this objective metric should be:
The task of browsing a meeting recording is
an attempt to find a maximum number of observations of interest in a minimum amount of time.
The above definition was stated by Wellner et al. (2005) who developed the BET (Browser Evaluation Test). The BET aims to be:
a) An objective measure of the browser effectiveness based on user performance rather than satisfaction
b) Independent of experimenter perception c) Produce numeric scores that can be compared d) Replicable
To measure a browser’s effectiveness, user tests are conducted. In these tests, subjects are exposed to statements about the meeting in pairs of two: a true statement and a false statement.
True statement The group decided to show The Big Lebowski False statement The group decided to show Saving Private Ryan
Table 1. A BET observation
These statement pairs are called observations. The test subjects have to use a meeting browser to browse through a meeting in order to find out which statement of the presented observations is true. The test subjects get a limited amount of time; half the duration of the actual meeting. Their goal is to answers as many questions as possible in a limited amount of time.
The BET aims to be objective and independent from the experimenters in that the observations presented to the test subjects were collected by observers who are neither experimenters nor meeting participants and thus have no prior knowledge and bias in favor of a certain browser or meeting.
18
Figure 6. The BET process as described in Wellner et al. (2005)
The BET process displayed in Figure 6 can be summarized as follows: 1. Record meeting (of meeting participants)
2. Collect observations (done by observers)
3. Group and rank the observations (done by experimenters)
4. Answer the test questions using a browser (done by test subjects) 5. Compare browser scores
3.1.1 Collecting observations
The observations or observations of interest, presented to the users, are collected by so called observers. Observers are neither experimenters nor do they participate in the user tests. Unlike test subjects, the observers are able to see the full recordings without any time limit. Each observer is instructed to produce observations that the meeting participants appear to consider interesting. The observations should be difficult to guess without prior knowledge of the meeting. Observers create the observations in two steps:
1. Create a list of true statements
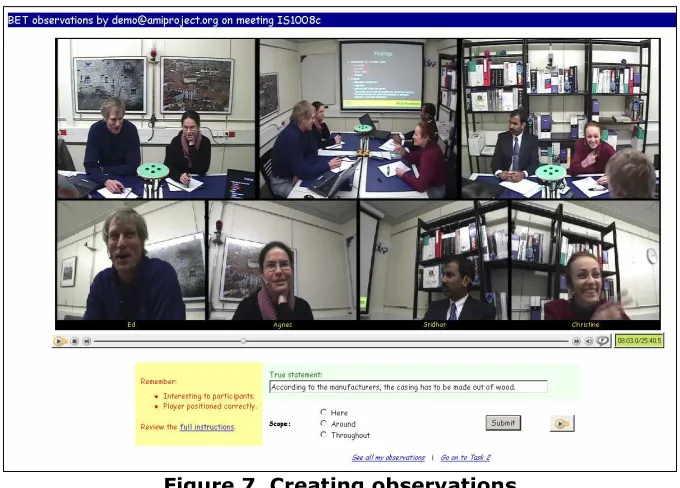
19 Figure 7. Creating observations
After all true statements are generated, the observers use the interface shown in Figure 8 to give each observation an importance value and to create a false statement.
Figure 8. Observation importance
20
3.1.2 Observation grouping
Because there are multiple observers producing observations, many of the observations are the same or similar, e.g. when the true statements of multiple observations are very similar or overlap. These observations are grouped. The media-times of these observations usually are very close. From a group of observations, one representative observation is chosen. These group representatives are the observations that potentially, depending on the order, will be shown to the test subjects.
3.1.3 Observation cleaning
Cleaning up of the observations consists of rejecting observations when:
• True statements are not always true, or false statements are not always false
• Statements are incomprehensible
• The true statement can be guessed without prior knowledge of the meeting
• The true and false statement are not parallel enough • Observations that are not group representatives
One of the goals of the BET is to have experimenter neutral observations to prevent a bias in favor of a certain browser design. The initial idea was to keep all observations as they were written down by the observers. But because observations can contain spelling or grammatical errors, are too long or not explicit enough, or the statements are too complementary to each other, the observations were edited. To prevent a browser specific bias in the observations due to editing, browser development teams could discuss and comment on the decisions on collaborative web pages.
3.1.4 Observation ordering
21
3.2 Test setup
The meeting recordings used for this user test are in English. To prevent variance in the test results due to insufficient English skills, user tests were carried out with native English speakers only. The tests were carried out at the University of Sheffield in Great Britain. A total of 46 people participated in the user test, of which 29 where women and 17 where men.
3.2.1 Meeting data
Four meeting browsers were tested using three different meeting recordings. These recordings are part of the AMI Corpus (Carletta et al., 2005). The AMI corpus is a multimodal data set that contains over hundreds of hours of recorded meetings. These meetings are either real, scripted or scenario based. Real meetings concern real projects or issues. Scripted meetings are held according to a pre-specified sequence of actions. Most of these meetings are scenario-based meetings; these meetings are motivated by a scenario or situation given to the participants before the meeting to guide their behavior. The meetings used in this user test were scenario-based meetings.
choosing furniture for the reading room
IS1008c 25:46 12:53 conceptual design of a new remote control
IB4010 49:20 24:40 English movie club of Montreux Table 2. BET meetings
These meetings were chosen because the observations for these meetings were already collected. The recorded data of each of these meetings consists of:
• 12 microphone array audio recordings
• 4 headset audio recordings (one for each meeting participant) • 4 lapel audio recordings (one for each meeting participant)
• Audio mix of all headset recordings • Audio mix of all lapel recordings
• Close-up videos of each participant • Center, left and right room-overview videos
• Logitech I/O digital pen recordings (XML, images and video) • Whiteboard drawings (XML output)
• Slides (as recorded from the screen, including timestamps) • Original files of all presentations
• Speaker segmentations • Speech recognition transcript
22
3.2.2 Test conditions
The user tests consisted of four different test conditions. Each test subject participated in three test conditions.
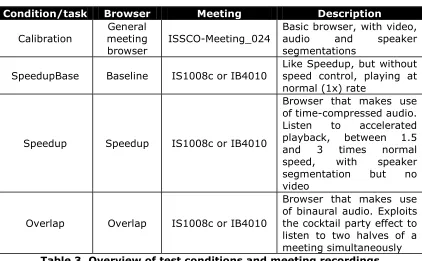
Condition/task Browser Meeting Description
Calibration
SpeedupBase Baseline IS1008c or IB4010
Like Speedup, but without speed control, playing at normal (1x) rate
Speedup Speedup IS1008c or IB4010
Browser that makes use
Overlap Overlap IS1008c or IB4010
Browser that makes use of binaural audio. Exploits the cocktail party effect to listen to two halves of a meeting simultaneously Table 3. Overview of test conditions and meeting recordings
These browsers are described in detail in Chapter 4.
All test subjects performed a calibration task to make test subjects familiar with the concept of meeting browsers and in the hope we could use their performance on this task to normalize their results on the actual browser tests. The calibration task made use of both a different browser and a different meeting than the actual browser tests. The actual experimental browser tests were done using the Baseline, Speedup and Overlap browsers.
3.2.3 Test structure
Each test subject proceeds through the following five steps: 1. Test with basic meeting browser (20 min.)
2. Tutorial on experimental meeting browser (~10 min.)
3. First test of experimental meeting browser on first meeting (12:53 or 24:40 min.)
4. Second test of experimental meeting browser on second meeting (12:53 or 24:40 min.)
5. Final questionnaire (~10 min.)
Users were free to take a short break in between steps but not during steps, as their performance is being timed.
23 were asked to answer as many questions as possible within the limited time they had.
After the calibration task, each test subject received a written tutorial about the browser they were going to test. The tutorial described every browser control and let the test subjects perform some simple tasks. Each task involved a different browser control.
When the test subjects completed the tutorial they began the test with the experimental browser. Each subject only tested one experimental browser and each browser was tested with two different meetings. The order of the meetings, which meeting is first and which is second, was counter balanced; one half of the test subjects started the test with meeting IS1008c while the other half started with meeting IB4010. Observations differed for each meeting and were presented to the test subjects in a predefined order as is described in section 3.1.4.
Finally, the test subjects were asked to fill in a questionnaire.
3.2.4 Data collection
During the BET, the answers and timing of these answers are collected and stored in a database. The answer of each observation is stored as a Boolean telling if the test subject answered correctly or not. For each answer the time remaining till the end of the BET is recorded (time left).
The questionnaire at the end of the BET is designed to allow the gathering of data for both qualitative and quantitative analysis and contain both open-ended questions and Likert scales. Likert scale answers are stored as integers, where -2 represents disagreement and 2 represents agreement.
25
4
Meeting browser design
Three meeting browsers were created and tested with the BET, one for each BET condition (see chapter 3.2.2):
• Baseline browser (see chapter 4.2)
A basic audio browser with slides, speech segmentation and timeline
• Speedup browser (see chapter 4.3)
Similar to the baseline browser but with additional speed-slider and time-compressed audio instead of monaural audio
• Overlap browser (see chapter 4.4)
Similar to the baseline browser but plays back binaural instead of monaural audio and with additional balance control
This chapter describes the choices that were made, based on requirements, literature study and informal tests, and how we came to the design of the meeting browsers that were used for the BET. First we discuss the application framework that was used to develop the browsers followed by the design and implementation of each meeting browser is discussed.
4.1 JFerret
A requirement was that the meeting browsers would be implemented using the JFerret framework so existing technologies could be used and development would not need to start from scratch. JFerret is a multimedia browser architecture developed for the AMI project and provides a plug-in API. The JFerret framework2 is written entirely in Java, making it platform independent. New plug-ins can be easily created and added. By making use of the JFerret framework, a developer can make use of plug-ins that are available and extend the framework for his or her needs. Each plug-in is designed to handle a specific task. A meeting browser is constructed by combining different plug-ins. These plug-ins can communicate with each other using messages. An XML configuration file is used to describe a meeting browser by describing which plug-ins are loaded, the parameters of the plug-ins, to what messages the plug-ins should listen and what message names the plug-ins send.
2 Mike Flynn, IDIAP, Switzerland
<?xml version="1.0" encoding="ISO-8859-1"?>
<Frame xmlns="ch.idiap.jferret.plugin" title="Test">
<Audio id="2" name="media2" master="true" src="1.wav" mute="true" volume="1.0"/> <Panel>
<Scroll>
<Column attribute="time" name="media2" width="180">
<Slide attribute="move" src="1.jpg" target="media2" value="0918000"/> <Slide attribute="move" src="2.jpg" target="media2" value="0968000"/> </Column>
</Scroll>
<Button name="play" target="media2" attribute="state" value="play"/> <Panel>
26
The above XML example shows how plug-ins are combined to form a very simple browser. The Frame and Panel plug-ins together create the application window. Slides and a button are displayed within this window. Audio content is also loaded but not displayed. The button, audio and slides listen and/or send to the same target group “media2”. The audio starts playing when the play button is pressed. The slides are placed within a scroll plug-in and scrollbars appear when the slides do not fit on the screen. Each slide has a time associated with it. When clicking on a slide a message is sent to “media2” and the media-time of the audio is adjusted to the time associated to this slide.
Figure 23, Figure 12 and Figure 11 give and idea of what a meeting browser can look like in the JFerret framework. These are the meeting browsers used for the BET.
These browsers contain plug-ins such as: • Frame
Acts as the top-level window of an application
• Column
A container that displays its children in a vertical column
• Row
A container that displays its children in a horizontal row
• Audio
A synchronized audio player that makes use of the Java Media Framework (JMF). The source can be a file or a URL using HTTP or streamed using RTSP
• Video
A synchronized video player that makes use of the Java Media Framework (JMF). The source can be a file or a URL using HTTP or streamed using RTSP
• MediaGroup
Represents a synchronized group of media players (Audio and Video)
• Img
Displays an image
• Panel
A generic container that displays its children using a Flow Layout. When provided with a title, the title is displayed together with a border
• Split
A split pane container that displays its children as a row or column separated by narrow, movable divides
• Scroll
A generic scrolling container that displays all its children using a FlowLayout and automatically displays scrollbars when the container is smaller than its children require turn the border on and off at runtime
27
A generic stack-of-cards container that only displays one of its children and listens to messages to switch between its children
• TimeGraph
A vertical timeline that displays its children on top of a grid, children being Interval plug-ins. When clicking on the background the represented time is sent to the specified destination
• Interval
A simple Panel that is a visual representation of a labeled time interval. When clicked, the start time of the interval is send to a specified destination
• TimeScale
Inherits from TimeGraph and displays an additional timescale
• Cursor
A line representing the current media time in a TimeGraph or TimeScale
• Button
A generic button plug-in that can embed text or an image. A button can be disabled/enabled by other plug-ins using messages. A button can also send messages.
• Slide
A clickable image that sends a message when clicked on
The above plug-ins can be combined to create browsers that can display or play back multimodal information such as:
• Speech segmentation
Speech segments of each speaker are represented by Interval plug-ins in a TimeGraph with Cursor and TimeScale with a Cursor placed in a Scroll plug-in
• Slides
Images of presentation sheets captured during a meeting can be displayed using the Slide plugin
• Audio
The Audio plug-in plays back the recorded audio
• Video
The Audio plug-in plays back the recorded audio
28
Figure 9. Plug-ins passing messages through the ether
In the above figure a user can push a button that sends the state “play” to the MediaGroup. The MediaGroup starts the Audio and Video media players. A user can also click on one of the Slides, which sends a time to the MediaGroup telling it to update the media time of the media players. The MediaGroup also broadcasts the media time over the ether and thus the time Cursor is set to the correct media time. This ether message system makes it possible to add functionality to the framework without changing the framework.
For example: a plug-in can be added that indicates the end of the media recording by playing a sound. This plug-in listens to the media-time broadcasts of the MediaGroup and compares it with the end time of the audio or video.
29
4.2 Baseline browser
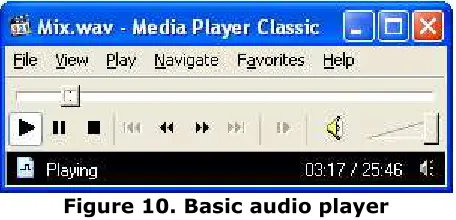
The speedup and overlap browsers are compared with the baseline browser. The baseline browser is similar to the speedup and overlap browsers but without the binaural audio and sped up audio. The baseline browser is basically a fancy audio player that includes meeting related components. These extra components are included to make browsing a meeting easier for the user, thereby making it possible to answer more questions in a fixed amount of time than when a basic audio player, such as in Figure 10, would be used. Test results can be more reliable when users are able to answer more questions.
Figure 10. Basic audio player
The components shared by the baseline browser (Figure 11) and a basic audio player (e.g. Figure 10) are:
• Audio player • Timeline • Play button
The meeting related components of the baseline browser are: • Slides
• Speech segmentation
• Speech segmentation viewport indication • Meeting participant names
• Meeting participant pictures
• Colored picture frames (light up when participants speak)
The slides represent the slides presented during the meeting on a projector and are tagged with the time the slide appeared in the meeting. When clicking a slide the media time of the audio is set to the time at which the slide was displayed during the meeting.
The speech segmentation shows the speech segments of each individual speaker indicated by the colored blobs. The user can click on the colored blobs to set the media time of the audio to the begin time of the blob or click on the background to go to that specific time. The speech segmentation also acts like a timeline; the vertical axis corresponds to the progress of the meeting.
30
For instance, when a participant refers to another participant name, the user can use the speech segmentation to directly navigate to the response of the participant that was referred to by clicking on the corresponding speech segment. When a participant is speaking, a colored box corresponding to the color of the speech segmentation appears around that participant’s picture.
Figure 11. Baseline browser
31 segmentation viewport. This viewport cursor scrolls along with the speech segmentation viewport.
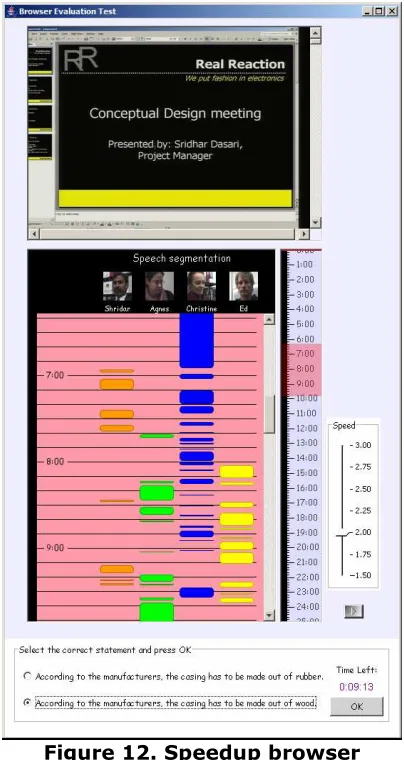
4.3 Speedup browser
4.3.1 The speedup browser implementation
The speedup browser is similar to the baseline browser except that it provides accelerated audio playback with a user-controlled speed.
Figure 12. Speedup browser
As we can see in Figure 12, the only visible addition to this meeting browser is the extra speed slider control.
32
Figure 13. Selecting the speedup factor
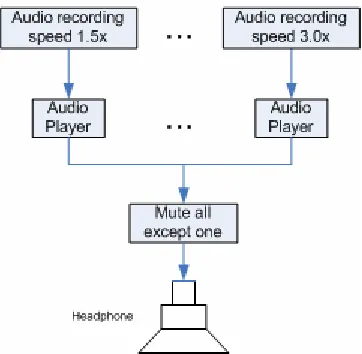
All but one audio player are muted. The one audio player that is not muted is the audio player that is playing the audio file selected with the “Speed” slider. When the user changes the speed from 1.5 to 2.0, the audio player that is playing the recording with speedup factor 2.0 is unmuted after which the other players are muted. When switching to another audio player the time also has to be changed as they are all playing on the same timeline (see Figure 14). If, for example, the 1.0 times original speed audio is played back, and the media time is 10 minutes. If the user changes the speed to 2.0 times the original speed, the time needs to be adjusted to:
(currentTime * currentSpeed) / newSpeed = (10 x 1.0) / 2 = 5 minutes
Figure 14. Speedup browser media timeline
In total there are 7 audio players playing at the same time but just one can be heard, with speedup factors: 1.5, 1.75, 2.0, 2.25, 2.5, 3.0. It was decided to not let the speedup browser play audio at the original speed to prevent users from ignoring the sped-up speech. The lowest speed the user could select was 1.5 times the original speed.
4.3.2 Which time-compression algorithm to use?
33 available implementations were tested in a subjective user test. A website was created where samples created using the collected time-compression implementations could be compared to each other (see Figure 15).
The following implementations were tested:
• Phase vocoder matlab implementation (with different window sizes)(Ellis, 2002)
• Solafs matlab implementation (with different window sizes)(Ellis, 2006) • S.O.X. Sound eXchange – stretch (cross fade) implementation
• Windows Media Encoder – time compression • MFFM WSOLA v3.93
• Mach1 matlab implementation by Simon Tucker4 • PSOLA (Boersma & Paul, 2005)
Figure 15. Time-compression implementation test grid
Several participants listened to the samples and judged the PSOLA implementation as being the most intelligible implementation. Other implementations became more quickly unintelligible at higher speedup factors compared to the PSOLA implementation. Some people found the Mach1 implementation more tiring to listen to as they needed to concentrate more due to the changing compression rate.
The matlab implementations were, besides being less intelligible at higher speeds, not usable for relatively large audio recordings due to their memory requirements.
The original Mach1 implementation by Covell et al. (1998a; 1998b) showed good results on the samples provided by the authors5 but unfortunately was not publicly available. A Matlab implementation6 derived from the original paper by Covell et al. (1998a; 1998b) was tested. This implementation had problems with speeds larger than 2.0 times the original speed. The sped up output sounded like their samples were shifted past the start of their preceding samples, making them sound like reversed speech. Some of the parameters from the script where adjusted to change this behavior. The adjusted script was an improvement but still showed problems with larger audio samples and compression larger than 2.0,
3
http://sourceforge.net/projects/mffmtimescale/
4
http://ir.shef.ac.uk/simon/
5
http://cobweb.ecn.purdue.edu/~malcolm/interval/1997-061/
34
while the PSOLA implementation sounded consistent when used on both small and large samples and all compression rates.
4.4 Overlap browser
Before discussing the actual user interface of the overlap browser, we first need to look at how the audio playback is handled by the overlap browser.
4.4.1 Interaural Time Difference
Different methods, both experimentally measured HRTFs and HRTF models, were tested to create binaural audio to see which method would be most useful for our Overlap Browser implementation. It was decided was to use the spherical head ITD model as described by Equation 1 in section 2.2.6 on the following observations:
• The spherical head ITD model is very simple, yet powerful • The ITD is the main primary cue for azimuth
• Measured HRTFs cause a drop in the low frequencies due to the use of small speakers during the measurements, causing the audio to sound processed and less realistic
• We do not need binaural audio that is located at exact locations, we only need spatial segregation of the audio streams
An azimuth of -90 degrees would mean that the sound source is located left of the listener, 0 degrees is right in front of the listener and +90° is on the right side of the listener. When the sound source is placed at +45° of the listener, a wave propagation time of 343 m/s and head radius of 0.0875 meters are assumed, and the left channel of the stereo audio stream is delayed by 0.38ms compared to the right channel. With a 16 KHz recording this would mean that the left stereo channel starts playing the same monaural recording
0.00038 16000
⋅
≈
6
samples later than the right stereo channel. When the sound source is located at -45° azimuth, the right channel is delayed by 6 samples.4.4.2 What to overlap?
We will refer to a binaural audio stream as overlapped audio, since the final multiple monaural audio streams are played back in parallel (see Figure 17). These monaural audio streams are not just mixed together but are first given a special location using the ITD to enhance the segregation of the audio streams in order to increase intelligibility.
When we want to reduce the playback time of an audio recording by simultaneously playing back parts of a recording using binaural audio, or “overlap” as we called it, different strategies can be chosen:
• Overlap speakers and remove pauses
• Overlap parts of a recording where there are not many speakers speaking simultaneously
• Overlap fixed meeting parts without looking at the content
35 same location is even worse. Audio streams blend together to a single auditory stream when their acoustic features, pitch and location, are similar (Stifelman, 1994).
The following image shows how a binaural audio stream is created out of n
monaural audio streams.
Figure 16. Schematic presentation of how a binaural audio stream is created from n monaural audio streams
The output of the spatial placement in the case of ITD is a stereo signal. The mix of the n processed audio streams also is a stereo signal and is presented to the listener.
The question that remains is how audio can be best overlapped in order to reduce the playback time of the audio recording while not removing any audio and maintaining intelligible audio.
4.4.3 Overlap speakers and remove pauses
36
P
a
rt
ic
ip
a
n
ts
Figure 17. Overlap speakers and pause removal. Each block represents a segment of speech
In Figure 17 the pauses are removed while the speakers are completely overlapping each other. In this case the playback time was reduced by 37.5%. A big problem with overlapping speakers and removing pauses is that there is no interaction left between the speakers. Meetings can be seen as dialogues. Dialogues exhibit anaphora, discourse structure and coherence (Jurafsky & Martin, 2000). Removing or reducing pauses for each individual participant extensively damages the discourse structure. The time at which participants speak is adjusted and this removes the relationship of statements and the response to these statements. Participant A might be talking about topic 1 while participant B might be responding to a statement of topic 3. The number of participants is also an issue. The meetings we used all contain 4 meeting participants; in many real meetings this number can be even higher. Stifelman (1994) reports a strong decrease in performance when more than 2 streams are presented to users, so even though we would like to use simultaneous playback of audio to decrease the playback time, using too many simultaneous streams makes the speech unintelligible.
4.4.4 Overlap parts with least amount of overlap
37 Figure 18. Moving average of the per person speaking time during meetings IS1008c and IB4010
These peaks can potentially be used to overlap with other peaks to prevent too much simultaneous speech while preserving the conversation structure during these peaks. It can also prevent overlapping the same speaker. As people usually do not interrupt while someone else is speaking and the duration of these peaks is reasonably long, overlapping these peaks would result in 2 streams where the majority of the simultaneous speech comes from 2 different speakers. If, for instance, we have a look at the green peak of meeting IS1008c in Figure 18, we see that the speaker is only overlapping with someone else for 3.5% of this segment. There is 15.6% no speech and 80.8% of the time one speaker is speaking. The start and end-times for this segment were determined by manually choosing the start and end-time of the “mini-presentation” that is represented by this green peak.
Figure 19. Percentages of overlap of one specific time segment and the average of 11 randomly chosen meetings
38
participants speaking at the same time often exist of laughter and contain little speech information but can interfere with the another stream when overlapped with it.
Figure 20. Moving average of the per person speaking time during meetings IB4001 and IB4003
When we look at Figure 20 we see that not all meetings follow the structure as shown in Figure 18. The meetings in Figure 20 do not contain peaks that indicate one meeting participant is dominating during a certain time frame. Many meetings differ in structure and thus overlapping peaks is not an option that can be applied to every meeting.
4.4.5 Overlap fixed parts
As the intelligibility decreases significantly when more than 2 speakers are overlapped and there is a reasonable low percentage of overlapping speech during meetings (see Figure 19), the decision was made to cut meeting recordings in half and to overlap these two halves with each other. This method does still allow overlapping a speaker with him/herself but we assumed that meetings are not long monologues and that the percentage of overlap of the same speaker is reasonably low.
Like the speedup browser, the overlap browser is quite similar to the baseline browser except that the overlap browser plays back two meeting halves simultaneously.
39
4.4.6 Pitch shifting
To reduce interference caused by having the same speaker speaking on both streams simultaneously, pitch shifting is performed on one of the streams. Whenever speaker X is speaking on one stream and this same speaker starts speaking on the other stream, the pitch of the stream where speaker X started speaking last is raised by one semitone.
Figure 21. Pitch shifting the binaural audio up one semitone
Two streams are played back simultaneously, each representing a different location and meeting half. In reality, four audio players are playing back the recorded meeting halves, for each meeting half a pitch-shifted version is played back synchronously with the original audio. These pitch-shifted versions are muted. When the pitch of one side needs to be raised, the original audio file is muted and the pitch-shifted version is un-muted (see Figure 21). The speech segmentation is used to detect when the same speaker is speaking in both meeting halves at the same time. The pitch shifted audio streams were raised by only one semitone to prevent users from getting confused by who suddenly started speaking, but still making it possible for the user to segregate the streams.
The speech segmentation cannot be used to detect when people with similar pitched voices are speaking simultaneously. To overcome this each participant’s voice should be analyzed to see which participants have similar pitched voices and use this information to change the pitch of one of the two audio streams. This was beyond the scope of this project.
4.4.7 The initial overlap browser implementation
40
overlap browser is playing back two meeting halves, the user interface basically exists out of two baseline meeting browsers.
Figure 22. Initial overlap-browser implementation
This initial implementation has the views and controls of the first half of the meeting on the left side and the views and controls of the second half on the right side. As we can see, instead of dividing the meeting exactly half way, the meeting was divided at a point where a different speaker started presenting his or her presentation. This was done to prevent users from suddenly starting in the middle of a conversation during the second half of the meeting.
A difference from the baseline and speedup browsers is the substitution of the participant photos by close-up videos of the meeting participants. This change was made to make it easier for the user to see who is speaking on which side and possibly make use of lip movements to enhance the intelligibility of the speech, as is suggested by Cherry (Arons, 1992a; Mullins, 1996). The video option was not used in the speedup browser because the videos would need to be sped up. This was technically unfeasible. Two additions to this browser are the buttons left and right of the play button. These buttons are labeled “Huh?” and where added to give users the ability to repeat the previously played 5 seconds of the meeting while muting either the left or right side. Users can use this option, e.g. when speech from one meeting half gets unintelligible due to speech from the other meeting half.
41 side moves 10 minutes into the second half of the meeting. This was done to make sure each user is presented with the same overlapped speech parts, even when their browsing behavior differs.