International Journal of Scientific Research in Computer Science, Engineering and Information Technology © 2017 IJSRCSEIT | Volume 2 | Issue 3 | ISSN : 2456-3307
Lab on Desk- RUI Desktop Application
Pavankumar Naik, Jagadeesh Meti, Komal Jain, Netravati H, Nisha Katnalli , Sneha U Sajjanar
Rajehwari Gamangatti
Department of computer Science and Engineering, SKSVMACET, Laxmeshwar, Karnataka, India
ABSTRACT
The Educational sector is very important in the development of our country. An overview trends which says that there is increase in students who are opting for the science streams .On the other hand, if we look into parameters depicting the status of elementary, primary and secondary schools, there has been a steady decline in reading levels and science education that forms the base of their future, making it difficult for the students to comprehend and gain vital concepts. For a person that has to be scientific and technologically literate there should be strong foundation in science and one should have practical knowledge, laboratories should complement school courses throughout the school phase. In almost all schools labs are not mandatory unless in higher secondary classes. Due to the poor quality of education, the students are moving from government to private schools. To reduce this kind of situation and to make the students interesting we are proposing the standalone desktop application, which is a web application, which consists of simple experiments and demonstration relevant to the curriculum of students from class VIII-X. With the need for a single computer, which can be provided by the deploying organization, this RUI application will be developed with demonstrations, explanation of the concepts and relating their relevance to school curriculum in an interactive way.
Keywords : RUI, HTML, JavaScript, DOM, DFD, E-R Diagram
I.
INTRODUCTION
India is developing country and Education plays the very important role. The researches, which say that there is gradually decreasing of students in government schools due to the poor quality of teaching and the students, are migrating to the private schools. Under this context and buoyed by the Government of India’s push for digital growth, by proposing the standalone desktop application which consists of simple experiments and demonstration of this experiments in a simple steps for VIII-X class which gives the students theoretical knowledge as well as the practical knowledge.
Standalone desktop application which needs a single computer, which can be provided by the deploying organization, this RUI application will be developed with demonstrations, explanation of the concepts and relating their relevance to school curriculum in an interactive way. The Govt. of India is making now
every village digitalize hence this standalone application can be used initially later it can be used as the web application by upgrading the experiments.
1.1
Web Application
In computing, a web application or web app is a client– server software application in which the client (or user interface) runs in a web browser. Common web applications include webmail, online retail sales, online auctions, wikis, instant messaging services and many other functions.
In earlier computing models like client–server, the processing load for the application was shared between code on the server and code installed on each client locally. In other words, an application had its own pre-compiled client program, which served as its user interface and had to be separately installed on each user's personal computer. An upgrade to the server-side code of the application would typically also require an upgrade to the client-side code installed on each user workstation, adding to the support cost and decreasing productivity. In addition, both the client and server components of the application were usually tightly bound to a particular computer architecture and operating system and porting them to others was often prohibitively expensive for all but the largest applications.
In contrast, web applications use web documents written in a standard format such as HTML and JavaScript, which are supported by a variety of web browsers. Web applications can be considered as a specific variant of client–server software where the client software is downloaded to the client machine when visiting the relevant web page, using standard procedures such as HTTP. Client web software updates may happen each time the web page is visited. During the session, the web browser interprets and displays the pages, and acts as the universal client for any web application.
In the early days of the Web each individual web page was delivered to the client as a static document, but the sequence of pages could still provide an interactive experience, as user input was returned through web form elements embedded in the page markup. However, every significant change to the web page required a round trip back to the server to refresh the entire page.
HTML5 was finalized, which provides graphic and multimedia capabilities without the need of client side plug-ins. HTML5 also enriched the semantic content of documents. The APIs and document object model (DOM) are no longer afterthoughts, but are fundamental parts of the HTML5 specification. WebGL API paved the way for advanced 3D graphics based on HTML5 canvas and JavaScript language. These have significant importance in creating truly platform and browser independent rich web
Through Java, JavaScript, DHTML, Flash, Silverlight a nd other technologies, application-specific methods such as drawing on the screen, playing audio, and access to the keyboard and mouse are all possible. Many services have worked to combine all of these into a more familiar interface that adopts the appearance of an operating system. General-purpose techniques such as drag and drop are also supported by these technologies. Web developers often use client-side scripting to add functionality, especially to create an interactive experience that does not require page reloading. Recently, technologies have been developed to coordinate client-side scripting with server-side technologies such as ASP.NET, J2EE, Perl/ Plack and PHP.
Examples of browser applications are simple office software (word processors, online spreadsheets, and presentation tools), but can also include more advanced applications such as project management, computer-aided design, video editing and point-of-sale.
1.2
Proposed System
In our proposed system, we have developed web application for the school students, which consists of experiments related to the curriculum of the students from standard VIII-X. Each experiment, which are demonstrated with the help of video, images and with their respective description.
1.3
Problem Statement
Lab on Desk-RUI Desktop Application for Government school Students using Standalone Desktop Application.
1.4
Objective of the project
II.
LITERATURE SURVEY
An overview of the trends in higher education sector in India depicts a steady annual 13% increase in the number of students opting for Science streams. On the other hand, if we look into parameters depicting the status of elementary, primary and secondary schools, there has been a steady decline in reading levels and science education that forms the base of their future is filled with 90% facts, making it difficult for the students to comprehend and gain vital concepts. For a person to be scientific and technologically literate a strong foundation in science is must and to achieve the same, laboratories should complement science course throughout the school phase, motivating to experiment and experience the concepts learnt. However, in almost all schools, labs are not mandatory unless in higher secondary classes, nipping curiosity and basic understanding of students in the bud. Average attendance of students in Govt. Schools is around 70% with rural schools still lagging at 55%. Annually there is a 31% increase in students migrating from government to private schools due to poor quality of education, despite not being able to accommodate the exorbitant fee structure of private institutions.
Under this context and buoyed by the Government of India’s push for digital growth, propose developing a standalone desktop application with simple science experiments & demonstrations relevant to the curriculum of students from class III – VIII and can be provided free of cost as part of CSR Initiatives. With the need for a single computer, which can be provided by the deploying organization, this RUI application will be developed with demonstrations, explanation of the concepts and relating their relevance to school curriculum in an interactive way .As the Govt. of India is making every village digital, this application developed initially as a standalone application can later be upgraded to a web application with avenues to increase the number and types of experiments. This application can further be enhanced to include modules on Mathematics, Social science etc. in future and introducing such interactive applications increase the curiosity of students, thereby increasing attendance in Government Schools.
III.
FLOW CHART
3.1 Flow Chart
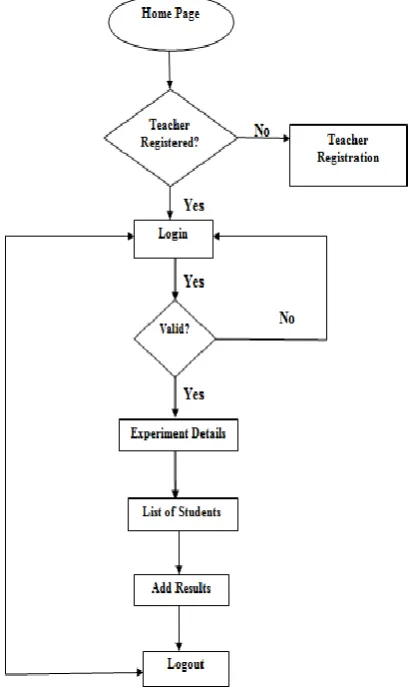
A flowchart is a graphic representation of a logic sequence, work or manufacturing process, organization chart, or similar formalized structure. The flowchart gives the visually the flow of data through an information processing systems.
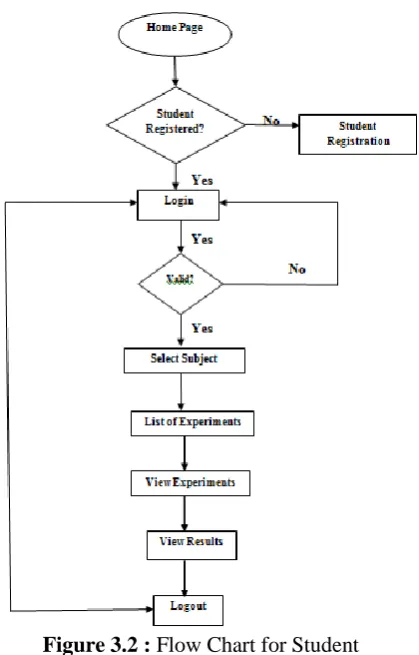
Figure 3.2 : Flow Chart for Student
The figure 4.1 and 4.2 shows the flowchart for using web application. Here the users are teachers and students. If users are already registered to the application, they can login with credentials or else the registration form appears. Firstly, the teacher has to register with name, gender, standard, username and password that is unique. After registering, the teacher has to login with username and password. After authenticating the username and password, if it is wrong the teacher has to login again with appropriate username and password. If it is correct, teacher can access the web application.
After the teacher registration, student can register under the registered teacher. The student has to register with some required details like name, last name, standard, teacher, username and password. After registering, the student has to login with username and password. After authenticating the username and password, if it is wrong student has to login again with appropriate username and password. If it is correct, student can access the contents of experiments from web application.
Teacher can view the student profile with list of students registered under their name and standard. In
addition, the teacher can view the student performance and it shows the completion of experiments.
Student can view the list of experiments, which belongs to their standard. When the list of experiments appears, student has to choose any of experiments. It shows the demonstration of experiment by video, image and text.
3.2 Data Flow Diagram
A Data flow diagram is a graphical representation of the flow of data through an information system, modeling its process aspects. A DFD is often used as a preliminary step to create an overview of the system without going into great detail.
A data flow diagram (DFD) is a significant modeling technique for analyzing and constructing information process. Data flow diagram (DFD) is a graphical representation of the “flow” of data through an information system. DFDs can also be used for the visualization of data processing (structured design). On a DFD, data items flow from an external data source or an internal data store to an internal data store or an external data sink, via an internal process. A DFD provides no information about the timing or ordering of processes, or about whether processes will operate in sequence or in parallel. It is therefore quite different from a flowchart.
Data-flow diagrams provide the end user with a physical idea of where the data they input ultimately has an effect upon the structure of the whole system from order to dispatch to report. How any system is developed can be determined through a data-flow diagram. With a data-flow diagram, users are able to visualize how the system will operate, what the system will accomplish, and how the system will be implemented. A designer usually draws a context-level DFD showing the relationship between the entities inside and outside of a system as one single step.
3.2.1 Student Flow Diagram
respective teachers to which they are interested. Based on student interest his performance is evaluated by teachers, they allot the marks for student in teacher profile, and students can view the marks for the particular experiment in student profile. This information is saved into the database and once all the things are done the student can logout.
3.2.2 Teacher Flow Diagram
Teacher registers with the required details are saved into the database. The teacher can login with the login credentials. After logging in to the application the login information of the teacher is verified, that whether the user already registered or not. The teacher can view the profile of the students after logging in. Teacher has to allot the marks for student in teacher profile and students can view the marks for the particular experiment in student profile.
Figure 3.4 : Data Flow Diagram for Teacher
3.3 ER Diagram
An
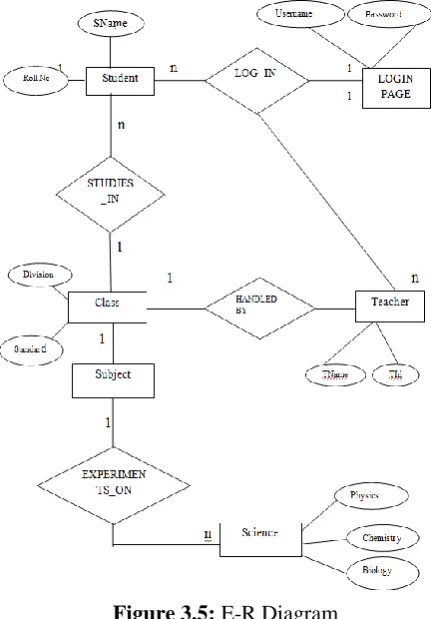
entity relationship model, also called an entity relationship(ER) diagram is a graphical entity is a representation of entities and their relationships to each other, typically used in computing about the organization of data within database or information systems. An entity is piece of data-an object or concept about which data is stored.ER diagram looks very much like a flowchart. It is the specialized symbols, and the meanings of those symbols, that make it unique.ER diagrams show the relationships of entity sets stored in database. An entity in this context is a component of a data. In other words, ER diagrams illustrate the logical structure of databases.
Figure 3.5: E-R Diagram
IV. TEST CASES AND THE RESULT
Testing is the process of evaluating a system or its component(s) with the intent to find whether it satisfies the specified requirements or not. In simple words, testing is executing a system in order to identify any gaps, errors, or missing requirements in contrary to the actual requirements.
4.1 Test Cases
4.1.1 Test Scenario Name :Login Pages Of Teacher And Student.
Description: There and two login pages teacher and student. It contains username, password and login button.
Test Case ID
Test Case
Expected Results
Actual Results
TC00
4.1.2 Test Scenario Name : Registration form for teacher and student.
Description :This scenario covers the functionality of registering new users.
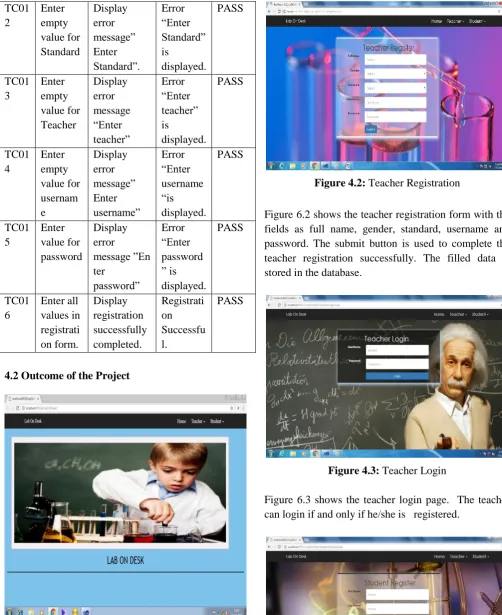
TC01
4.2 Outcome of the Project
Figure 4.1: Home Page
Figure 6.1 shows the home page of the web application with the sliding images and at the top right corner, there are menus as home, teacher, student.
Figure 4.2: Teacher Registration
Figure 6.2 shows the teacher registration form with the fields as full name, gender, standard, username and password. The submit button is used to complete the teacher registration successfully. The filled data is stored in the database.
Figure 4.3: Teacher Login
Figure 6.3 shows the teacher login page. The teacher can login if and only if he/she is registered.
Figure 6.4 shows the students registration form with the fields as first name, last name, standard, username and password. The submit button is used to complete the student registration successfully. The filled data is stored in the database.
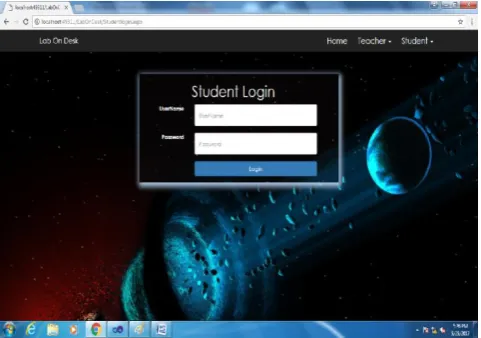
Figure 4.5: Student Login
Figure 6.5 shows the student login page. The student can login if and only if he/she is registered with required information. To login to the student profile, student has to login with login credentials as username and password
.
Figure 4.6: Experiment Details with Video
Figure 6.6 shows the experiment details of a particular selected subject. Student can view the list of experiments and can choose the experiment to be done.
Figure 4.7 : Experimental Images With Description and With Complete Button
Figure 6.7 shows the selected experiment with images and description and complete button is provided. When the experiment is viewed, the count gets incremented.
Figure 4.8: Teacher Profile
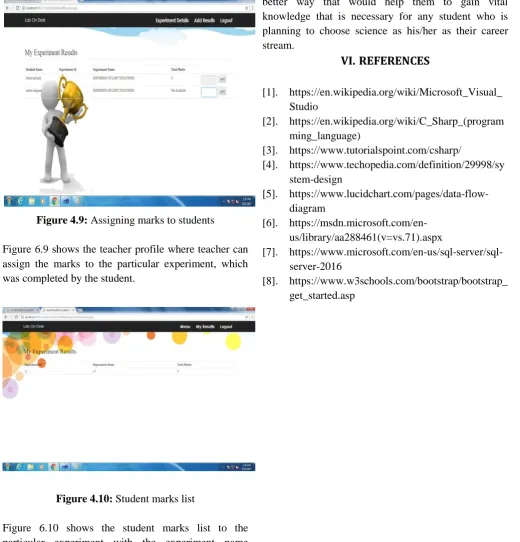
Figure 4.9: Assigning marks to students
Figure 6.9 shows the teacher profile where teacher can assign the marks to the particular experiment, which was completed by the student.
Figure 4.10: Student marks list
Figure 6.10 shows the student marks list to the particular experiment with the experiment name experiment id and marks obtained for completing that experiment.
V.
CONCLUSION
As the government of India is making every village digital, our project lab on desk is a web application, which can be later upgraded with avenues to increase the number and types of experiments. This application helps the students for understanding the experiments without the presence of teachers. This application will help the students to learn the concepts specified in a
better way that would help them to gain vital knowledge that is necessary for any student who is planning to choose science as his/her as their career stream.
VI.
REFERENCES
[1]. https://en.wikipedia.org/wiki/Microsoft_Visual_ Studio
[2]. https://en.wikipedia.org/wiki/C_Sharp_(program ming_language)
[3]. https://www.tutorialspoint.com/csharp/
[4]. https://www.techopedia.com/definition/29998/sy stem-design
[5]. https://www.lucidchart.com/pages/data-flow-diagram
[6]. https://msdn.microsoft.com/en-us/library/aa288461(v=vs.71).aspx
[7]. https://www.microsoft.com/en-us/sql-server/sql-server-2016