DOI : https://doi.org/10.32628/CSEIT195233
Brain Tumour Detection Using Deep Learning Techniques
Dr. P. Tamije Selvy, V. P Dharani, A. Indhuja
Computer Science and engineering, Sri Krishna College of Technology, Coimbatore, Tamilnadu, India
ABSTRACT
In recent years the occurrence of brain tumor has exaggerated in large amount among the people. Gliomas are one of the most common types of primary brain tumors that represent 30% of all human brain tumors and 80% of all malevolent tumors. The grading system specified by the World Health Organization (WHO) is deployed as a standard mechanism for medical diagnosis, prognosis, and the existence forecast so far. The main ideology of this paper is to propose and develop reliable and typical methods to detect the brain tumor, extract the characteristic of it and classify the glioma using Magnetic Resonance Imaging (MRI). The developed model helps in the detection of brain tumor automatically and it is implemented using image processing and artificial neural network. The most basic part of image processing is the analysis and manipulation of a digitized image, especially in order to improve its quality. In this proposed system, the Histogram Equalization (HE) technique is used to improve the contrast of the original image. Then the pre-processed image is subjected to feature extraction using Gray Level Co-occurrence Matrix (GLCM). The obtained feature is given to Probabilistic Neural Network (PNN) classifier that is used to train and test the performance accuracy in the perception of tumor location in brain MRI images. By implementing this approach, PNN classifier has procured accuracy of about 90.9%.
Keywords : Glioma, MRI, Neural network, Texture
I. INTRODUCTION
The brain is composed of three main parts cerebrum, cerebellum and medulla oblongata and it is considered as the central part of the nervous system.
Glioblastoma Multiforme (GBM) [1] is the most frequent primary brain tumors that originate in glial cells. Glial cells are the building-block cells of the connective, or supportive tissue in the Central Nervous System (CNS). Glial cells provide the structural backbone of the brain and support the performance of the neurons (nerve cells), that are accountable for thought, sensation, muscle management, and coordination. The median survival of GBM is 12-16 months in spite of multimodal
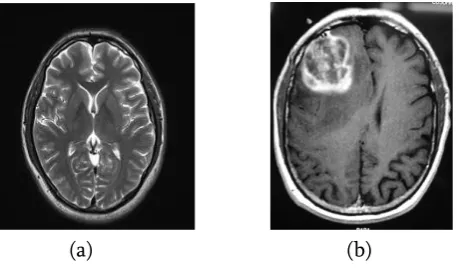
(a) (b)
Fig. 1. (a) Normal MRI brain (b) MRI brain with Glioblastoma tumor
According to World Health Organization (WHO) [2], gliomas are classified into multiple grades that reflect the degree of malignancy they are grade I, grade II, grade III, Grade IV.
A. Grade I Glioblastoma
Grade I gliomas are considered as low-grade gliomas. Grade I tumors are well confined and often surgically curable. Low-grade glioma do not spread outside, but they grow inside the brain tissues.
B. Grade II Glioblastoma
Grade II gliomas are considered as low-grade gliomas like Grade I gliomas [3]. Grade II gliomas are the slowest growing and least malignant. Grade II tumors diffuse, infiltrating lesions with a marked potential, over time, for progression towards high-grade malignant tumor. These gliomas are often found in cerebral hemispheres.
C. Grade III Glioblastoma
Grade III tumors are considered malignant and grow at a moderate rate and show chemo sensitivity and better prognosis. Grade III patients are treated with radiation and chemotherapy routinely.
D. Grade IV Glioblastoma
Grade IV tumors, such as glioblastoma multiforme, are fast growing and are the most malignant of primary brain tumors. It is also the most resistant to current standard treatment i.e. surgery, followed by radiation and chemotherapy. The most common subtype of glioma is Astrocytoma. Grade IV Astrocytoma is called Glioblastoma [3].
The prediction of GBM prognosis has not acquired good accuracy in previous studies.To improve the
overall performance of the detection and
classification by means of quality parameters, image enhancement is applied to the MR images [4]. Quantitative analysis has been done by adaptive histogram equalization. The proposed work integrates the study of feature extraction, feature selection and classification for the purpose of automatic brain tumor detection [5]. Feature extraction is performed for accurate diagnosis analysis. The feature extraction is done to reduce the time and cost of the classification and for the accurate result, this is done by using Gray Level Concurrence Matrix (GLCM). The classification is done to detect the accuracy and to differentiate between the Glioblastoma (GBM) and other brain tumors.
II. RELATED WORKS
Nitish Zulpe et al.,(2012) proposed a automated recognition system, which can classify the type of the brain tumor. The features are extracted by using GLCM that examines the texture that considers the spatial relationship of the pixels. GLCM is a matrix where number of rows and columns is equal to gray levels in an image. About 14 features were extracted from the occurrence matrix that contains information about the image. In classification two layer feed forward network is used which consists of 44 input neuron, 10 hidden neuron and 4 output neuron [8].
A. Chaddad et al., proposed a novel method for glioblastoma detection using Gaussian Mixture Model (GMM). With help of these features the GBM can be identified. GBM is found to be best in terms of robustness, complexity and discrimination. Three classifier were implemented namely Naïve Bayes (NB), Support Vector Machine (SVM) and Probabilistic Neural Network (PNN)[12].
Venkateshappa et al.,(2017) discussed about the fast algorithm for image registration. The input images are processed with Gaussian filters and features are extracted from dual tree sub band. The input image X is decomposed into eight sub bands. It consists of row processing and column processing filters. Algorithm is verified for its performances with reference satellite image and the results obtained demonstrate the novelty in the algorithm proposed [14].
III. PROPOSED SYSTEM
The purpose of this paper is to detect and classify the glioblastoma tumor from present in the MRI images. The basic block diagram contains modules like preprocessing, feature extraction and classification as shown in Fig 2. This system extracts the features from MRI brain images and detects the occurrence of glioblastoma. The system consists of two main phases i) Feature Extraction and ii) Classification.
Fig. 2. Basic block diagram
A. Data Collection
The MRI brain tumor dataset was downloaded from GitHub. GitHub Campus Experts are one of the primary ways that GitHub funds student oriented events and communities, Campus Experts are given access to training, funding, and additional resources to run events and grow their communities. To become a Campus Expert applicants must complete an online training course consisting of multiple modules designed to grow community leadership skills. The dataset consists of about 150 images where it is divided to training and testing images for better detection process.
B. Image Preprocessing
Preprocessing is an image enhancement
technique that improves the quality of an image by suppressing the unwanted distortions or enhancing some image features that can be used for further processing [6].
The intensity values are calculated as shown in the following equation (1).
2 1
0 x
x
i
j i
i
N
O
=
=
(1)
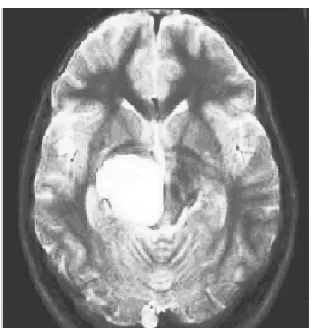
the output value or equal to it. Histogram Equalization [7] is a method used to process an image in order to increase the contrast of the image by modifying the intensity distribution of the histogram. Histogram Equalization allows the area of lower contrast to gain higher contrast. Fig 3. represent the image with high contrast for further processing after the preprocessing using histogram equalization.
Fig. 3. Preprocessed image using Histogram Equalization
C. Feature Extraction
To increase the performance of the classification, only the sensitive features should be used as the input to the classifier. Thus, feature extraction becomes an important task in the classification system. It can not only reduce the dimensionality of data but also reduce the computational cost and improve the classification performance[7]. In this paper, the Gray Level Co-occurrence Matrix (GLCM) [10] is used to extract the specific texture features. GLCM was used to perform two-dimensional texture analysis. By calculating the pairs of a pixel with specific values and in a specified spatial relationship occur in an image the texture of an image can be characterized, creating a GLCM and then features of texture are extracted from this matrix. Several statistics can be derived from graycomatrix using graycoprops. The texture [15] of an image can be identified by
considering some of the statistics. The following Table I. lists the statistics of the texture analysis.
TABLE I. LIST OF STATISTICS FOR TEXTURE ANALYSIS
STATISTICS DESCRIPTION
Contrast Local variation in gray level co-occurrence matrix.
Correlation Joint probability occurrence of the specified pixel pairs.
Energy Provides the sum of squared
elements.
Homogeneity Measures the closeness of the distribution of elements.
CONTRAST:
Measure the spatial frequency of an image and it difference moment of GLCM. It is the difference between the highest and the lowest valves of a contiguous set of pixels. It is measures the amount of local variations present in the image
The contrast of the image can be calculated by the formula shown in equation (2),
−
−= − =
−
= 1
0 1
0
2
) (
)
(
mi n
j
y x f
CONT
x
y
CORRELATION:
Measures the joint probability occurrence of the pixel
pairs. It is a statistical measure that calculates
the likelihood of two events occurring together. Joint
probability is the probability of event Y occurring at the same time that event X occurs.
The correlation of the image can be calculated by the formula shown in equation (3),
= uniformity. Detects disorders in textures. The maximum value reached in energy is equal to one. The energy of the image can be calculated by the formula shown in equation (4),1 ( , )
Measures the image homogeneity as it assumes larger values for smaller gray tones differences in pair elements. It is more sensitive to the presence of near diagonal element in the GLCM. It has maximum value when all elements in the image are same. Homogeneity decrease If contrast increase while energy kept constant.
The homogeneity of the image can be calculated by the formula shown in equation (5),
are depicted in the Table II
TABLE II. FEATURE EXTRACTION VALUES USING GLCM FOR A NORMAL BRAIN IMAGE AND GLIOBLASTOMA BRAIN TUMOR IMAGE
Type of Probabilistic Neural Network (PNN) [9] classifier to predict whether the brain tumor is glioblastoma or not. PNN is commonly employed in classification problem, [9] once an input image is present, the first layer computes the gap from the input vector to the training input vectors. This produces a vector wherever its components indicate how close the input is to the training input. The second layer sums the contribution for every category of inputs and produces its net output as a vector of possibilities. Finally, a complete transfer operate on the output of the second layer picks the most of those possibilities, and produces a one (positive identification) for that category and a zero (negative identification) for non-targeted categories. PNN is adopted because it has many advantages. Its training speed is many times faster than Back Propagation (BP). Training is easy and instantaneous. Since the training and running manipulation can be implemented using matrix manipulation, PNN is very fast [13]. The accuracy obtained at the end of classification process was about 90.96% with the training time of about 3 seconds.
IV.EXPERIMENTAL RESULT
About 4 GLCM features are calculated for about 100 samples and the accuracy, specificity and sensitivity
(3)
(4)
are calculated from the Probabilistic Neural Network (PNN) algorithm. The performance analysis of PNN can be calculated using the formula depicted in equation (6), (7) and (8)
Accuracy = (((TP+TN)) / (TP+TN+FP+FN))*100 (6) Specificity = (TN/ (TN+FP))*100 (7) Sensitivity = (TP / (TP+FN))*100 (8)
Where,
TP= True Positive TN=True Negative FP=False Positive FN=False Negative
The Table III explains about the true positive, false positive, true negative and false negative terminologies.
TABLE III. PREDICTION COMPARISON
Terminologies Actual value Prediction
Outcome
TP Yes Yes
TN Yes No
FP No Yes
FN No No
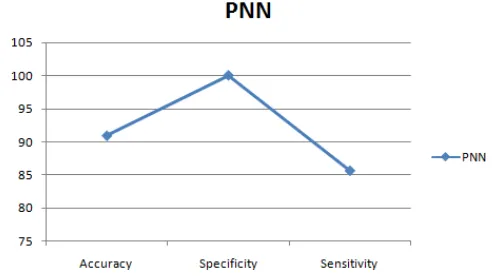
Accuracy, Specificity and Sensitivity are calculated by using these values for Probabilistic Neural Network (PNN). The values are shown in Table IV and the performance analysis is shown in Fig 4.
TABLE IV. PERFORMANCE VALUES FOR PNN
TERMINOLOGIES VALUES
Accuracy 90.96
Specificity 100
Sensitivity 85.75
Fig. 4. Performance analysis for PNN classifier
V. CONCLUSION
A new novel approach for detection of GBM is developed. GBM has a high mortality rate. There is no easy way to detect and prevent the disease at an early stage. Hence, the system is proposed for automatic detection of glioblastoma. The detection process consists of two phases. GLCM is used to increase performance and reduce the time or prediction. The accuracy, specificity, sensitivity are obtained from the PNN classification algorithm. From the collected dataset, 95 images are given for training dataset and the remaining images are tested according to the results obtained from the training network. The accuracy of the system is about 90%, which is more effective compared to other algorithms. In future, accuracy, specificity and sensitivity can be further increased with the help of efficient optimization techniques such as Particle Swarm Optimisation (PSO), Ant Colony Optimisation (ACO).
VI. REFERENCES
[1]. Anupurba Nandi,” Detection of human brain
tumour using MRI image segmentation and
morphological operators”, IEEE International
Conference on Computer Graphics, Vision and Information Security (CGVIS),2015
[2]. Ishmam Zabir, Sudip Paul, Md. Abu Rayhan, Tanmoy Sarker, Shaikh Anowarul Fattah, and
Detection and Segmentation from Multi-Modal MRI Images Based on Region Growing and
Level Set Evolution”, IEEE International WIE
Conference on Electrical and Computer Engineering (WIECON-ECE), 2015
[3]. Qingneng Li, Zhifan Gao, “Glioma
Segmentation With a Unified Algorithm in
Multimodal MRI Images”,IEEE Access, 2018
[4]. Mohd Fauzi Othman and Mohd Ariffanan
Mohd Basri, “Probabilistic Neural Network For
Brain Tumor Classification”, IEEE computer
society Second International Conference on Intelligent Systems, Modeling and Simulation, 2011
[5]. Jinwen Yang, Weihe Zhong and Zheng Miao,
“On the image enhancement histogram processing”, IEEE international conference on
Informative and Cybernethics for Computer Social System(IFCSS), 2016
[6]. Bedi S.S and Rati Khandalwel, “Various Image
Enhancement Techniques-A Critical Review”,
International Journal of Advanced Research in Computer and Communication Engineering, 2013.
[7]. Qiang Tian and Shuai Tian, “Radiomics
Strategy for Glioma Grading Using Texture
Features From Multiparametric MRI”
International Society for Magnetic Resonance in Medicine, 2018
[8]. Nitish Zulpe and Vrushsen Pawar, “GLCM
Textural Features for Brain Tumor
Classification”, IJCSI International Journal of
Computer Science Issues, Vol. 9, Issue 3, No 3, May 2012
[9]. P.Sangeetha ,” Brain Tumor Classification
Using PNN And Clustering”, IJIRSET
International Conference on Innovations in
Engineering and Technology (ICIET’14),2014
[10]. S. Ananda Resmi, Tessamma Thomas,
IF12A05-MICR1, “Segmentation and Texture Analysis of
Brain MRIs using Statistical Features for low
grade and high Grade Glioma detection”,
Special issue on Information Fusion in Medical Image Computing Systems, Information Fusion Journal Elsivier.
[11]. Ahmad Chaddada , Pascal O. Zinnb and Rivka
R. Colena,” radiomics texture feature extraction for characterizing gbm phenotypes using glcm”,
IEEE 12th International Symposium on Biomedical Imaging(ISBI), 2015
[12]. A. Chaddad, P. O. Zinn, et R. R. Colen, “ Brain
tumor identification using Gaussian Mixture
Model features and Decision Trees classifier,”
IEEE 48th Annual Conference on Information Sciences and Systems, pp.1 4, 2014.
[13]. P.Sangeetha ,” Brain Tumor Classification
Using PNN And Clustering”,IJIRSET
International Conference on Innovations in
Engineering and Technology (ICIET’14),2014
[14]. Venkateshappa and P. Cyril Prasanna Raj,” Fast
Algorithm for Multimodal Image Registration
with DTCWT”, Indian Journal of Science and
Technology, Vol 10(3), January 2017
Cite this article as :