CSEIT172562| Received:12Sep 2017 | Accepted:30Sep2017 | September-October-2017[(2)5: 541-546]
International Journal of Scientific Research in Computer Science, Engineering and Information Technology © 2017 IJSRCSEIT | Volume 2 | Issue 5 | ISSN : 2456-3307
541
Evaluation of Speaker Recognition System Using Different
Distance Metrics
1Sukhvinder Kaur, 2J. S. Sohal, 3Monica 1,3SDDIET, Barwala, Golpura-134009, Haryana, India
2Director, LCET, Ludhiana-141113, Punjab, India
ABSTRACT
In today’s world scenario, speaker recognition system is very popular in voice verification for identity and access control to services. In this paper, speaker identification and verification is done with the help of feature extraction and different matching algorithms. In new approach for speaker recognition system, speech signals are first framed and then compressed using DWT for noise reduction and better sampling frequency. Furthermore, features of compressed signal are extracted with the help of Mel frequency Cepstral Coefficients (MFCC) and Nonlinear Energy Operator (NEO). These features are further used for identification and verification of speaker’s voice. The distance metrics incorporated for feature matching are Delta Bayesian Information Criteria (delta BIC), Kullback-Leibler Distance Metric (KL2), and T-Test metric. At the end, results are evaluated with Detection Error Tradeoff (DET) curve and Receiver Operator Characteristics (ROC) curve by finding the area under curve (AUC). The best result is shown by T-Test metric with MFCC feature.
Keywords : Bayesian Information criteria (BIC); Kullback-Leibler Distance Metric (KL2); T-test Distance Metric; Mel Frequency Cepstral Coefficients (MFCC); Nonlinear energy operator (NEO); Detection Error Tradeoff(DET); Receiver Operating Characteristics (ROC); Area Under Curve (AUC).
I.
INTRODUCTION
Speaker recognition is the process of automatically recognizing the identity of speaker on the basis of individual information extracted from speech signals. Speaker recognition process includes two steps: Speaker identification and Speaker verification. Speaker identification is the process of extracting the features associated with the speaker[1][2]. For speaker identification, test speaker’s features are compared with the data base features. Speaker verification, on the other hand, is the process of accepting or rejecting the speaker identity by matching algorithm based on their feature. The system we are introducing is text independent; it only works on the features extracted from the speaker regardless of the wording used. This is less accurate than the text dependent system but its simplicity in access makes it more popular. Beyond difficulties there are number of applications of speaker recognition system. Speaker Recognition makes it possible to use the speaker's voice to verify their identity and control access to services such as voice dialing, banking by telephone, telephone Shopping,
database access services, information services, voice mail, security control for confidential information areas, and remote access to computers.
It can be an essential pre-processing task for speech and speaker recognition systems. In fact, the Automatic speech recognition performance, which can be more reliable with the application of model adaptation and noise reduction, can be improved using segments relatively homogeneous and short[2].
In this paper, section 1 includes the introduction of the system; Section 2 describes proposed speaker recognition system including feature extraction and feature matching algorithms. The results and discussion having DET and ROC curve with AUC are incorporated in section 3. Finally, conclusion and future scope is described in the last section.
II.
SPEAKER RECOGNITION SYSTEM
Volume 2 | Issue 5 | September-October-2017 | www.ijsrcseit.com | UGC Approved Journal [ Journal No : 64718 ]
shown in figure 1. All speaker recognition systems have to serve two distinguished phases. The first one is referred to the enrolment or training phase, while the second one is referred to as the operational or testing phase. In the training phase, each registered speaker has to provide samples of their speech so that database can be prepared. In case of speaker verification systems, in addition, a speaker-specific threshold is also computed from the training samples. In the testing phase, the input speech is matched with stored database and a recognition decision is made[1].
Figure 1.Speaker recognition proposed model
We have used delta BIC, KL2, T-test distance metric for matching of features extracted from speaker to the features present in database. The two features that are used for matching are MFCC and NEO.
Framing of Input Signal
The MATLAB version used is MATLAB (R2007b). As the sampling frequency of input speech signal is high and execution time is also very high. To save the execution time of speech signal we have used the compression algorithm DWT[3]. The main objective of this algorithm is to eliminate redundancy from the input data.
In DWT a time-scale representation of a signal is obtained by digital filtering techniques[3]. A low
frequency component of a signal is more significant than high frequency components since the low frequency components have maximum information content. The DWT is computed by successive low pass filtering and high pass filtering of the discrete time domain signal[3].
By applying DWT, the signal is compressed in the ratio of 2:1 and its frames are shown in figure 2. The strength of compressed signal is also increased with reduced noise.
Figure 2. Framing of speech signal
In speaker recognition, speech is major ingredient, which has number of features in it such as Pitch, loudness and timber. To work on particular feature speech signal is split up into smaller frames and the frames features are worked upon. As there is redundant information is present in speech signal, therefore, to take out important and useful information, feature extraction techniques are applied.
Feature Extraction
This is one of the most important blocks in Speaker recognition system. Perceptual Linear Prediction (PLP) coefficients, Wavelet transform based features, Linear Predictive Coefficients (LPC), Wavelet packet based features and Mel Frequency Cepstral Coefficients (MFCC) are the widely used features in speaker recognition system. In this paper we have used two features for identification. One of them is MFCC and other one is NEO.
melody, is a unit of pitch. It is defined to be equal to one thousandth of the pitch of a simple tone with frequency of 1000 Hz with an amplitude of 40 dB above the auditory threshold [1]. Equation 1 shows the relation between frequency in Hz and pitch in Mels[1].
( ( (1) (1)
The block diagram of MFCC computation is shown in figure 3
Figure 3.Block Diagram for MFCC Computation
Non-Linear Energy Operator
Amplitude modulation- Frequency modulation (AM-FM) of speech signal plays an important role in speech perception and recognition. The AM-FM model has been successfully used in various areas of signal processing[4]. An approach is to use a nonlinear energy operator (NEO) to track the energy required to generate an AM-FM signal and separate it into amplitude and frequency components. The nonlinear differential energy operators like Teager-Kaiser Energy Operator (TKEO) can detect formant AM-FM modulations by estimating the product of their time varying amplitude and frequency[4]. The Teager Energy Operator is considered a very high-resolution energy operator. The speech resonances can be modelled as AM-FM signals so demodulate the speech signals we have to study the AM-FM Signals in terms of nonlinear energy operators or in other words if we can demodulate the AM-FM signals we can easily extend our results for the so called speech signals. Instead of going through the detailed mathematical analysis of the algorithms, we show the simulation results of those algorithms.
The Nonlinear Teager operator is defined as[4]
[ ( ] [ ( ] [ ( ( ] (2)
And the discrete version of the operator can be defined as[4]
( ( ) [ ] [ ] [ ] (3)
The NEO approach to demodulation has many attractive features such as simplicity, efficiency, and adaptability to instantaneous signal variations
A. Distance Metrics For Feature Matching
Many distance measure algorithms were proposed in past for speaker identification. Mostly used are BIC, the generalized likelihood ratio, cross likelihood ratio and KL distance.
1) Delta Bayesian information Criteria (BIC)
BIC is a likelihood-based criterion penalized by the model complexity (number of free parameters in the model), as a model selection criterion. Let us consider two audio segments (i,j) of parameterized acoustic vectors of Xi and Xj of frame lengths Ni and Nj respectively, and with mean and standard deviation values µi, ơiand µj, ơj.. On the other hand , fusing both the segments into X, with mean and variance µ, ơ and frame length N For a given acoustic segment Xi, the BIC value of model Mi is determined by[5]:
( ( ( (4)
Log L(Xi, Mi) is log-likelihood of the data given the considered model, λ is a free design parameter dependent on the data being modelled. In order to use BIC to evaluate the speaker distance, we have
( (5)
Volume 2 | Issue 5 | September-October-2017 | www.ijsrcseit.com | UGC Approved Journal [ Journal No : 64718 ] ( |∑ | |∑ |
|∑ |
(6)
The positive value of ΔBIC shows that speaker is different. If the ΔBIC value comes out to be negative then the speaker is same[5]. ΔBIC is calculated for each frame at the interval of 20 in our algorithm.
2) Kullback- Leibler Distance Metric(KL2)
We first consider some assumptions to apply KL2 in our paper that segment A and B are Gaussian in nature. The KullbackLeibler (KL) distance between two segments A and B is an information theoretic measure equivalent to the additional bit rate accrued by encoding segment B with a code that was designed for optimal encoding of A[6]. The KL divergence of two random distributions is given as:
( ( ) (7)
EA is the expected value with respect to the PDF of A.
but in above case the distribution is not symmetric. By symmetrising the KL to obtain the close form solution, the KL2 divergence is obtained[6]:
( ( ( (8)
When two distributions are Gaussian in nature, then the distance is calculated as follows for the segments[6];
( ( ( )
(9) The value of KL2 gives the distance between segments. Therefore, we have to take the segments, which are Gaussian in nature. These types of segments help in capturing the speaker features, easier. Larger the KL2 value, larger the distance between segments[6]. But performance of this algorithm is not as efficient as BIC (comparison is in result section).
3) T-test distance Metric
Given are the two distribution in which we need to find the distance. Or in other words need to find the similarities. Let the distribution be ƒ( ), ց( ) and variable be X={ 1, 2, ……… N} [7]. Denote:
( { ( | } ( 10)
( { ( | } (11)
We find the similarities between two distribution by finding the similarities between the variable of ƒ( ) and ց( ). Let Td be the distance between distribution and it
is calculated as[7]:
(( ( ) ( ( )) | | √
(12)
where m1, m2 are the mean of variable of distribution
Sƒ(X), Sg(X) respectively. σ1, σ2 are the standard
deviation. n1, n2 are the size of segments.
We can use this concept in context of measuring the distance between two speaker. S1={ 1, 2, … N} be the
first speaker and S2={y1, y2, …yN} be the second
speaker[7] with the distribution given below.
( ( | ) ( | (13)
( ( | ) ( | (14)
Where X = { 1, 2, … N, y1, y2, …yM}, i, yi are the
features vectors, λc1 is the model estimated using
features vectors of speaker C1, λc2 is the model of
speaker C2, λUBM is the universal background model and
( | is the log probability function of feature vector with model λ.
The value of Td indicates the distance between the
segments of speaker. Lower the value of Td lower the
distance between their features and more similar the speakers are. The drawback of this algorithm is the same size segments for distance calculation. If size of one segment if bigger then this algorithm fails to calculate the distance. However, this algorithm is more reliable and easy to apply compare to BIC and KL2.
III.
RESULTS AND DISCUSSION
A. Database Used
speaker authentication purpose. Other speaker recording is conversation between students during lecture. These are also recorded in noise free environment from a voice recorder. All speeches have same language and the language used is English. The database contain speeches of different length (3sec-13sec), average of 8sec. Due to lack of availability of database of speech signal, standard PDA data is used, which is also helpful to determine the minimum length for speaker recognition system.
B. Performance Evaluation
The performance of each algorithm is compared by the DET curve and ROC curve. Table 2 representations all possible error and correct detection probability.
Table 2.
Correct Reception and Possible Error
Probability
Positive Negative Total Positive True
Positive (TP)
False Positive (FP)
TP + FP
Negative False Negative (FN)
True Negative (TN)
FN + TN
Total TP + FN FP + TN TP+FP+FN+TN
When the speaker is present in database but the test speaker features are remain undetected, this error is called miss alarm probability or false negative rate[8]. When the speaker is not present in database still system detect the features of speaker, this error is known as false alarm probability or false positive rate[8].
There are also some more terms which need introduction in this paper; FPR, FNR, TPR, TNR. The true negative rate and true positive rate are the correct rejection and reception of speaker, simultaneously. Some mathematical detail is given below[9].
(15) (16)
DET curve shows a tradeoff between errors; FNR and FPR. For better clear point of view ROC curve is also included in the paper. ROC gives a curve between sensitivity and 1-specificity.
(17)
(18)
The result evaluated from ROC is AUC. AUC required is maximum for error free detection given in eq 19.
{ [[
(
(
((
] ]
}
(19) C. Experimental Results
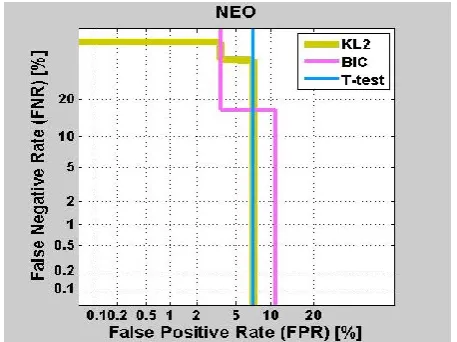
DET curve indicate how miss rate and false are related with each other. This will give the efficiency and Error rate as shown in table 3. Graph of DET curve with neo characteristics and MFCC characteristics are shown below.
Figure 4
The DET curve using NEO Feature
Fig 4 shows the DET curve between FPR and FNR with NEO features. Fig 5 shows DET curve with MFCC features. It can be clearly seen that T-test distance metric shows minimum Equal Error Rate (EER) and maximum efficiency.
Volume 2 | Issue 5 | September-October-2017 | www.ijsrcseit.com | UGC Approved Journal [ Journal No : 64718 ]
The error rate calculated from the FNR and FPR is as shown below:
Table 3
Efficiency And Error Result
NEO MFCC
Efficiency EER Efficiency EER BIC 89.3592 10.6408 92.9045 7.0955
KL2 92.9045 7.0955 92.9045 7.0955
T-test 92.9045 7.0955 94.8583 5.1417
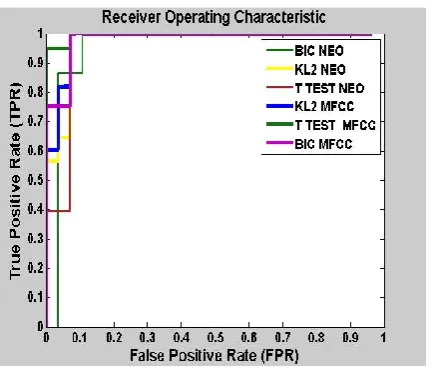
We can clearly see in table 3 that the minimum error occurs when T-test algorithm is used with MFCC features in speaker recognition system. ROC curve for three different algorithms with different feature are shown in figure 6.
Figure 6
The ROC curve with NEO and MFCC
features
In this curve, Area under curve (AUC) is calculated using equation (19) and it is maximum in case of t-test with MFCC features. Next, is BIC with MFCC and last is KL2 with MFCC.
IV.
CONCLUSION AND FUTURE SCOPE
In this research work of speaker recognition system, three distance metric algorithms using two different features; MFCC and NEO are compared and conclude that T-test algorithm is more efficient than BIC and KL2. When it is used with MFCC feature, it shows its best efficiency. The speaker recognition system using T-test count minimum false negative rate when compared with others. BIC procedure and KL2 are same in case of false positive rates. The results are more accurate for speech segments of length greater than 8seconds. For future, work must be done to
develop algorithm, which can give better result even with smaller segments of speech.
V.
REFERENCES
[1]. H. Beigi, Fundamentals of Speaker Recognition. 2011.
[2]. M. A. Imtiaz and G. Raja, "Isolated word Automatic Speech Recognition (ASR) System using MFCC, DTW & KNN," Proc. - APMediaCast 2016, pp. 106-110, 2017.
[3]. S. M. Joseph, "Speech Compression Using Wavelet Transform," pp. 754-758, 2011.
[4]. S. Pal, "Speech Signal Processing : Non-Linear Energy Operator Centric Review," Int. J. Electron. Eng. Res., vol. 4, no. 3, pp. 205-221, 2012.
[5]. S. Chen and P. Gopalakrishnan, "Speaker, environment and channel change detection and clustering via the bayesian information criterion," Proc. DARPA Broadcast News Transcr. Underst. Work., vol. 8, pp. 127-132, 1998.
[6]. M. A. Siegler, U. Jain, B. Raj, and R. M. Stern, "Automatic Segmentation, Classification and Clustering of Broadcast News Audio," Proc. DARPA Speech Recognit. Work., pp. 97-99, 1997.
[7]. T. H. Nguyen, S. Chng, and H. Li, "T-test distance and clustering criterion for speaker diarization," Proc. Annu. Conf. Int. Speech Commun. Assoc. INTERSPEECH, no. 4, pp. 36-39, 2008.
[8]. L. F. Carvalho, G. Fernandes, M. V. O. De Assis, J. J. P. C. Rodrigues, and M. Lemes Proença, "Digital signature of network segment for healthcare environments support," Irbm, vol. 35, no. 6, pp. 299-309, 2014.