CSEIT172521 | Received : 08 Sep 2017 | Accepted : 14 Sep 2017 | September-October-2017 [(2)4: 150-157]
International Journal of Scientific Research in Computer Science, Engineering and Information Technology © 2017 IJSRCSEIT | Volume 2 | Issue 5 | ISSN : 2456-3307
150
Patient Survival Prediction Using Data Mining Technique
Dr. T. Shanmuga Vadivu
Assistant Professor, Department of Computer Science, Arulmigu Palaniandavar Arts College For Women, Palani,
Tamil Nadu, India
ABSTRACT
With more and more biological information generated, the most pressing task of bioinformatics has become to analyze and interpret various types of data, including nucleotide and amino acid sequences, protein structures, gene expression profiling and so on. In this research, to apply the data mining techniques such as feature generation, feature selection, and feature integration with learning algorithms to tackle the problems of disease phenotype classification and patient survival prediction from gene expression profiles, and the problems of functional site prediction from DNA sequences. When dealing with problems arising from gene expression profiles, the researcher propose a new feature selection process for identifying genes associated with disease phenotype classification or patient survival prediction.
Keywords : Micro Array, Patient Survival Prediction, Support Vector Machine.
I.
INTRODUCTION
A computational procedure for patient survival forecast utilizing microarray quality expression information will be exhibited. The expert painstakingly form the instruction set examples by way of selecting simply brief survivors who handed on internal of a short length and long haul survivors who were still alive after a commonly lengthy catch up time. This idea is aroused by our conviction that fleeting and long haul survivors are greater academic and strong (than the ones instances in the center of) for constructing and comprehension the connection inside the middle of traits and affected person survival. The model allocates every attractiveness investigate a danger score to expect persistent survival.
II.
PATIENT SURVIVAL PREDICTION
ALGORITHM
This research portrayed a brand new method for affected person survival expectation, concentrating on deciding on an academic subset of getting ready tests and constructing Support Vector Machine based scoring potential.
2.1 Selection of informative training samples
One of the essential components of our new strategy is to choose academic getting ready tests. for the reason that researcher center is on the relationship among best expression and survival, the survival time related with each example assumes a critical component here two forms of extraordinary instances, patients who kicked the bucket in a short period (termed as "temporary survivors") and who were alive after a long stretch (termed as "lengthy haul survivors"), need to be greater worthwhile than the ones in the "center" reputation. Hence, the analyst utilizes just a piece of tests in preparing and this is unmistakably not quite the same as different methodologies that utilize all preparation tests. Officially, for a sample T, if its follow-up time is F(T)and its fame at the stop of observe-up time is E(T), then
TemporarySurvivor, T is if F(T)<C1and
E(T)=1
Lengthy Haul Survivor, if F(T)>C2
E(T)=1 stays for "lifeless" or an damaging result, E(T)=zero stays for "alive" or a really perfect end result,
C1 and C2 are edges of survival time for selecting quick
term and long haul survivors. To observe that long haul survivors moreover comprise those patients who kicked the bucket after the predetermined long stretch. The
two limits, C1 and C2, can shift from malady to
contamination, from the facts set to statistics set. As an example, within the survival research of early-level lung adenocarcinomas as a way to be introduced later, the analyst pick out brief survivors as the individuals who kicked the bucket interior of 1 subsequent yr
(i.e.C1 is 1 yr) and lengthy haul survivors because the
folks that were alive following 5 subsequent years (i.e.
C2 is five years). There are downright 45 wonderful
getting ready checks (20 temporary survivors and 25 lengthy haul survivors) amongst a mixture of 86 available vital lung adenocarcinomas. Those 25 long haul survivors contain 2 sufferers whose fame closer to the end of next time become "useless", yet capture up times had been 80.5 months and 81.1 months. The
scientist’s essential rules for the determination of C1
and C2 are that the instructive subset ought to (1)
contain enough preparing tests for learning calculations to learn (normally >15 tests in every class and aggregate is between 33% and one portion of every accessible specimen), yet (2)do not have an excess of tests to abstain from including non-compelling cases.
2.2 SVM Scoring Function Construction
The relapse scoring capacity proposed for survival hazard estimation depends on bolster vector machines (SVM) and the last discriminant capacity f(T) for a test T given in Formula. expression estimations of the recognized qualities. The researcher delineates mark of "temporary survivors" to one and "lengthy haul survivors" to - 1. Observe that f(T)>zero if the example T will in all likelihood be a "fleeting survivor", and f(T)<zero if the specimen T will in all possibility be a "long haul survivor". The researcher uses a transformation function as:
( ) (zero,1). Notice that the littler the S(T) really worth is, the better survival the affected person evaluating to check T will have. The researcher term S(T) the hazard rating of T. Within the event that one just classifies patients into high hazard or k gatherings, the well worth 0.5 is a characteristic cutoff for S(T), where if S(T)>0.5 then the affected person evaluating to check T can have higher hazard; commonly, the affected person can have delivered down danger. In the event of that more than risky gatherings are taken into consideration, for instance, high, middle of the road, and coffee then one kind of shorts may be set in light of the hazard scores of preparing checks. E.g., in preparing set, if the majority of fleeting survivors have a risk score extra outstanding than r1 and the part of long haul survivors
have a risk rating littler than r2, then,
If S(T)>r1 then T is High Risk
If S(T)>r2 then T is High Risk
If r2<=S(T)<=r1 then T is Intermediate Risk
By and large, r1>0.5, r2<0.5, and they can be gotten from the danger scores allocated to the preparation tests. To assess the outcomes, in the wake of doling out patients into various danger gatherings, the researcher attracts Kaplan-Meier plots to think about the survival qualities between gatherings.
2.3 Kaplan-Meier analysis
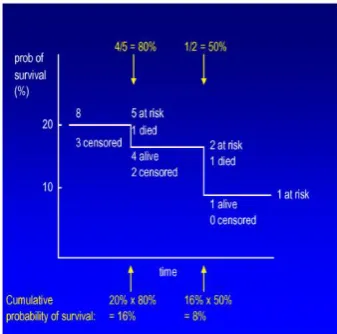
survival information for the preliminary 3 years of the bend, however not to the part of the bend after that. On this way, this patient has to be numerically expelled from the bend toward the stop of three years follow-up time and this is called "modifying" the affected person. On a Kaplan-Meier survival bend, whilst a affected person is edited, the bend does not step down because it does while a affected person bites the dust; instead, a tick imprint is for the most component used to demonstrate wherein a affected person is managed and each loss of life case after that point will result in a tiny bit bigger stride down at the bend. An option approach to illustrate a managed patient is to demonstrate the quantity of remaining cases "at risk" at some time focuses. Sufferers who have been blue-penciled or passed away before the time factor and is not considered "at danger". In Figure-1 (a) demonstrates a whole specimen of Kaplan-Meier survival bend with a tick mark talking to an edited patient (stuck from
http://www.cancerguide.org/scurve_km.html), while
Figure-1(b) outlines the way to compute the part of survival right away. To look at the survival attributes between various danger gatherings for our survival expectation think about, the specialist draws Kaplan-Meier survival bends of the danger gatherings in one picture and utilize Logrank test to analyze the bends. The Logrank produces a p-esteem checking out the invalid idea that the survival bends are not any distinction between two gatherings. The importance of p-nice is that "if the invalid speculation is genuine, what is the likelihood of haphazardly selecting checks whose survival bends are not pretty similar to folks that absolutely acquired".
Figure-1 (a): Samples of Kaplan-Meier survival curves. It is miles an example of a Kaplan-Meier survival curve. This institution of sufferers has a minimal follow-up of a bit over a year.
Figure-1 (b): It is an instance on how to calculate the fraction of survival at a time.
PATIENT SURVIVAL PREDICTION ALGORITHM
Step-1 : Read n samples.
Step-2 : Select training samples.
Step-3 :Classify the training samples.
Step-4 : Genes are related to the survival.
Step-5 :Construct Support Vector MachineScoring function and form danger agencies.
Step-6 : Assign danger score and risk group to every sample.
Step-7 :Using Kaplan–Meier curve, Predicts the Patient Survival.
Step-8 : Identify Lengthy Haul Survivor and Temporary Survivor.
Figure - 2: Patient Survival Prediction Algorithm All the Kaplan-Meier survival bends are produced by using Graph Pad Prism and the researcher dependably
shows the 2-tailed p-esteem. Figure-2 shows
understanding survival expectation calculation for patient survival.
III. SIMULATION RESULTS
The researcher applies the process of survival have a look at above the 2 gene expression data units.
3.1 Lymphoma
preparatory gathering comprising of one hundred sixty sufferers and an approval collecting of 80 patients, every of them is portrayed by means of 7399 microarray highlights.The researcher pre-procedures the data to uproot those features which can be lack in greater than 10% of the investigations inside the preparatory accumulating. There live 4937 additives in the wake of having 2462 traits evacuated. At that point, the scientist chooses temporary survivors and lengthy haul survivors to construct an academic subset of preparing assessments. For this take a look at, the
analyst set C1=1 (12 months) and C2 =8 years in
method (5.1). Some of the preparatory one hundred sixty-tolerant accumulating, 47 fleeting survivors (who exceeded on inside of one subsequent 12 months) and 26 lengthy haul survivors (who had been alive following 8 subsequent years) are along these lines picked. Along these lines, a sum of seventy three tests is on this instructive subset of getting ready tests (46% of the preparatory accumulating).
Within the second step, the specialist applies GSA and GFA to those 73 exams and distinguishes 78 qualities which are identified with affected person survival status at five percent noteworthy level (for Wilcoxon Rank aggregate test) and 0.99 Pearson courting coefficient edges. Some of our chose characteristics are moreover recorded in Table 5.1, wherein these traits have been found to be basically connected with survival (p<0.1). E.g., AA805575 (GenBank increase variety) is in germinal-focus B-mobile mark, X00452 and M20430 in MHC magnificence II mark, and D87071 is in lymph-hub signature. The quality marks were fashioned through a numerous leveled grouping
calculation. Moreover, some pinnacle-positioned
features (with littler entropy esteem) diagnosed via GSA are likewise in this kind of first-class marks. E.g.,
BC012161, AF061729 and U34683 are in
multiplication signature, BF129543 is in
germinalcenter B-cell mark, and K01144 and M16276 are in MHC magnificence II signature.
Within the third step, a SVM version is ready on the seventy three terrific making ready exams with the 78 prominent factors. The researcher reveals that a great deal discovered direct element SVM can isolate the 47 fleeting survivors and 26 long haul survivors totally the least risk rating allotted to the brief survivors is above 0.7 and the more part of the lengthy haul survivors have chance score decrease than 0.3. At that point, the
researcher ascertains hazard scores for the various examples, to be specific the remaining (non-amazing) 87 tests in the first preparatory gathering and the 80 tests in the acceptance bunch. These 167 specimens are dealt with the test set.
Figure- 3 (a): Training Sample when p<0.0001.
Figure-.3 (b): All Training Samples when p<0.0001.
Figure-3 Kaplan-Meier plots define the estimation of trendy survival among diverse danger DLBCL patients in the trying out set containing 167 specimens appeared in Figure-3(a) and each one of the 240 examples seemed in Figure-3(b). The hazard gatherings are formed on our SVM-based totally scoring potential. A tick mark at the plot demonstrates that one instance is blue-penciled at the touching on time. The 5-year popular survival for excessive hazard as opposed to okay gatherings of sufferers for trying out exams is 32% versus 91%, for all examples is 20% versuS 95%. The
researcher categorized sufferers into 4 risk
organizations as follows:
If S(T) < 0.7 then T is High Risk
If S(T) <0.3 then T is Low Risk
Where the threshold 0.5 suggests fee of 0.7 and 0.3. The Kaplan-Meier bends of trendy survival are attracted shown in Figure-3, wherein the researcher can see transparent contrasts at the 5-year survival charges for the excessive threat and okay gatherings, in both trying out take a look at set seemed in Figure-3(a) and all specimens appeared in Figure-3(b). Notwithstanding the reality that the analyst cannot see unmistakable popular survival among the two halfway gatherings, the five-12 months survival charges of these two gatherings are glaringly not similar to that in the excessive hazard bunch or the k accumulating. This also recommends three or two chance gatherings would be good enough for these DLBCL assessments. So whatever remains of this look at, the analyst basically consolidate excessive and center excessive danger patients into a solitary excessive hazard elegance, and coffee and mild usually safe sufferers right into a solitary k type. Having the danger score, in another case comes, the scientist will have the capacity to dole out it to the relating hazard bunch effortlessly. This type of forecast become no longer cope with in which the DLBCL patients were placed by their first-rate expression-based result indicator rating but remote into a few gatherings with equivalent number of checks. For an example: eighty tests within the approval accumulating have been stratified by means of quartiles of the ratings with each of quartiles comprising of 20 sufferers. With that type of arrangement, one cannot find an unequivocal measure to evaluate every other case.
International Prognostic Index Comparison
Different medical additives, for instance, degree, execution reputation, lactate dehydroginase levels which can be recognized now not firmly identified with patient survival, had been joined to form the worldwide Prognostic Index (IPI). The IPI has been efficaciously embraced to discrete forceful lymphomas into some gatherings with essentially different reactions to treatment and survival. When the researcher thinks through that IPI is simply primarily based at the concept of scientific additives, it offers little understanding into infection technology. The chance score were given from our strategy depends on pleasant expression in biopsy examples of the lymphoma, so it is far a self-sufficient indicator from IPI. Certainly, the
researcher reveals that sufferers inside the high IPI bunch and also for the center of the road and the low IPI bunch while parceled via the dangerous rating into excessive danger and okay instructions have altogether distinctive effects. In Figure 5.4, Kaplan-Meier plots display noteworthy contrast on widespread survival for our high chance and k gatherings the various sufferers with IPI low (and likewise for middle and high) danger listing. Mainly, among 21 IPI excessive chance patients in our trying out set, 15 of them are appointed by means of our strategy to the excessive risk magnificence and six of them to the usually safe class. When the researcher tests the survival fame of these sufferers, to discover 14 of the 15 patients having a place with excessive danger type are in truth useless whilst simply 2 of the 6 patients having an area with our generally secure class are useless. Additionally, for each of the 32 patients inside the entire facts set with excessive IPI, 23 of them (22 lifeless) are doled out with the aid of our strategy to the excessive hazard class and nine (five useless) of them are doled out to usually safe category. This recommends our method is probably a greater feasible indicator of DLBCL survival result than the IPI.
3.2 Lung adenocarcinoma
Adenocarcinoma is an important histological subtype of non-little cell lung boom (NSCLC). There is a need to better foresee tumor motion and clinical result in lung adenocarcinoma. The lung adenocarcinoma statistics set carries 86 essential lung adenocarcinomas. These analyses incorporate 67 tiers I and 19 stage III means of univariate Cox investigation. Assessments have been led by means of arbitrarily component 86 checks into equal measured making ready and testing units and through "neglect one" move recognition.
In the first place, the researcher frame our guidance set
with the aid of putting C1=1 year (12 months) and
C2=five years in components (5.1). 10 temporary
The scientist top-positioned highlight by way of entropy measure, the ATRX high-quality, is a putative translation controller. The analyst second-positioned quality, ENPP2, is a piece of anxiety pathways included in oncogenesis. At that moment the analyst prepares a straight part SVM to get the weight for each distinguished quality in light of the preparation information. The organized SVM can isolate these 31 exams extraordinarily well, appointing excessive hazard scores to fleet survivors (maximum minimum score is as high as 0.73) while generally safe rankings to lengthy haul survivors (most amazing rating is as little as 0.25). Within the wake of making ready, the analyst ascertains chance rating for each of the last 55 tests that are utilized for check purpose. These examples are then named excessive risk bunch comprising exams T with S(T)>0.5, or as commonly safe gathering comprising tests T with S(T)≤0.5. The
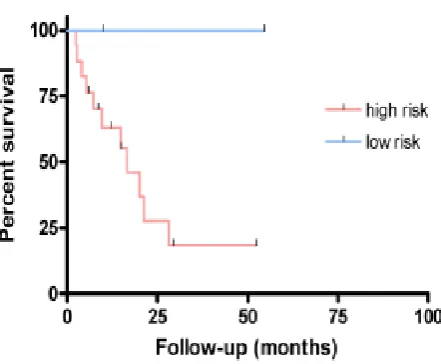
Kaplan-Meier bends in Figure-4 show clear
comparison of survival for patients in our high and typically safe gatherings for each checking out cases and all cases. Since the researcher selects all fleeting and lengthy haul survivors to border the training set, there is no "passing" event passed off inside the initial three hundred and sixty five days’ time and no specimen edited following 60 months’ time inside the plot drawn simply at the experiments.
Figure-4 (a): Training Samples when p=0.0036.
Figure-4(b): All Training Samples when p<0.0001.
Figure-4 displays Kaplan-Meier plots outline the estimation of widespread survival among excessive chance and k lung adenocarcinoma patients inside the trying out set containing fifty five checks appeared in Figure-4(a) and every one of the 86 tests appeared in
Figure-4(b).
Figure-5 (b): All Training Samples when p<0.0001(First Stage).
Figure-5 (c): Training Samples when p=0.3007 (Third Stage).
Figure-5 (d): All Training Samples when p=0.1622 (Third Stage).
Figure-5 shows Kaplan-Meier plots illustrate the estimation of ordinary survival among high risk and
coffee threat lung adenocarcinoma sufferers conditional on tumor level. To recognize the relationship between our forecast and tumor stage one or stage third, the analyst moreover attracts Kaplan-Meier bends to painting survival comparison among our high and normally safe patients molded on tumor degree. From Figure-5, the analyst can see that consequences of patients with level one lung adenocarcinoma in excessive and usually safe gatherings vary from every different, for each experiments appeared in Figure-5(a) and all cases regarded in Figure-5(a). again especially, for 13 level third cases within the trying out set, the analyst doled out 11 (5 lifeless, 6 alive) of them to excessive chance bunch, after which 2 allotted to usually safe accumulating had been all alive toward the end of the subsequent time. Amongst each of the 19 level third instances, 17 eleven dead, 6 alive) of them had been doled out to excessive chance bunch as in step with our chance score.
Inside the progression of making ready set improvement, the expert chooses just two compelling training samples - long haul and transient survivors. Table 5.1 illustrates size exchange patterns from the first preparing tests to the useful making ready tests on DLBCL and lung adenocarcinomas facts units. The figures outline that the expert utilized a little piece of assessments as getting ready. However, if the analyst does no longer select the ones compelling cases, and alternatively make use of all available getting ready checks, then what will be the consequences. To show this, the analyst pick out characteristics and train SVM model at the 160 specimens in the preparatory accumulating of DLBCL have a look at. In spite of the reality that the instruction precision is exquisite, Kaplan-Meier plots do not display not worthy survival evaluation among the high and usually safe gatherings shaped through the eighty recognition tests considering their chance scores that allotted via the organized SVM version. Utilizing every one of the 4937 characteristics, the p estimation of the survival bends is 0.21 seemed), utilizing forty features chose by using GFA algorithm.
IV. CONCLUSION
survivors and long haul survivors. Actually, if there are qualities undoubtedly connected with result, then the diverse expression estimations of these qualities ought to be checked by breaking down these two sorts of tests.
V.
REFERENCES
[1]. H. Witten and E. Frank, 2000. Data Mining:
Practical Machine Learning Tools and
Techniques with Java Implementation. Morgan Kaufmann, San Mateo, CA.
[2]. C.J. Thornton, 1992. Techniques in
Computational Learning. Chapman and Hall, London.
[3]. T.M. Mitchell,1997. Machine Learning.
McGrawHill, USA.
[4]. T. R. Golub, D. K. Slonim, P. Tamayo, C. Huard,
M. Gaasenbeek, J. P.Mesirov, H.
Coller,M. L. Loh, J. Downing, M. A. Caligiuri, C. D. Bloomfield, and E. S Lander,1999.
Molecular classification of cancer: Class
discovery and class prediction by gene expression monitoring. Science, 286:531-537.
[5]. A. Alizadeh, M.B. Eisen, R.E. Davis, C.Ma, I.S.
Lossos, A. Rosenwald, J.C. Boldrick,H. Sabet, T. Tran, X. Yu, J.I. Powell, L. Yang, G.E. Marti, T. Moore, J.Jr. Hudson, L. Lu,D.B. Lewis, R. Tibshirani, G. Sherlock, W.C. Chan, T.C. Greiner, D.D. Weisenburger,J.O. Armitage, R. Warnke, and L.M. Staudt, 2000. Distinct types of diffuse large B-cell lymphoma identified by gene expression profiling. Nature, 403:503-511.
[6]. M.A. Hall. Correlation-based feature selection
for machine learning, 1998. PhD thesis, Department of Computer Science, University of Waikato, Hamilto, New Zealand.
[7]. V.N. Vapnik, 1995. The Natural of Statistical
Learning Theory. Springer.
[8]. C.J.C. Burges, 1998. A tutorial on support vector
machines for pattern recognition. DataMining and Knowledge Discovery, 2(2):121-167.
[9]. M.P. Brown, W.N. Grundy, D. Lin, N.
Cristianini, C.W. Sugnet, T.S. Furey, M. Ares, Jr.,and Haussler D, 2000. Knowledge-based analysis of microarray gene expression data usingsupport vector machines. Proceedings of the National Academy of Science, 97(1):262-267.
[10]. B. Scholkop and A.J. Smola, 2002. Learning
with Kernels. MIT Press, Cambridge, MA.
[11]. A. Zien, G. Raetsch, S. Mika, B. Schoelkopf, C.
Lemmen, A. Smola, T. Lengauer, and K.-R, 2000. Mueller. Engineering support vector machine kernels that recognize translation initiation sites. Bioinformatics, 16(9):799-807.
[12]. J. Weston, S. Mukherjee, O. Chapelle, M. Pontil,
T. Poggio, and V. Vapnik, 2001. Feature selection for SVMs. Advances in Neural Information Processing Systems, 13:668-674.
[13]. J. Platt., 1998. Fast training of support vector
machines using sequential minimal optimization. In B. Schlkopf, C. Burges, and Smola A., editors, Advances in Kernel Methods - Support Vector Learning, pp. 185-208. MIT Press.
[14]. F. Zeng, H.C. Yap, and L. Wong, 2002. Using
feature generation and feature selection for accurate prediction of translation initiation sites. Proceedings of 13th International Conference on Genome Informatics, pages 192-200, Tokyo, Japan.