DOI : https://doi.org/10.32628/CSEIT1953124
Virtual Machine Sizing in Virtualized Public Cloud Data Centres
Kenga Mosoti Derdus*1, Vincent Oteke Omwenga2, Patrick Job Ogao3 1.2Faculty of Information Technology, Strathmore University, Nairobi, Kenya
3Faculty of Engineering Science and Technology, Technical University of Kenya, Nairobi, Kenya
ABSTRACT
Virtual machine (VM) consolidation in data centres is a technique that is used to ensure minimum use of physical servers (hosts) leading to better utilization of computing resources and energy savings. To achieve these goals, this technique requires that the estimated VM size is on the basis of application workload resource demands so as to maximize resources utilization, not only at host-level but also at VM-level. This is challenging especially in Infrastructure as a Service (IaaS) public clouds where customers select VM sizes set beforehand by the Cloud Service Providers (CSPs) without the knowledge of the amount of resources their applications need. More often, the resources are overprovisioned and thus go to waste, yet these resources consume power and are paid for by the customers. In this paper, we propose a technique for determining fixed VM sizes, which satisfy application workload resource demands. Because of the dynamic nature of cloud workloads, we show that any resource demands that exceed fixed VM resources can be addressed via statistical multiplexing. The proposed technique is evaluated using VM usage data obtained from a production data centre consisting of 49 hosts and 520 VMs. The evaluations show that the proposed technique reduces energy consumption, memory wastage and CPU wastage by at least 40%, 61% and 41% respectively.
Keywords : Virtual Machines Sizing, Virtual Machine Consolidation, Statistical Multiplexing
I. INTRODUCTION
In recent years, the use of cloud computing has increased in organizations in providing infrastructure to process application workloads. This increased appetite can be attributed to its success in delivering service on a pay-as-you-go basis. This has caused services providers to install many data centre across the world to address the demand. Unfortunately, data centres consume a lot of energy and this a concern. According to [1] and [2], power bills has been the largest commodity service expenditure in CSPs. Moreover, data centre electricity usage was about 3% by 2012 and now it is expected to triple by 2020 [1]. The main cause of data centre power wastage is low server utilization, which is caused by inefficient
resource utilization leading to use of many physical servers to run application workloads [3] [4].
The main technology that supports cloud computing is virtualization [5]. This technology allows many different applications to be executed independently in shared hardware by sharing resources. This is known as consolidation, which allows packing many VMs in the one physical machine (PM) so that other PMs can be shut down thus achieving energy savings. However, this technique may not be useful in some circumstances. For instance, in Infrastructure as a service (IaaS), which is the most promising cloud model among small organizations [6], [7], customers
are allowed to pick VM sizes from CSPs’ list of
actual amount of resources their applications need [8]. More often, the resources are over-provisioned and thus goes to waste. From this viewpoint, consolidation only helps in host-level resources maximization and not VM-level resources maximization.
To determine the actual resources required by a VM, data on resource usage about a VM have to be analyzed for a given period of time [9]. CSPs can do this to propose the right VM sizes to their clients. In this regard, CSPs have attempted to help their client perform right-sizing such as ParkMyCloud for Windows Azure Cloud, Amazon CloudWatch and Google cloud right-sizing [9] [10]. All the methods provided by Azure, Google and AWS cloud services have to be manually completed by customers and seems to fit customers who already have knowledge in cloud computing. Moreover, the customer has to choose from the VM type preset by the CSP for resizing their VMs. Nevertheless, if the recommendations are applied correctly and consistently, cloud customers can save up to 70% on the monthly bill.
Moreover, there has been a growth of literature touching on efficient use of computing resources with the aim of reducing data centre energy consumption via VM sizing [8], [11], [12]. Different
works have used different techniques but there’s still
room to improve resource utilization for energy savings by utilizing different techniques.
In [13], the authors have proposed a VM sizing technique. A VM sizes (amount of resources allocated
to a VM) if given as a function of a VM’s own
resource requirements, resource requirements of the co-located and the overall effect of VM co-location. Based on the proposed VM size, a VM allocation has been developed to ensure the least resource demands and minimize VM migrations.
In [8] the authors have proposed a VM sizing algorithm that customizes VM sizes to match application workload resource demands in a containerized cloud environment. In this approach, application tasks are clustered using features such as resources usage, task length, and priority and submission rate. The clustered jobs are then mapped to the appropriate VM sizes that meet the resource demands for the applications. In this approach, Google Cluster Trace has been used to evaluate the proposed technique. The authors have reported that the proposed technique achieves efficient utilization of resources leading to energy savings.
In [5] the authors have proposed a VM sizing approach by creating copies of similar VMs in different hosts to reduce the pressure put on particular resources in one host. This technique take advantage of hosting dissimilar workloads in the same host. This way, aggressive consolidation can be achieved without performance degradation caused by homogeneous workloads. A secondary benefit for this technique is reliability brought about by having multiple copies of the same VM for processing workloads.
Finally, in [14] the authors have proposed a VM sizing algorithm, whose aim is to match resources allocated to VMs with the actual application load. This is achieved using time division multiplexing. After a VM is resized, the new changes can be implemented by existing hypervisor capabilities such as CPU-Hotplug and Memory Ballooning.
resources from an idle VM simply because co-located VM do not peak simultaneously. By ensuring that VMs are allocated the resources that are actually demanded by cloud workloads, leads to the use of less physical server and thus saving on energy. The overall benefit is that operating costs for running the data centre on the part of the CSP and running VMs on the part of the client is reduced. The target cloud service and deployment model in this work is IaaS multi-tenant cloud, where cloud users are allowed to determine their application resource demands (VM size), by selecting VM sizes pre-set by CSPs.
The remainder of this paper is organized as follows. Section II discusses the materials and methods used in this paper. Section III presents the results obtained from our procedures. In section IV, we discuss the results obtained from our procedures and the paper is concluded in section V.
II. METHODS
In this section, we describe the materials used and the procedures used to achieve our objective. This section clearly explains five areas, 1) A description of data used to evaluate our technique, 2) Visual analysis of VM resource usage using graphs, 3) How a VM sizing algorithm was designed, 4) How we showed that statistical multiplexing is a viable technique for supporting VM sizing and 5) Evaluation of VM sizing algorithm.
A) A description of the data used to evaluate our technique – GWA-T-13.
This data is obtained from the Grid Workload Archive (GWA). The main goal of GWA is to provide a platform where researchers and practitioners can share grid workloads [15]. Any person wishing to share their grid workload can do so as long as they are in a database format (SQLite) or text format (CSV). GWA has collected over 13 workloads shown on
their website, Materna being the latest. Materna consists of three traces from a distributed datacenter, namely Materna-trace-1, Materna-trace-2 and Materna-trace-3 with 520 VMs, 527 VMs and 547 VMs respectively. Materna provides service to different organizations featuring different business lines such as government, digital enterprises, IT factory and SAP business consultancy in Germany. The VMs running in the 3 traces are mostly the same and were collected for a period of 3 months and each of the 3 traces contains information representing one month. The resources usage data of each VM is thus treated as time series data. Because of the difference in the number of VMs in the three traces, it not possible to tell one particular VM in the three traces and hence they cannot be merged. For this reason, one can only work with one trace at a time.
Materna trace is obtained from a VMware ESX environment with 49 Hosts, 69 CPU cores and 6780 GB RAM. The data contains information about 520 VMs in 520 CSV files. The following information about each VM is contained in each CSV file.
• Timestamp – this is the epoch timestamp in milliseconds.
• CPU cores – this is the number of vCPUs provisioned to the VM.
• CPU capacity – this is the vCPU capacity in MHZ. It is given as the product of the number of cores and the speed per core.
• CPU usage (MHZ) – CPU capacity that is actually used by workloads in MHZ.
• CPU usage (%) - CPU capacity that is actually used by workloads in percentage (%).
• Memory provisioned - this is the memory capacity for the VM in KB.
• Memory usage (KB) – this is the actively used memory in KB.
• Disk write performance – this is the disk throughput in KB/s.
• Disk size – this is the size of the HDD in GB. • Network throughput (received) - this is the
network performance in terms of KB/s.
• Network throughput (transmitted) - this is the network performance in terms of KB/s.
B) Visual analysis of VM resource usage using the dynamic nature of cloud workloads. We also used percentiles to try and determine resource allocations that can process most of the workloads across time.
C) Design of VM sizing algorithm.
The data, whose source and characteristics are presented in part A of this section is the basis of the design of this VM sizing algorithm. A VM size is
where N is the total number of observations for CPU usage. The percentile ranking is then used to get the CPU usage value, which is treated as 80% of actual VM size according to Datacenter Maturity Model % [16]. Thus, if a function f(.) gives the CPU values at rank Rcpu, then the effective VM CPU size, CPU, is
given according to equation 2. Similar calculations apply for VM memory.
𝐂𝐏𝐔 = 𝟓
𝟒𝐟(𝐑𝐜𝐩𝐮) (𝟐)
Any resource need that exceeds the fixed CPU size is taken care of by statistical multiplexing. After, VM sizing, we compare the resource required in a data
centre before and after VM sizing. Next, we show how we determined the viability of statistical multiplexing.
D) Is statistical multiplexing viable?
To determine if statistical multiplexing is a viable technique, we identified all peak points for each of the 520 VMs (in workload described in part A), their corresponding timestamps and if there are peaks in other VM, which occur at the same time. We define a peak point of a VM as any point whose value is higher than a 90th percentile value. The following steps were used to determine the viability of
statistical multiplexing with the 520 VM’s resources
usage time series data as input.
Step 1: Compute the 90th percentile for resources
usage for each VM.
Step 2: For all the VMs, identify peak points together with their corresponding occurrence times (timestamps).
Step 3: Determine the frequency of each repeating peak timestamps and compute the percentage of VMs, which peak at particular peak points (if a timestamp appears multiple times, it means some VMs peak at the same time).
E) Evaluation of VM sizing algorithm
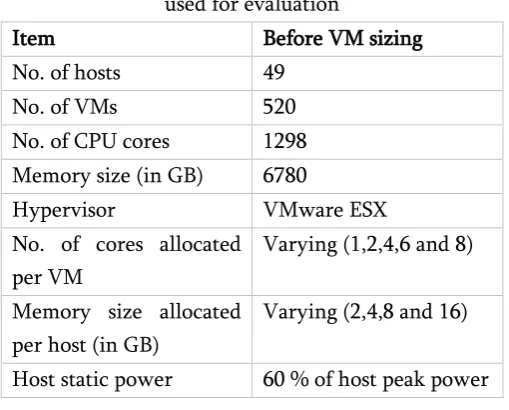
The performance of the VM sizing algorithm is evaluated by scheduling workloads on a simulated data centre on CloudSim Plus cloud simulator. The data centre characteristics used in this evaluation (before VM sizing) are similar to those from which the workload data was obtained from. This is summarized in Table 1. We then compare energy usage by the data centre before and after VM sizing using First Fit (FF), Worst Fit (WF) and Best Fit (BF) VM allocation algorithms in turns. The power model used in energy calculation, Ptotal, is given by,
𝐏𝐭𝐨𝐭𝐚𝐥= ∑((𝐏𝐢′− 𝐏𝐢)
𝐤
𝐢=𝟏
∗ ( 𝐧𝐢
where k is the number of active hosts at any time, P’
is the maximum power consumption of the ith host, P
is the power consumed by the host when completely idle and n is the percentage CPU utilization of the host. Energy, E, can be calculated as shown in Equation 4.
𝐄 = 𝐏𝐓 (𝟒)
where P is average power consumption (in watts) and T is a time (in seconds) interval.
Table 1: CloudSim Plus Datacenter configurations used for evaluation
Item Before VM sizing
No. of hosts 49
No. of VMs 520
No. of CPU cores 1298 Memory size (in GB) 6780
Hypervisor VMware ESX
No. of cores allocated per VM
Varying (1,2,4,6 and 8)
Memory size allocated per host (in GB)
Varying (2,4,8 and 16)
Host static power 60 % of host peak power
III. RESULTS
For visual analysis of resource usage by VMs, Fig. 1 shows CPU usage over time for
Figure 1: CPU usage time series for VM 405
Figure 2: A plot of memory allocated, and memory used for VM 01
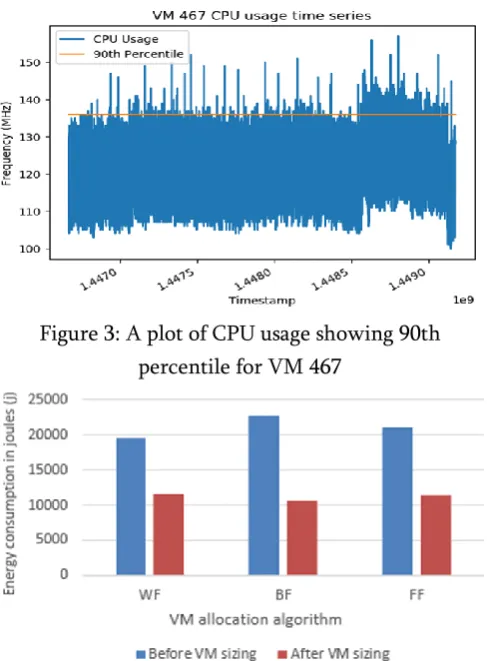
VM 405. It shows that CPU requirement by the workloads running the VM is highly dynamic. Fig. 2 shows a graph that compares memory allocated to VM 01 and memory actually used by the VM. It shows that memory allocated is a lot higher that the memory that is actually used. Summarily, the average CPU and memory usage for the 520 VMs was found to be 4.5% and 8.3% respectively. In fact, the percentage of VMs with CPU and memory utilization below 20% is 96.3% and 90.6% respectively. The average highest VM CPU and memory usage stand at 69.3 % and 82.2 % respectively. Moreover, Fig. 3 shows the 90th percentile of CPU usage for VM 467.
The figure shows that a 90th percentile resource
Figure 3: A plot of CPU usage showing 90th percentile for VM 467
Figure 4: A comparison of energy consumption in datacenter before and after VM sizing using WF, BF
and FF VM allocation algorithms
When the technique described in section II (C) above I used to size VMs, CPU cores requirements is reduced from 1298 cores to 535 cores and memory from 6780 GB to 4142 GB for processing workloads for the 520 VMs, which represents 61% and 41% respectively. As a consequent, the number of hosts theoretically reduces from 49 to 28. When the 520 VM application workloads are executed on the simulated data centre before and after VM sizing, there is a considerable energy consumption reduction across the three scheduling algorithm (FF, WF, BF). This is shown in Fig. 4.
IV.DISCUSSION
From the result presented above (Fig. 1 - 3), it is evident that resources demand by VM application
workloads is highly dynamic, which explain why it is a challenge to determine a fixed VM resources. Determining VM sizes based on peak resource usage is misleading because it is only a few times when resource usages reach peaks. The fear of compromising performance thus leads to over-provisioning of resources, which go to waste but at the same time consume energy. This is evident from Fig. 2, which indicates that resource usage by VMs is a lot lower than the resources allocated. This is supported by the fact that the average CPU and memory usage for the 520 VMs evaluated was 4.5% and 8.3% respectively. Sometimes, overprovisioning is not intentional but is caused by inexperienced users provisioning resources without knowing how much resources will be demanded by their application workload. Therefore, it makes sense to design techniques for VM right-sizing by analyzing historical resource usage. Instead of basing VM sizes on peak resources usages, using percentiles is a simple but effective technique. Fig. 3 shows 90th percentile
of CPU usage for VM 467. This value can be used as the fixed VM size. However, because the 90th
percentile does not take care of application workload resources demand for all the time, the rest of the demand (any demand above 90th percentile) can be
handled by statistical multiplexing. The results presented above show that statistical multiplexing is a very viable approach to gaining aggressive
consolidation because not many VM’s resources
leading to a reduction in data center energy intentional and unintentional resource overprovisioning. Because of the dynamic nature of cloud workloads, any resource demand above the fixed VM resources is addressed by statistical multiplexing. We have also shown that statistical multiplexing is a viable approach from an analysis of cloud workloads logs (GWA-T-13) obtained from a production data centre. An evaluation of the proposed algorithm on a simulated cloud data center shows that it can achieve efficient resource utilization and as a result reduce the number physical server required to execute the workload. As future research, we plan to propose a VM allocation algorithm that takes into account VM peak resources demand before allocation. This way, VMs which peak simultaneously do not get co-located.
VI.REFERENCES
[1]. I. Salam, R. Karim and M. Ali, "Proactive dynamic virtual-machine consolidation for energy conservation in cloud data centres," Journal of Cloud ComputingAdvances, Systems for Computing Machinery, vol. 39, no. 1, 2009. [3]. F. P. Sareh, "Energy-Efficient Management of
Resources in Enterprise and Container-based Clouds," The University of Melbourne , 2016. [4]. J. Patel, V. Jindal, I.-L. Yen, F. Bastani, J. Xu
and P. Garraghan, "Workload Estimation for
Improving Resource Management Decisions in the Cloud," in 2015 IEEE Twelfth International Symposium on Autonomous Decentralized Systems, Taichung, Taiwan, 2015.
[5]. G. Hadi and P. Massoud, "Achieving Energy Efficiency in Datacenters by Virtual Machine Sizing, Replication, and Placement," in Energy Efficiency in Data Centers and Clouds, Elsevier Science, 2016.
[6]. R. Neha and J. Rishabh, "Cloud Computing: Architecture and Concept of Virtualization," International Journal of Science, Technology & Management, vol. 4, no. 1, 2015. Customization and Task Mapping Architecture for Efficient Allocation of Cloud Data Center Resources," The Computer Journal, 2015. [9]. ParkMyCloud, "Why Azure Right Sizing is
Important," ParkMyCloud, 2018. [Online]. Available:
https://www.parkmycloud.com/azure-right-sizing/. [Accessed 01 November 2018].
[10]. Google, "Applying Sizing Recommendations for VM Instances," Google, 2018. [Online]. resources provisioning in cloud," Journal of Network and Computer Applications, vol. 82, 2017.
System for Infrastructure as a Service Cloud," Journal of Computational Intelligence and Neuroscience: Hidawi, vol. 2017, 2017.
[13]. M. Chen, H. Zhang, Y.-Y. Su, X. Wang, G. Jiang and K. Yoshihira, "Effective VM sizing in virtualized data centers," in 12th IFIP/IEEE International Symposium on Integrated Network Management (IM 2011) and Workshops, Dublin, Ireland , 2011.
[14]. R. Hu, G. Liu, J. Jiang and L. Wang, "A New Resources Provisioning Method Based on QoS Differentiation and VM Resizing in IaaS," Journal of Mathematical Problems in Engineering - Hidawi, vol. 2015, no. 215147, 2015.
[15]. Delf University, "The Grid Workloads Datasets," Delf University, 2018. [Online]. Available: http://gwa.ewi.tudelft.nl/datasets/. [Accessed October 2 2018].
[16]. P. Xuesong, P. Barbara and V. Monica, "Virtual Machine Profiling for Analyzing Resource Usage of Applications," in International Conference on Services Computing, Milano, Italy, 2018.
[17]. R. Hu, J. Jiang, G. Liu and L. Wang, "Efficient Resources Provisioning Based on Load Forecasting in Cloud," The Scientific World Journal, vol. 2014, no. 321231, 2014.
[18]. D. Jiaqing, S. Nipun and Z. Willy, "Performance profiling in a virtualized environment," in HotCloud'10 Proceedings of the 2nd USENIX conference on Hot topics in cloud computing, Boston, USA, 2010.
Cite this article as :
Kenga Mosoti Derdus, Vincent Oteke Omwenga, Patrick Job Ogao, "Virtual Machine Sizing in Virtualized Public Cloud Data Centres", International Journal of Scientific Research in Computer Science, Engineering and Information Technology (IJSRCSEIT), ISSN : 2456-3307, Volume 5 Issue 3, pp. 583-590, May-June 2019. Available at doi : https://doi.org/10.32628/CSEIT1953124