Annotating Emotion in Meetings
Dennis Reidsma, Dirk Heylen, Roeland Ordelman
Human Media Interaction University of Twente
The Netherlands
{dennisr,heylen,ordelman}@ewi.utwente.nl
Abstract
We present the results of two trials testing procedures for the annotation of emotion and mental state of the AMI corpus. The first procedure is an adaptation of the FeelTrace method, focusing on a continuous labelling of emotion dimensions. The second method is centered around more discrete labeling of segments using categorical labels. The results reported are promising for this hard task.
1.
Introduction
In the context of the European AMI project,“Augmented Multiparty Interaction” more than one hundred hours of video and audio data have been collected of groups of four people engaged in a design meeting. The collection of meetings is being annotated on several layers, ranging from speech transcripts to emotion annotation. Other layers that are being annotated are: named entities, meeting actions, topic segmentation, person location, focus of attention of the participants, dialogue acts, addressees of the dialogue acts, individual acts, head and hand gestures, and posture shifts.
The main purpose of this data collection within the AMI project is to train, through machine learning techniques, au-tomatic recognizers and interpreters of the data that would be able to deliver automatic meta-data which can be used in browsing and retrieval of new recordings. Introducing meta-data on various levels should allow for semantic ac-cess to the recordings of multi-party meetings. Besides this technological goal, the data collection will also be useful for the social sciences, particularly for the study of small group interactions.
One of the annotation layers that was envisaged for the data at the start of the project was the “emotion” layer. It was as-sumed that the meeting data would be interesting for train-ing recognition algorithms for facial expressions and vocal correlates of the emotions expressed. This in turn, would be useful for browsing and retrieval. For instance, hot-spot, conflicts, and strong differences of opinion might be spot-ted in this way.
We have been defining and testing annotation schemes for emotional dimensions. In this paper, we will describe two procedures that have been tried out and the results on the agreement between annotators. In Section 2. we present the results for the FeelTrace analysis. The AMI procedure is presented in Section 3. followed by the agreement results in Section 4..
2.
FeelTrace Trials
For the first trial we adapted the procedure for emotion an-notation developed in Belfast. This consists of two parts, one is tracing the emotional state of a participant continu-ously on two dimensions, arousal and valence, and second, choosing one or two emotion categories from a list of about
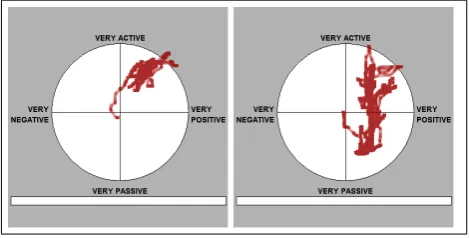
20 emotion words (with the option to add a new category when this was more appropriate). In the trial, we only ex-periment with the first part. We used the FeelTrace program developed in Belfast (Douglas-Cowie et al., 2000). This will play a video and or audio recording and the annota-tors move the mouse within a circle to mark the arousal and valence levels.
Figure 1: FeelTrace of 2 annotators on the same segment.
In the initial trial, we used six ten minute segments. We had ten annotators annotate two or more of these segments. Two of the segments were annotated by each of the ten an-notators. Table 1 presents some agreement results on this data. The rows marked Quadrant, Activation and Evalu-ation present the average and best pairwise agreement on three discretized versions of the traces (a four-quadrant ver-sion, a passive/active interpretation and a positive/negative interpretation). To account for relative offsets between an-notators (e.g. one annotator having a higher threshold for marking something active) we also included three rows marked r-Quadrant, r-Activation and r-Evaluation, which present the same agreement values calculated after recen-tering each annotation so its average value will fall in the origin of the emotion space.
Average Best
Quadrant 0.09 0.68
r-Quadrant 0.13 0.45
Activation 0.12 0.80
r-Activation 0.18 0.79
Evaluation 0.07 0.69
r-Evaluation 0.18 0.78
Table 1: Agreement on FeelTrace Procedure, pairwise com-parison
pairs for which the results are much better. The Quadrant value shows how well the annotators agree on which of the quadrants (positive-active, positive-passive, negative-active or negative-passive) is appropriate.
There are many reasons that can explain the poor results. The training of the annotators might not have been suffi-cient, for one. Secondly, the annotators had to trace the clips (10 minutes) in one go. There is an inevitable de-lay between noticing a change in the mental state of the participant, interpreting this change and moving the pointer around. These lags are different for each annotator. Such problems may be remedied by adjusting the details of how the FeelTrace procedure is executed.
However, the major problem with using the method for the AMI data seems to be that most of the changes in the mental state of participants that one can observe do not re-late to the two emotional dimensions that are captured by the FeelTrace procedure. The major mental states that are identified relate to cognitive processing or expressions of propositional attitudes: “concerned”, “interested”, “doubt-ing”, “distracted”, “uncertain” are more relevant terms for this kind of data.
For the second procedure that has been tried out we have fo-cused on selecting appropriate verbal labels and have made the procedure more discrete in several other ways. The pro-cedure and the results are presented in the next section.
3.
AMI Procedure
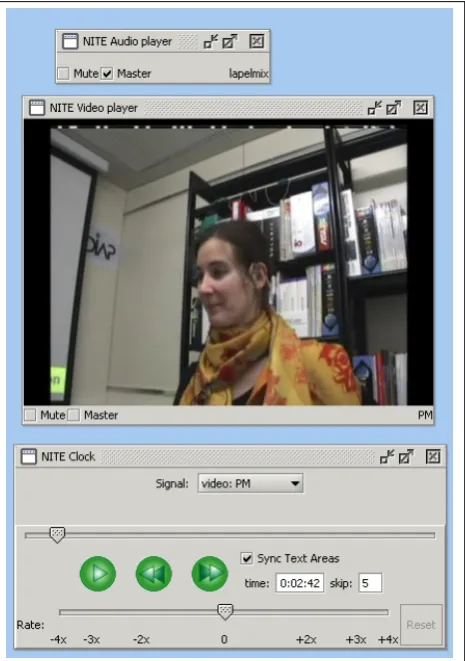
The instructions for the annotator and the whole new pro-cedure were developed after a number of sessions in which the developers of the scheme (i.e. the authors of this paper) watched and analysed several meetings together and indi-vidually; trying to achieve a consensus agreement on seg-mentation and labelling. For each annotation assignment, annotators watch the video recordings of a meeting. They have a choice as to which viewpoints they want to watch. In particular, there are close-up recordings available for ev-ery single participant along with several overview videos that allow one to see the behavior of the participant in con-text of the other participants. There are videos that show the pairs of meeting participants sitting at the same side of the tables and a video track, shot from the side that shows all participants. The close-up recording is generally used for the annotation of mental state, often accompanied by an overview video that provides more information about the context. The annotators can choose which videos they have open for inspection. The annotation task consists of two parts: first, defining “cuts” (segmentation points) in the
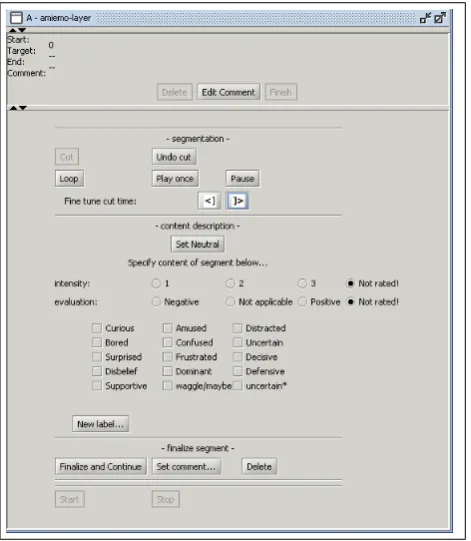
video of a person at places where a distinctive change in the mental state of this person occurs, and second, to fill in a form that describes each segment that is thus created. Figure 2 shows the video and audio controls and Figure 3 shows the annotation controls.
Figure 2: FeelTrace of 2 annotators on the same segment.
The basis of the annotation process is marking up changes in the mental state of the participant in a video. These de-fine the segments for which labels are dede-fined. There are two types of change that we want the annotators to take note of and that consequently should lead to the creation of a segment boundary: a change in mental state type and a clear change in the intensity of the mental state. Being amused, annoyed, angry, happy or relaxed are examples of mental state types.
Figure 3: FeelTrace of 2 annotators on the same segment.
type description “annoyed” with the highest intensity value.
After a segment has been identified. The annotator is asked to fill out the form, indicating whether the segment is neu-tral or not. Also the intensity, polarity and quality of the mental state observed. The intensity is rated on a three-point scale: (1) low intensity, (2) medium intensity and (3) high intensity. A neutral mental state will automatically re-ceive the intensity level 0. The polarity (or evaluation or valence) can be marked as either positive, negative or neu-tral.
The following categories can be ticked on the form that the annotators use: Curious (interested, attentive, focused), Amused (cheerful, joking), Distracted (inattentive), Bored, Confused (puzzled), Uncertain (hesitant), Surprised, Frus-trated (annoyed), Decisive (certain, confident), Disbe-lief (scepsis, doubt), Dominant (challenging), Defensive (apologetic), Supportive. These labels arose from group-ing together several labels that were suggested in pre-trials. The annotator can choose more than one label or add a new label anytime, when he or she feels this is more appropriate.
This procedure has been tried out with six annotators on several fragments of the data. The agreement scores that are discussed in the next section are based on the anno-tation of three of these annotators of one meeting partici-pant in a complete meeting (lasting about 30 minutes). The annotations have been produced using an annotation GUI ((Reidsma et al., 2005)) developed with middleware com-ponents from the NXT API, which yields the data in a stan-dard standoff XML format (Carletta et al., 2003).
4.
Agreement
4.1. Approach
We used two different approaches to analyse the quality of the annotations created with the new AMI procedure. The first approach consists of discretizing the time-line, and cal-culating kappa and alpha using discretized time spans as units. This method is fairly standard. However, it has cer-tain drawbacks in what it can tell us about the data. The pro-cedure does not compensate for differences in the length of segments. If two annotators agree on most segments but the one segment they disagree on is much longer than the other segments this has a negative influence on the agreement value. However, in some cases recognizing smaller frag-ments might be valued as more important than disagreeing on longer stretches. Also, two annotators might differ in the exact segmentation. These differences in timing may be considered less important than the fact that the annotators did label something similar at approximately the same time. These two reasons are pertinent for our annotation proce-dure, where the exact segmentation is of less importance and fuzzy to begin with and where short segments are as important as long segments. To give a concrete example, in the corpus we are annotating, we find many long stretches of neutral values interrupted by semi-long amused stretches and brief segments of ‘surprise’ values. The fact that an an-notator misses a short surprise stretch might weigh heavier than the fact that he or she agreed on a long neutral stretch. To give us more insight in the kinds of differences between annotators, we have developed an extra method of compar-ison in which we try to align the various segments. The alignment results give an indication of how well the anno-tators agree on segments, but ignoring details in length. The alignment procedure is adapted from (Kuper et al., 2003). The position and the length of segments are 2 variables that are used in the calculation of the alignment. The label does not play a role. This will show how annotators agree on the fact that some change occurs but disagree on the precise timing and possibly on the kind of change. Such an analysis may reveal particular characteristics of the data (ambiguity) or a problem with the interpretation of the labels used. This will be presented in more detail in 4.4.. First we discuss the agreement results on time span.
4.2. Agreement on Time spans
When one looks at the overall pairwise agreement on time span, i.e. how much of the time do annotators agree, the results range between 0.061 and 0.443 on Alpha and 0.081 and 0.416 on Kappa Krippendorff1. It is immediately obvi-ous from Table 2 that the results between annotators B and C are far better than between each of these annotators and annotator A.
The different style of annotation of annotator A becomes obvious when one looks at the label distributions.
4.3. Label Distributions
The following tables show the label distribution for each of the three annotators. The following abbreviations are
1
α κ
A - B 0.132 0.081 B - C 0.443 0.416 A - C 0.061 0.055
Table 2: Pairwise Agreement
used for the categories: Amused (A), Supportive (Sp), Cu-rious (C), Disbelief (Db), Distracted (Dt), Uncertain (U), Frustrated (F), Dominant (Do), Bored (B), Decisive (Dc), Neutral (N), Surprised (S), Defensive (Df). As far as the columns ar concerned: (a) lists the relative use of the la-bel, (b) the number of occurrences, (c) the average length of the segments with that label, and (d) the deviation from the average.
Label (a) (b) (c) (d)
A 0.076 26 6.147 3.163
Sp+A 0.002 1 4.467 0.0
C+A 0.007 2 7.782 1.423
Db 0.050 9 11.823 7.213
Dt 0.038 2 40.649 34.399
Db+A 0.085 16 11.122 4.328
C+U 0.001 1 3.125 0.0
F+A 0.003 1 7.515 0.0
Db + C + D 0.031 1 64.922 0.0
B+F 0.011 1 24.233 0.0
Db+Dc 0.025 2 27.165 15.462
Dc 0.013 3 9.541 2.076
U 0.011 3 8.238 0.639
N 0.083 16 10.855 3.547
Do+U 0.064 2 67.889 56.857
Db + B 0.022 2 23.438 12.219
Db+S 0.001 1 4.077 0.0
Df 0.007 3 5.271 2.059
Do+A 0.048 6 16.750 12.009
Db+Do 0.015 2 16.453 13.562
C + A + Df 0.016 1 34.077 0.0
Df + Dc 0.004 1 8.468 0.0
Do + Dc 0.045 3 31.879 33.047
A + U 0.002 1 5.75 0.0
Do + S 0.012 3 9.025 2.538
Db + Df 0.006 1 13.639 0.0
C 0.095 17 11.811 5.723
C + Sp 0.018 2 18.985 4.658
B 0.036 6 12.670 6.212
Sp 0.001 1 2.125 0.0
F + Dc 0.002 1 6.047 0.0
C + Do 0.002 1 5.266 0.0
Do 0.116 9 27.117 19.033
Do + Df 0.028 2 30.180 2.539
Db + C 0.005 1 11.641 0.0
Table 3: Label distributions for A (total time: 2091 sec)
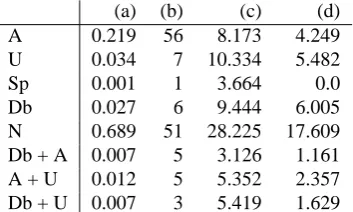
The table shows, for the annotators B and C, a preponder-ance of the labels neutral. amused comes second.None of the other labels get more than 5%. The figures for A are different. In this case, decisive is the label that is applied
(a) (b) (c) (d)
A 0.219 56 8.173 4.249
U 0.034 7 10.334 5.482
Sp 0.001 1 3.664 0.0
Db 0.027 6 9.444 6.005
N 0.689 51 28.225 17.609
Db + A 0.007 5 3.126 1.161
A + U 0.012 5 5.352 2.357
Db + U 0.007 3 5.419 1.629
Table 4: Label distributions for B (total time: 2088 sec)
(a) (b) (c) (d)
S 0.002 1 4.650 0.0
A 0.125 37 7.053 3.279
Dc 0.001 1 2.661 0.0
U 0.006 4 3.600 0.507
Db 0.007 2 7.538 0.549
N 0.847 41 43.140 34.606
Dt 0.001 1 2.484 0.0
Do 0.007 2 7.721 4.593
A + U 0.001 1 2.554 0.0
Table 5: Label distributions for C (total time: 2087 sec)
most of the time. Over 50% of the data is marked with this label, possibly in combination with others. Only about 20% of the time are the labels neutral or amused applied.
4.4. Agreement on Alignment
Figures 4 and 5 visualise the alignment of a few fragments of the annotation. These provide us with more information about the nature of the agreements and disagreements be-tween annotators and the confusion bebe-tween labels.
Figure 4: Alignment Fragment 1
Figure 4 shows a 15 sec extract (13:26-13:40) from the vi-sualisation of the alignment of annotators A (top) and B (bottom). Both annotators have identified 4 segments in this fragment. They agree on the labels for the second and third segment (amusement) and on the intensity, but not on the timing. Whereas annotator B labels the first and the fi-nal segment as neutral, annotator A considers the first to be dominant and the final segment a combination of dom-inant and neutral. The differences in agreement are partly a result of a difference of opinion on labeling and partly on timing.
20 percent of the fragment shows agreement (the portion amusement of A that coincides with that of B). The align-ment, however, provides us with interesting observations on other elements on which annotators agree, for instance, the fact that the fragment is more or less segmented in a similar way. It also provides us with information about the disagreement in timing. Apparently there is much more dis-agreement on determining the onset of amusement than on determining the end of amusement episodes (this is collab-orated by looking at other instances). One consequence of such an analysis might be that the instructions for annota-tion will be reconsidered for such cases.
Figure 5: Alignment Fragment 1
Figure 5 shows about one and a half minute of aligned vi-sualisations (3:13-4:50) of the annotations of annotators C (top) and B (bottom). In this fragment annotator B often applies the label uncertain where C chooses neutral. There are many interesting things to point out in this figure. In the segment marked with the number 5, for instance, there is a difference in labeling of dominant (C) and amused (B). A close analysis of this data leads us to a better understanding of the nature of the data we are dealing with.
Table 6 shows how much of the annotations could be aligned (roughly half for both annotators) and the agree-ment values on this data.
Percentage matched for B: 0.497 Percentage matched for C: 0.521
Alpha: 0.646
Kappa: 0.586
Table 6: Alignment report: amount of successful align-ment, kappa and alpha for B vs C
4.5. Labelset reduction
One might wonder whether the label set that is chosen can-not be improved upon. Possibly some labels are misinter-preted or cover more or less the same phenomena. The distinction between some of the labels is not always ob-vious. For instance, in a meeting paying attention is more or less neutral behavior. The label curious was intended to cover cases where a person pays special attention. The la-bels distracted and bored cover phenomena that are closely related causally. We have conflated some of these labels and looked again at the agreement values. For the results presented in Table 7 we also conflated the labels confused, uncertain and decisive, disbelief, dominant.
Conflation of these labels has a slight positive effect on the agreement values for both time span and alignment agree-ment, as one would expect.
In Table 8 the third and fourth figure in each row indicates how much of the annotation of the first annotator of the
α κ
A-B 0.162 0.078 B-C 0.449 0.416 A-C 0.092 0.066
Table 7: Time span agreement with conflated labels
pair is aligned with the other annotator and how much of the annotation of the second annotator is aligned.
α κ % X- % - Y
A - B 0.376 0.376 0.777 0.868 B - C 0.723 0.616 0.759 0.674 A - C 0.402 0.282 0.565 0.795
Table 8: Alignment agreement with conflated labels
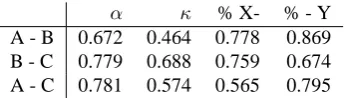
When one conflates all the labels except amused one gets an indication of the agreement on positive versus negative emotions (see Tables 9 and 10).
α κ
A-B 0.553 0.334 B-C 0.529 0.496 A-C 0.432 0.236
Table 9: Time span agreement amused - other
Looking at the differences between different ways to con-flate the labels can lead to a more consistent scheme. Con-flating labels that have high confusion values might be con-sidered if the differences between the labels is not very big semantically speaking and can be ignored for practical pur-poses.
5.
Discussion
Several corpora with emotion annotations have become available ((Craggs and McGee Wood, 2004), (Devillers et al., 2005), (Laskowski and Burger, 2005), (Steidl et al., 2005), to name a few). From the various labeling schemes that have been proposed it appears that the appropriate la-bels one identifies are often specific to the kind of data one encounters; ranging from pure emotion labels to labels that are concerned with emotion-related and other mental states as in our case.
In general, the reliability of annotations is not very high, showing the problems with interpreting behaviors that re-veal these unobservable states.
α κ % X- % - Y A - B 0.672 0.464 0.778 0.869 B - C 0.779 0.688 0.759 0.674 A - C 0.781 0.574 0.565 0.795
Table 10: Alignment agreement amused - other
One of the labeling schemes Laskowski and Burger propose is a two-tier scheme distinguishing descriptions of behavior from descriptions of feeling. The latter is analysed in terms of valence: positive, negative and neutral. The labels for behavior include items such as expressing discontent, at-tempt to amuse, expressing disagreement, doubt, etcetera. To an important extent these labels are comparable with the mental state labels that we have introduced. It would be an interesting exercise to annotate part of the AMI corpus with the scheme proposed by Laskowski and Burger to look for further correlations.
The pairwise interlabeler agreementκranges from .43 to .63.
Craggs and Wood ((Craggs and McGee Wood, 2004)) also present results of assessing an annotation scheme for emo-tion. Their scheme is applied to utterances from a dialogue. They propose three different categorical schemes that dif-fer in the level of granularity. The coarses scheme contains the labels happiness, sadness, worry, hope, surprise while the finest scheme includes labels such as affection, dislike, misery. For each scheme about 11 annotators annotated a dialogue of 52 utterances. Reliability of the scheme was measured by Krippendorff’s Alpha. The results for fine, medium and coarse grained were, 0.329, 0.438 and 0.443, respectively.
6.
Conclusion
The agreement values we get with the current AMI proce-dure are similar to the agreement values on emotion-related annotations by others. Based on the analysis of the current results of the annotations the scheme will be further revised before starting to be applied to a larger portion of the cor-pus. The kinds of analyses that we have discussed in this paper, notably the alignment procedure, has been very use-ful in that way.
Acknowledgements This work was partly supported by the European Union 6th FWP IST Integrated Project AMI (Augmented Multi-party Interaction, FP6-506811, publica-tion AMI-167).
7.
References
J. Carletta, J. Kilgour, T. O’Donnell, S. Evert, and H. Voor-mann. 2003. The NITE object model library for han-dling structured linguistic annotation on multimodal data sets. In Nancy Ide, editor, Proceedings of the EACL Workshop on Language Technology and the Semantic Web (3rd Workshop on NLP and XML, NLPXML-2003). Richard Craggs and Mary McGee Wood. 2004. A cate-gorical annotation scheme for emotion in the linguistic content of dialogue. In Elisabeth Andre, Laila Dybkjaer, Wolfgang Minker, and Paul Heisterkamp, editors, Proc.
of the Affective Dialogue Systems, Tutorial and Research Workshop, pages 89–100. Springer.
L. Devillers, S. Abrilian, and J.C. Martin. 2005. Repre-senting real-life emotions in audiovisual data with non basic emotional patterns and context features.
E. Douglas-Cowie, Roddy Cowie, and Marc Schroeder. 2000. ’feeltrace’: An instrument for recording perceived emotion in real time. In Proceedings of the ISCA Work-shop on Speech and Emotion: A Conceptual Framework for Research, pages 19–24, Belfast. Textflow.
J. Kuper, H. Saggion, H. Cunningham, T. Declerck, F.M.G. de Jong, D. Reidsma, Y. Wilks, and P. Wittenburg. 2003. Intelligent multimedia indexing and retrieval through multi-source information extraction and merging. In 18th International Joint Conference of Artificial Intel-ligence (IJCAI), pages 409–414, Acapulco, Mexico, February.
Kornel Laskowski and Susanne Burger. 2005. Develop-ment of an annotations scheme for emotionally relevant behavior in multiparty meeting speech. In Interspeech (to appear).
D. Reidsma, D.H.W. Hofs, and N. Jovanovic. 2005. De-signing focused and efficient annotation tools. In L.P.J.J. Noldus, F. Grieco, L.W.S. Loijens, and P.H. Zimmerman, editors, Measuring Behaviour, 5th International Con-ference on Methods and Techniques in Behavioral Re-search, page 4, Wageningen, NL, September.